As the two-year anniversary of Barnichon-Nekarda (BN) model forecasts approaches, we wanted to evaluate how our model has performed in real time. This post assesses the model’s forecasts in two dimensions. Because the latest unemployment rate reading garners considerable immediate attention from media, policymakers, and Wall Street every month, we first looked at how the model has done at one-month ahead, or “next month,” forecasts. Second, because forecasts at longer horizons are even more important for policymakers and economic decision makers, we compared our model’s forecasts for the current and next quarter with those of the Survey of Professional Forecasters (SPF).
Next-Month Forecasts
We first compared our model’s one-month ahead forecasts against the market expectation, as reported by Yahoo! Finance, at the time of the release. The results from October 2012 to July 2014 are shown in Figure 1 below.
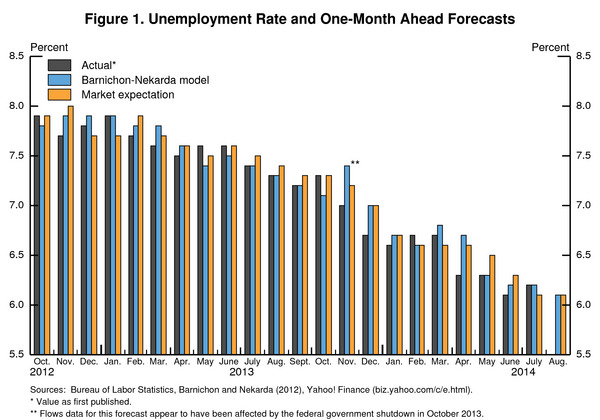
The grey bars plot the unemployment rate as it was first published. The BN model’s forecasts (the blue bars) correctly predicted the unemployment rate 6 times, compared to only once for the market expectation (the orange bars). Although both the model and the market were generally surprised to the downside (that is, the unemployment was lower than expected) over this period, the model’s misses were a bit smaller on average. Quantitatively, we can also evaluate forecasting performance by comparing the mean-squared error of the competing forecasts (see here for more details). Both the model and the market forecast had similar root-mean-squared forecast errors of about 0.2 percentage point over this period.
Current-Quarter and Next-Quarter Forecasts
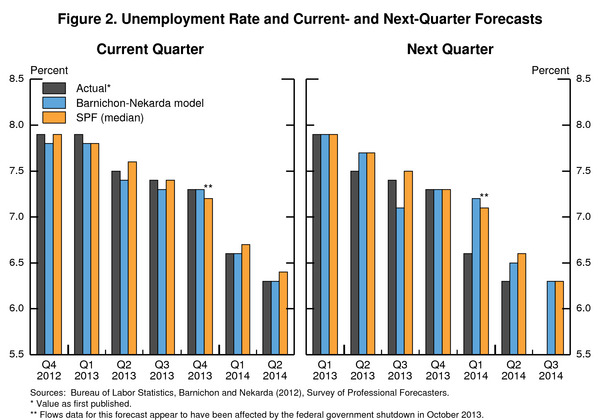
We next turn to forecasts at longer horizons. For this, we compare the model’s performance with the median forecast from the SPF. The SPF forecasts are submitted in February, May, August, and November; we used the model forecast from the same month. As before, we evaluated both forecasts against the unemployment rate as first published. The left panel of figure 2 plots the current-quarter forecasts—which because of the survey timing includes one month of data and two months of forecast—while the right panel plots the next-quarter forecast. Broadly speaking, since 2012:Q4 the BN model performed about as well as the SPF forecast at these horizons.
Looking Ahead
As Figure 1 shows, the BN model predicts the unemployment rate to tick back down to 6.1 percent in August. The market also expects the unemployment rate to be 6.1 percent in August. As shown in the right panel of Figure 2, in May, both the SPF and the model predicted the unemployment rate to average 6.3 percent in the third quarter. Based on data through July, the model now expects the unemployment rate in Q3 to average 6.1 percent and edge down to 6.0 percent in Q4, in line with the most recent SPF survey. See this post for Regis’s discussion of the latest BN model forecast.
The Brookings Institution is committed to quality, independence, and impact.
We are supported by a diverse array of funders. In line with our values and policies, each Brookings publication represents the sole views of its author(s).


Commentary
Brookings vs. Wall Street on Unemployment Forecasting
September 3, 2014