In testimony before the House Subcommittee on Nutrition and Horticulture, Ron Haskins discusses the purposes of the SNAP program.
Chairman Schmidt, Ranking Member Baca, and Members of the Subcommittee:
Thanks for inviting me to testify today. It is a privilege to testify before this important subcommittee on the Supplemental Nutrition Assistance Program (SNAP), one of the nation’s most important means-tested programs.
In accord with my discussions with subcommittee staff, I plan to talk about the purposes of the SNAP program, spending on means-tested programs in general and SNAP in particular, and ways that spending on the SNAP program might be reduced. The last section includes a brief discussion of SNAP work requirements.
Purposes of SNAP
SNAP serves three main functions. The first and most important is to increase the ability of the poor to purchase a nutritionally adequate, albeit low cost, diet. Except in cases of fraud, the benefit can only be spent on food by individuals or families that struggle with low income. The average income (not counting the SNAP benefit) of families receiving SNAP is less than $9,000 per year and few families with income over 130 percent of the poverty level (about $18,000 for a mother and two children) receive the benefit. So the program, with some exceptions, is well targeted.[1] In addition, after years of intense effort by the U.S. Department of Agriculture and the state agencies that administer the program, SNAP payment accuracy has improved greatly and is now the highest it has ever been.[2]
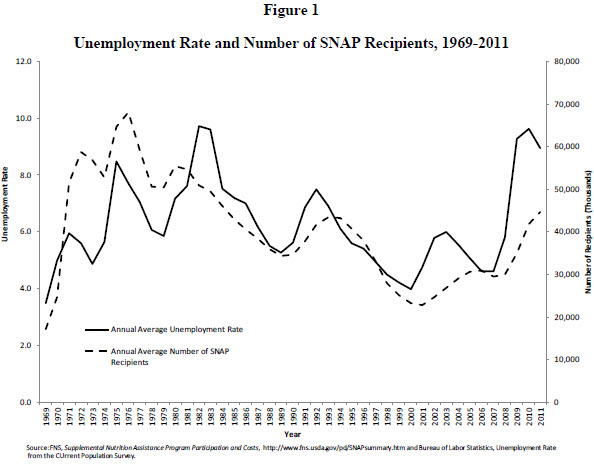
A second purpose of the program is to serve as an economic stabilizer. This purpose of the program serves two ends. From the perspective of poor individuals and families, the program is always available when need increases. Because it is an entitlement, every individual or family who meets the benefit requirements – roughly low income and low resources – can count on the benefit. Technically the United States may not have a guaranteed annual income, but in effect SNAP provides a means-tested guaranteed annual income for which every man, woman, and child in the U.S. is eligible if they meet the income and resources test. Thus it is not surprising that the number of Americans who receive SNAP bears a striking correlation with the state of the economy. As shown in Figure 1, when unemployment goes up, so does SNAP; when unemployment goes down, so does SNAP, although in both cases there is a time lag.[3] Next to Unemployment Compensation, SNAP is probably the nation’s most reliable program for helping disadvantaged families during an economic downturn.
SNAP is also a stabilizer from the perspective of the American economy. Because the number of families getting benefits increases as unemployment and earnings fall during economic downturns, the program serves the Keynesian function of boosting spending during a recession, which in turn stimulates the American economy at a moment when stimulus is needed. The SNAP program fills both of these stabilizing functions automatically without the need for more legislation because of its open-ended entitlement funding.
A third function that seems to be less appreciated than the other two is that food stamps supplements the income of working poor and low-income families.[4] Experience with the 1996 welfare reform law shows that many low-income single mothers are capable of finding jobs and working full time, but they tend to have low wages and to live in poverty as a result of their low wages.[5] Sadly, wages at the bottom of the earnings scale have been stagnant or declining for the past three decades, making it increasingly difficult for single mothers – or any other household that depends on the earnings of one low-skilled worker – to escape from poverty even when they work full time.[6] To improve the financial status of these low-income mothers and to increase their incentive to work, Congress has enacted many laws since roughly the mid-1980s that expand or reform the rules of programs that provide cash or in-kind benefits to low-income working families. These programs include the Earned Income Tax Credit, the Child Tax Credit, Medicaid, child care, and of course SNAP. Indeed, this committee and its Senate counterpart, working with the Bush administration, reformed several administrative requirements of the SNAP program in the 2002 Farm Bill to make it easier for states to administer SNAP in cases in which families have earnings. It is widely believed that these reforms led to increased receipt of SNAP by poor and low-income working families. For the foreseeable future, the nation will have millions of low-income single mothers who work and around 25 percent of these mothers and their children will have earnings below the poverty level.[7] Many of them lack the skills to earn more money. As a result, without earnings subsidies such as SNAP, they and their children will live in poverty on a more or less permanent basis despite their work effort.
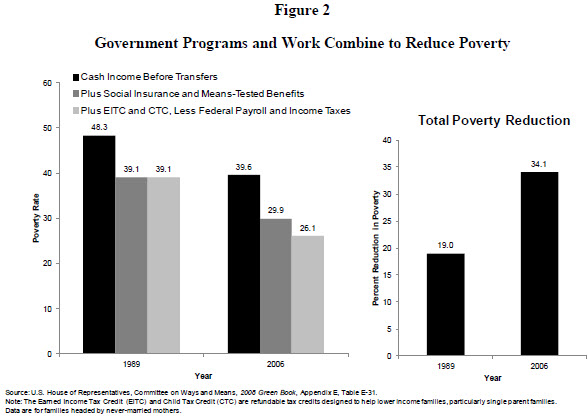
Combating this problem is the major reason the federal government and the states have developed the work support system. Figure 2, taken from an earlier edition of the Ways and Means Committee’s Green Book, illustrates how effective this system is in helping low-income never-married mothers, the most disadvantaged subgroup of single mothers, get themselves and their children out of poverty. The bar graphs on the left in the first panel are for 1989 before passage of the 1996 Welfare Reform Law; the bar graphs on the right in the first panel are for 2006, a decade after welfare reform. Comparing the first bar graph in each set, it can be seen that the poverty rate for these mothers and children before any government taxes or transfers dropped by nearly 20 percent between the two years (from 48.3 percent to 39.6 percent). That’s because so many more never-married mothers were working in 2006. In the four years following welfare reform, there was a 40 percent increase in the share of these mothers who had jobs, a remarkable performance by any measure.[8] Even so, their earnings alone would have left almost 40 percent of these never-married mothers and their children in poverty in 2006, despite the huge increase in work. When SNAP and other in-kind and social insurance benefits received by the families are counted as income, however, the 2006 poverty rate fell by nearly 25 percent to 29.9 percent. As compared with 1989 when many fewer mothers worked, the combination of increased work and government in-kind and insurance benefits produced a poverty level that was almost 25 percent lower in 2006. Further, when we add the work support benefits that come through the tax code – primarily the EITC and the Child Tax Credit – poverty does not fall at all in 1989 but falls another 13 percent in 2006. The reasons the tax benefits reduced poverty so much in 2006 is that many more of these never-married mothers were working and the tax code benefits are based on earnings.
As shown by the second panel in Figure 2, the work support system reduced poverty by only 19 percent in 1989 but by 34 percent in 2006. Clearly, the work effort of disadvantaged mothers, combined with benefits from the work support system, greatly reduced poverty among these mothers and children.
Other than providing Social Security to the elderly, this combination of work requirements in the cash welfare program (Temporary Assistance for Needy Families) and work supports is the most effective strategy the federal government has developed to reduce poverty. And the best part is that there is something in this strategy for everyone to like because it is based both on personal responsibility and on government help premised on personal effort. I would emphasize for the Subcommittee the important role of SNAP benefits in this poverty reduction. An analysis performed for Brookings using data from the Census Bureau’s Survey of Income and Program Participation (SIPP) showed that of the 1.7 million mothers who supplemented their earnings with SNAP benefits in 2010, the average monthly SNAP benefit of $354 constituted 20 percent of their income. Thus, without SNAP, many more of these families would have been in poverty (as Figure 2 shows). In fact, if the cash value of SNAP benefits is subtracted from the income of families with working mothers, another 1.1 million mothers and their children would fall below the poverty level in an average month in 2010. Moreover, the same SIPP analysis shows that over 40 percent of single moms with incomes between 100 percent and 149 percent of the poverty level received SNAP benefits.[9] It is reasonable to view these single mothers as doing what the public expects them to do by working, many of them full time. Government in turn rewards their work effort by supplementing their earnings and thereby substantially reducing poverty.
Thus, the SNAP program performs many important functions and performs them fairly well. This does not mean that the program cannot be improved or that it would be a huge blow to the poor to reduce spending on the program, depending on how deep the cuts are and how they are engineered. Before considering the search for SNAP savings, we should briefly review spending on SNAP and other means-tested programs.
Spending on Means-Tested Programs and SNAP
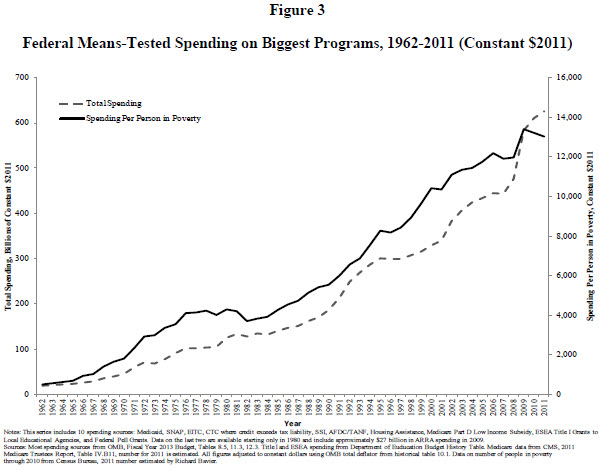
The dotted line in Figure 3, based on a Brookings analysis of federal budget data published by the Office of Management and Budget, shows federal spending since 1962 in the ten means-tested programs that spent the most money in 2011, the second biggest of which is SNAP. We estimate that in 2011 about 87 percent of the spending in these ten programs was on entitlement programs, including SNAP.[10] The figure shows that federal spending on poor and low-income Americans has increased enormously. Since 1980, by which time all but two of the ten biggest programs were in place, spending has increased by about $500 billion, from $126 billion to $626 billion after adjusting for inflation. The solid line in Figure 3 expresses the increase in federal means-tested spending as spending per person in poverty. Expressed in this way, over the past five decades, federal spending on major means-tested programs has increased from about $516 to a little more than $13,034 per person in poverty. If we use the figure on spending per person in poverty in 1980, when most of the major means-tested programs were in place, the increase is from about $4,300 to $13,000 per person or more than $3 spent in 2011 for every dollar spent in 1980.[11]
More recently, means-tested spending increased from about $477 billion to $626 billion in the three years of the Obama administration, an increase of about 31 percent. However, the recession that began in December 2007 and the increase in poverty during and following the recession is an important part of the explanation for increased means-tested spending during the Obama administration. Many programs, including SNAP, increased automatically when poverty rose during the recession. In addition, spending on a host of poverty programs, again including SNAP, was boosted still further by temporary provisions in the 2009 American Recovery and Reinvestment Act (ARRA). Yet because the increase in the number of poor people was so high, spending per person in poverty increased by only about 9 percent as contrasted with the 31 percent increase in total spending during the first three years of the Obama administration. In fact, spending per person in poverty actually fell in both 2010 and 2011. Much of the portion of the rise in means-tested spending that was authorized as part of the ARRA expired after 2010, although SNAP benefits are an exception as we will see below.
Three additional points should be made about total means-tested spending by the federal government. First, while it is true that the nation’s major means-tested health programs account for nearly 45 percent of all the means-tested spending today and a little less than half of the increase in means-tested spending since 1980, nearly all the other programs have increased substantially as well. Between 1980 and 2011, for example, the EITC increased from $3.4 billion to $55.7 billion, the Supplemental Security Income program from $15.3 billion to $49.6 billion, and the housing programs from $14.5 billion to $45.9 billion. Second, it should be kept in mind that these spending data are for only the ten largest means-tested programs. The Congressional Research Service estimates that in 2009, spending on these ten programs represented about 75 percent of total federal means-tested spending.[12] If that percentage remained roughly the same for 2011, total federal means-tested spending in that year was closer to $835 billion than the $626 billion spent on the ten biggest programs. Third, states also spend a great deal of money on means-tested programs. In previous testimony before the House Budget Committee, I estimated state spending at about 25 percent of federal spending, which would bring total federal and state spending on means-tested programs to over $1 trillion in 2011.[13]
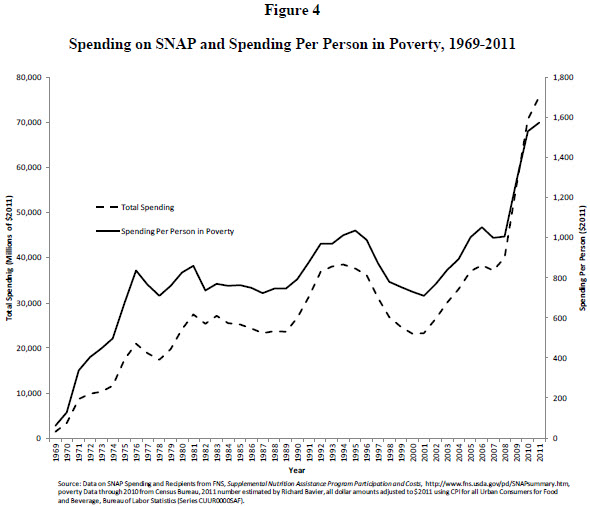
Turning now to spending specifically on the SNAP program, the dotted line in Figure 4 shows that, like other means-tested programs, spending on SNAP has increased dramatically over the years (all figures given below are in constant 2011 dollars). SNAP spending was $24.2 billion in 1980, $26.6 billion in 1990, and $75.7 billion in 2011. As the solid line in Figure 4 shows, SNAP spending per person in poverty, despite some fluctuations over the years, has increased greatly since 1969. As compared with its previous per-person-in-poverty peak in 1995, this figure had increased from $1,034 to $1,575 by 2011. By either of these measures, SNAP spending has increased over the years.
As mentioned above, the SNAP spending figures for recent years were substantially increased by the ARRA. The effect of the ARRA expansion was to increase the benefit of the average SNAP household by about 15 percent. The ARRA increases translated to increases of $24, $44, $63, and $80 a month for one-person, two-person, three-person, and four-person households respectively, although all these figures have declined since enactment of the ARRA. The cost of the increased benefits was around $57 billion. Although the benefit increases were originally expected to last until 2018, subsequent legislation altered the original ARRA provision so that the across-the-board SNAP increases will terminate in 2014, saving well over $14 billion.[14]
Controlling SNAP Spending
It is no secret that the federal government is facing an unprecedented fiscal crisis. In contrast with the United State Senate, the House has adopted a budget each year for the past two years that, if enacted, would actually reduce the nation’s annual deficit and the amount of debt held by the public as a percentage of GDP. Since 2003, some of my Brookings colleagues and I have been writing about the dramatic threat to the nation’s future imposed by the profligacy of federal spending as compared with federal revenues.[15] One conclusion that I have come to about deficit reduction is that Congress will be more successful if sacrifice is shared – albeit not necessarily equally – by all parts of the federal budget in order to achieve something approaching fiscal sanity. Discretionary spending was a good place to begin, but that well is nearly dry. Now the federal government needs cuts or moderated increases in entitlement spending (especially Medicare) and additional revenues. “Spread the pain” should be the motto of budget cutters. Although I have spent almost all my entire career thinking about, writing about, and working on legislation affecting the nation’s poor, I believe that means-tested programs, including SNAP, must be controlled either by reducing the rate of spending increases or by actual reductions in the amount spent.
In this section I consider four options for moderating or reducing spending on SNAP.[16] The first two options have received attention by both the House and Senate Agriculture Committees and by advocacy groups that defend the SNAP program. Both options would modify a program simplification rule that has a direct impact on the level of SNAP benefits received by many households. The fundamental purpose of SNAP is to augment the food purchasing power of households that may not have enough money to buy nutritious food. To make the determination of how much money the household has to purchase food, SNAP allows households to deduct certain standard expenses from income before computing the eligibility for and level of the SNAP benefit. One of the biggest deductions is the shelter deduction, including spending on utilities. Because documenting utility costs requires lots of paperwork and document verification, states are allowed to have a Standard Utility Allowance that can be claimed by any household that can show it pays out-of-pocket utility costs. Such households are not required to submit all their utility bills each month, thereby saving a lot of hassle for recipients and administrative expenses for states. Another administrative simplification is that households that receive help from the Low-Income Home Energy Assistance Program (LIHEAP) are assumed to be eligible for the Standard Utility Allowance by virtue of the fact that their receipt of LIHEAP demonstrates need. As they often do, states have taken advantage of the LIHEAP simplification rule by giving some households a token LIHEAP benefit of, say, $1 which thereby qualifies the household for the shelter deduction and saves both the recipient and the state lots of administrative hassle.
Two of the cost-savings reforms now in play would modify the Standard Utility Allowance. One proposal would require states that game the system by granting token LIHEAP benefits to provide LIHEAP benefits of at least $10 in order to qualify for the exemption. This proposal would save about $4.5 billion over ten years. A second proposal would repeal the entire LIHEAP-SNAP link so that families that receive the allowance would need to show their utility bills in order to receive the utility portion of the deduction. This proposal would save around $15 billion over ten years. At least part of the savings in both proposals are based on the assumption that some households that have to experience the hassle of showing some or all utility bills would forego the utility deduction. The tendency for some families to accept the lower benefit by avoiding the hassle of showing utility bills would be strengthened by the fact that most of them would still receive a SNAP benefit; the effect of the policy change would be to reduce the size of the SNAP benefit, not to eliminate it altogether for most households. In effect, these proposals save money by reducing the size of the SNAP benefit. Losing part of the SNAP benefit certainly does not help these households, but most of them would still receive a SNAP benefit.
A third policy change that would save money, and one already enacted by the House Budget Committee, would be to convert SNAP to a block grant and reduce the amount of money in the block grant as compared with spending under current law. The Congressional Budget Office (CBO) estimates that spending on SNAP will decline from $80 billion in 2012 to $73[17] billion in 2021[18]as the economy recovers. Thus, funding in the block grant would have to be lower than the amount by which SNAP is already projected to decline.[19] The more general point on block grant funding is that Congress can save a great deal of money by lowering the number of federal dollars in the block grant each year below the CBO spending baseline.
Because the 1996 Welfare Reform Law converted the Aid to Families with Dependent Children program from an open-ended entitlement like the current SNAP program to a block grant with capped funding, the federal government has experience with what happens when states receive block grant funding. The new program created in 1996 was the Temporary Assistance for Needy Families (TANF) program, a block grant of $16.5 billion that gave states enormous flexibility as long as they met program requirements, especially the stringent work requirements, and spent the money on poor and low-income families. Three lessons of the decade and a half experience with TANF should be considered as Congress contemplates a SNAP block grant. The first is that the value of a capped block grant declines every year due to inflation. The $16.5 billion TANF block grant has lost about one-third of its value since the mid-1990s. In the case of the SNAP program, the explicit purpose of converting the open-ended entitlement to a block grant is to save money. Still, in assessing the adequacy of funding in any block grant with capped funding, Congress must take into account the fact that without an inflation adjustment, the value of the block grant will actually decline even faster than whatever annual caps are placed on the block grant.
The second lesson taught by experience with the TANF block grant is that unless the uses of a potential SNAP block grant funds are tightly specified, states will use the flexibility inherent in a block grant to spend the money for many purposes other than providing food subsidies. In a 2006 report, for example, the Government Accountability Office reported that states “used federal and state TANF funds to support a broad range of services, in contrast to 1995 when spending priorities focused more on cash assistance.”[20] Thus, although TANF was built on a program that focused almost all its resources on cash subsidies for destitute families, states now use TANF funds for child care and early childhood education, child protection, and other social services. Since its inception in the 1960s, the major goal of the SNAP program has been to help families purchase nutritious food. Unless Congress wants to diffuse the use of SNAP funds to other purposes, language in the block grant must be clear that funds can only be spent to help families purchase food or for closely related purposes. Some members of Congress may wish to give states more flexibility in the use of a SNAP block grant, but they should do so with full realization that providing such flexibility to states will result in some of the money being spent on programs that have little or nothing to do with nutrition.
A final way to save money in the SNAP program is to strengthen the program’s work requirements. Indeed, more American must work and earn all or most of their household income if federal and state governments are to move in the direction of fiscal solvency. The current SNAP program has work requirements that look strong on paper. These include the requirement that non-disabled and non-elderly recipients register for work, accept a job if offered, search for work or meet other work requirements that states impose (and are approved by the Department of Agriculture). In addition, recipients cannot quit a job or voluntarily reduce their hours of work to less than 30. A separate provision, often called the ABAWD (able-bodied adults without dependents) rule, recipients between the ages of 18 and 50 who have no dependents must work at least 20 hours per week or they can qualify for SNAP benefits for only 3 months (6 months under some circumstances if they lose a job) in a given 36 month period.[21]
But these requirements do not seem to be rigorously enforced. In fact, the administration has requested that the ABAWD rule be suspended for 2013 (as it was for part of 2009 and 2010). But those who think able-bodied welfare recipients should be required to work may want to strengthen the SNAP work requirements. If the Agriculture Committee decided to move in this direction, at least three changes in federal law would be required. First, federal law should set participation standards stipulating the percentage of non-exempt adults receiving SNAP who must engage in, say, 20 hours of work-related activity each week. The TANF program requires states to meet a 50 percent participation standard and that standard seems reasonable for the SNAP program as well. Second, SNAP would need to impose fines on individuals, including complete disqualification from the program, for noncompliance with work requirements. States already have the authority to impose sanctions, but states must use the sanctions more extensively if they are to have their intended impact. Like SNAP recipients, states that fail to meet their work requirements would also be subject to financial sanction. The goal of sanctions on states is to get them to implement the SNAP work requirements as aggressively as they implemented the TANF work requirements after the 1996 welfare reforms. Third, states will need additional funding to operate their employment programs. The administration has requested $218,873,000 for 2013 to reimburse states at 50 percent to operate their employment and training programs.[22] Although my view is that job search is the most effective use of funds, the SNAP employment and training account currently will pay for job search training and support, workfare, educational activities, and self-employment training. The Agriculture Committee would have to explore the cost of imposing a 50 percent work requirement on states, perhaps phased-in over five years beginning at 20 percent, with the Congressional Budget Office. However, about 60 percent of SNAP recipients would be exempt from the work requirement because of age or disability (in 2010, 47 percent were children, 8 percent were elderly, and 6 percent were disabled).[23] Although there would certainly be up-front costs, in the long run extensive and rigorous research on work requirements in the cash welfare program shows that there would be budget savings for federal, state, and local governments.[24]
Conclusion
As Congress considers savings in means-tested programs in general and the SNAP program in particular, it would be wise to review the costs of policies designed to reduce spending as well as the savings from such policies. Just as policymakers are concerned about costs and benefits when they consider creating new programs, the same review of costs and benefits should be applied to decisions about achieving savings through cuts in existing programs. As we have seen, the SNAP program performs several functions in admirable fashion: it stabilizes individual and family income more reliably than any other means-tested program; it creates a counter-cyclical force in the American economy by automatically rising during periods of increased unemployment and falling as employment recovers; it serves as a work incentive for millions of working families (but not all working families); and it substantially reduces poverty among low-income working families. In my view, it does not follow that the SNAP program should be off the table as Congress struggles to find ways to reduce the nation’s budget deficit. Unless Congress takes action on the deficit now, and especially on government spending, the actions we will be forced to take later will make even what seem like difficult changes in SNAP and other means-tested programs today seem rather modest. At least for now, the achievements of the SNAP program should lead policymakers to keep cuts moderate and to do as little damage as possible to the ways in which SNAP achieves its many purposes. If I could protect individual means-tested programs from the deficit-reducing scalpel (or ax), SNAP would be high on my list of protected programs. But given the seriousness of the budget crisis, and the need to extend program cuts to entitlement spending, the SNAP program should not be completely protected. Even so, because no other program fulfills such a diverse array of worthy goals as effectively as SNAP, cuts should be made with caution.
[1] Congressional Budget Office, “The Supplemental Nutrition Assistance Program,” Washington, DC: Author, April 2013.
[2] Dorothy Rosenbaum, “SNAP Is Effective and Efficient,” Washington, DC: Center on Budget and Policy Priorities, April 2012.
[3] Congressional Budget Office, “The Supplemental Nutrition Assistance Program.”
[4] Because SNAP phases out as earnings from work rise, SNAP also is a work disincentive for some families. Research shows that without SNAP and other means-tested benefits, more people would work and unemployment spells would be shorter. See Casey B. Mulligan, “Means-Tested Subsidies and Economic Performance since 2007,” NBER Working Paper Series No. 17445; Cambridge: National Bureau of Economic Research, 2011, available at
http://www.nber.org/papers/w17445.
[5] Ron Haskins, Work over Welfare: The Inside Story of the 1996 Welfare Reform Law (Washington: Brookings, 2006), Chapter 15.
[6] Gary Burtless and Ron Haskins, “Inequality, Economic Mobility, and Social Policy,” in Peter H. Schuck and James Q. Wilson, eds., Understanding America: The Anatomy of an Exceptional Nation (New York: Public Affairs, 2008), pp. 495-538.
[7] U.S. Census Bureau, America’s Families and Living Arrangements: 2011, “Table FG5. One-Parent Unmarried Family Groups with Own Children Under 18, by Labor Force Status of the Reference Person: 2011,” available at http://www.census.gov/hhes/families/data/cps2011.html.
[8] Ron Haskins, “Balancing Work and Solidarity in the Western Democracies,” (Berlin: Social Science Research Center Berlin, October 2010).
[9] Richard Bavier, personal communications, May 3-4, 2011.
[10] Housing, Title I grants to local education agencies, and half of Pell Grants were counted as non-entitlement spending. Thus, $545.0 of total spending of $626.2 or 87 percent was entitlement spending in 2011.
[11] The number of people in poverty in 2011 will not be published by the Census Bureau until next fall. Based on a model designed by Richard Bavier, a former senior official at OMB, that has successfully predicted the poverty level for the past several years, poverty increased by .6 percentage points in 2011, bringing the poverty rate to 15.7 percent in that year. According to the American Community Survey, the population of the United States in 2011 was 306 million. Thus, around 48,042,000 people were poor in 2011. This is the figure used to compute means-tested spending per person in poverty for 2011.
[12] Karen Spar, “Federal Benefits and Services for People with Low Income: Programs, Policy, and Spending, FY2008-FY2009” (R41625), (Washington: Congressional Research Service, January 2011), p. 12.
[13] Ron Haskins, Statement to the House, Committee on the Budget, Strengthening the Safety Net, hearing, April 17, 2012, available at http://budget.house.gov/UploadedFiles/haskinstestimony4172012.pdf.
[14] Joe Richardson, Jim Monke, and Gene Falk, “Reducing SNAP (Food Stamp) Benefits Provided by the ARRA: P.L. 111-26 & S. 3307” (R41374), (Washington: Congressional Research Service, August 2010).
[15] Alice M. Rivlin and Isabel Sawhill, eds., Restoring Fiscal Sanity: How to Balance the Budget (Washington: Brookings Institution Press, 2004); Alice M. Rivlin and Isabel Sawhill, eds., Restoring Fiscal Sanity 2005: Meeting the Long-Run Challenges (Washington: Brookings Institution Press, 2005); Brookings-Heritage Fiscal Seminar, Taking Back Our Fiscal Future (Washington: The Brookings Institution and The Heritage Foundation, 2008); Ron Haskins and others, Premium Support: A Primer (Washington: The Brookings Institution, Budgeting for National Priorities Project, 2011).
[16] The Congressional Budget Office has outlined four categories of ways to reducing spending in the SNAP program. These four approaches are to change program rules to reduce the number of people in the program, change rules to reduce benefits, change the way the program is administered such as penalties on states that make overpayments to recipients, and changing the program to a block grant; see Congressional Budget Office, “The Supplemental Nutrition Assistance Program,” (Washington: Author, April 2013), pp. 8-12.
[17] Inflation will erode the value of benefits to around $59 billion in 2022.
[18] Congressional Budget Office, The Budget and Economic Outlook: Fiscal Years 2012 to 2022 (Washington: Author, January 2012), p. 52.
[19] Congressional Budget Office, “The Supplemental Nutrition Assistance Program,” (Washington: Author, April 2013), p. 4 and Figure 2.
[20] Government Accountability Office, “Better Information Needed to Understand Trends in States’ Uses of the TANF Block Grant,” (GAO-06-414), (Washington: Author, 2006).
[21] Congressional Budget Office, “The Supplemental Nutrition Assistance Program.”
[22] Department of Agriculture, “2013 Explanatory Notes,” available at: http://www.obpa.usda.gov/30fns2013notes.pdf.
[23] Congressional Budget Office, “The Supplemental Nutrition Assistance Program.”
[24] David A. Long, “The Budgetary Implications of Welfare Reform: Lessons from Four State Initiatives,” Journal of Policy Analysis and Management 7, no. 2 (1981): 289-299.


Commentary
TestimonyReflecting on SNAP: Purposes, Spending, and Potential Savings
May 8, 2012