INTRODUCTION
A Quick Review of the Recently-Released Data on Poverty for 2007
The Census Bureau recently released the official numbers on income and poverty last year (2007) in the United States. Let me underscore a few of the key facts that these data illustrate.
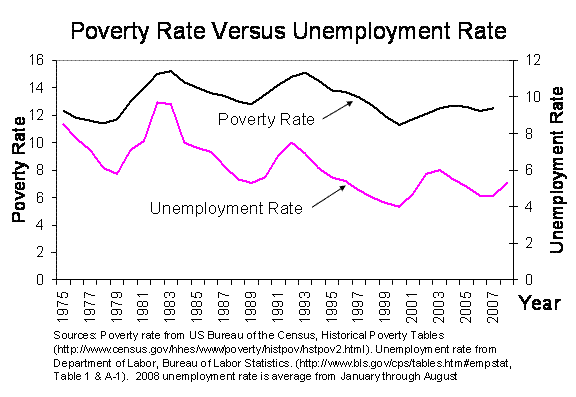
First, poverty did not fall to any appreciable extent during the economic expansion of the 2000s. This is quite unusual. Figure 1 shows the poverty rate and the unemployment rate. In past decades, these two indicators have moved together. When unemployment fell in the 1980s expansion, so did poverty. Unemployment and poverty both fell rapidly in the strong expansion of the 1990s. But when unemployment fell after 2003, poverty remained essentially flat.

The increase in poverty in 2007 is surprising. This was a year when GDP growth averaged 2%, with two quarters of GDP growth in excess of 4.5%. Average unemployment was largely the same as in the previous year. This does not bode well for 2008 when all economic indicators look far worse.
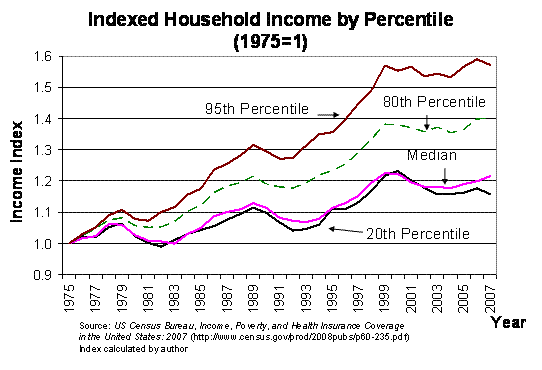
Second, the rise in poverty reflects the generally sluggish growth in income by all families in the bottom half of the income distribution. Figure 2 shows an index of household income growth at the 20th, 50th, 80th and 95th percentiles of the income distribution over the last 30 years. Income among the bottom 20 percent grew as fast (or as slowly) as among those at the median (the 50th percentile) throughout this period. While these lower-income families achieved significant income gains over the last 30 years, particularly over the 1990s, both families in the middle of the income distribution and those at the bottom have lower household incomes in 2007 than they had in 2000. While incomes at the top of the distribution incomes have not risen rapidly in the 2000s, they have risen over the past 10 years. 
If 2007 data didn’t look as good as we might have hoped, we should expect 2008 data to be far worse. Given rapidly rising unemployment since the first of the year — a problem that could accelerate with the economic news of recent weeks – poverty is going to be a major issue in the policy discussion for any new administration in 2009.
What Does This Poverty Measure Indicate?
I have been asked to spend most of this testimony focused not on the numbers, but on the poverty measure itself. There is widespread agreement that our poverty measure is badly flawed and needs to be updated. A bill to produce a modern poverty measure was just introduced in the House (HR 6941) and will soon be introduced in the Senate. As a scholar, I have been involved in the discussion of poverty measurement for many years. I served on the National Academy of Science’s panel in the mid-1990s that recommended a methodology for improving poverty measure, and have written about this topic (Blank 2008).
The current poverty measure was defined in 1963 by a Mollie Orshansky, a staffer in the Social Security Administration. She proposed both a way to measure an official poverty line, and a way to count family resources, comparing them to the poverty line to see if a family was poor or not. Let me talk about each in turn.
The current poverty line: Orshansky created a poverty line using the calculation
Poverty line = 3 x Subsistence food budget
The subsistence food budget was the Economy Food Plan developed by the USDA in 1961, using data from the 1955 Household Consumption Survey. The multiplier of 3 was used because the average family of three or more spent one-third of their after-tax income on food in the 1955 data. If the average family spent one-third of its income on food, then three times a minimal food budget provided an estimated poverty threshold. This number was adjusted for families of different sizes.
With only minor changes, the current poverty line is this number, calculated in 1963, based on 1955 data, and updated by the Consumer Price index in the following years. There is no other economic statistic in use today that relies on 1955 data and methods developed in the early 1960s. In the years since, food prices have fallen, housing prices have risen, and medical expenses have grown enormously. In short, consumption patterns have changed dramatically but our poverty line does not reflect these changes.
Defining family resources: The resource measure in Orshansky’s calculation was simply a family’s cash income. Forty-five years later, this definition is also seriously flawed, as cash income alone is no longer an adequate description of the economic resources available to low-income families. There is broad agreement that the resource measure should reflect a family’s disposable income, that is, the income that a family has available for buying necessities, minus taxes and other mandatory expenditures. However, the gap between cash income (the current resource measure) and disposable income is large for low-income families.
In the years since the current definition was developed, the biggest expansions in anti-poverty assistance have come through the tax system, such as the expansion in the Earned Income Tax Credit (EITC), or through in-kind benefits, such as growth in the Food Stamp Program or in Section 8 housing vouchers. Because the historical poverty measure is based only on family cash income, it is unaffected by many of these changes:
- If a disabled individual starts to receive Medicaid assistance and has lower out-of-pocket medical expenses, this does not affect his poverty status;
- If a family receives food stamps and has more income left over for other purchases, this does not affect their poverty status;
- If a worker receives an EITC refund check, this does not affect her poverty status.
Why does this matter? Our measured poverty rate is insensitive to many of the most significant policy changes designed to help low-income families that we’ve made in this country. This made it easy to claim that public spending on the poor had little effect. But the problem was not the policies, but the statistic we used to measure the problem. In a fundamental way, our poverty measure has under-counted policy gains, and made it easy to claim that public spending on the poor had little effect.
The only group who has experienced a major decline in the official poverty data over the past 30 years is the elderly. It is not a coincidence that the elderly are the one group for whom we have provided greatly expanded assistance in the form of cash income, through expansions in Social Security and in Supplemental Security income. Hence, our assistance to this group was reflected in our official statistics.
None of this says that the historical poverty measure is entirely meaningless. It does capture cash income movements, which largely reflect changes in employment and in wages. In a year – like 2007 – in which there were no major tax or policy changes, the movement in the historical poverty measure shows how economic changes are affecting low-income families. But we can and should do better, with a poverty measure that reflects policy changes as well as economic changes.


Commentary
TestimonyHow Can We Reduce the Rising Number of American Families Living in Poverty?
September 25, 2008