Chairman Murray, Ranking Member Sessions, and members of the Committee, thank you for the opportunity to offer my thoughts on the recent progress made in containing health care costs and the challenges that still lie ahead. Our nation has struggled with the burden of our health care costs and spending, approximately 18% of our GDP and rising, which has eroded wage growth, diminished our ability to invest in our children’s education, and challenged our global competitiveness. There are promising signs that federal programs and policies, as well as aggressive private sector activities, have helped to curb cost growth in Medicare and overall health expenditures. However, even if we continue to reduce the growth of health care costs and improve overall value, demographic trends and constrained state and local budgets will drive health and retirement spending toward an even larger share of the economy. By 2030, one in five Americans will be over age 65, compared with only one in eight today, and per capita medical costs in a given year are approximately three times greater for those 65 and over than for younger individuals. We must make difficult decisions in the coming years to encourage system-wide cost containment and sustainable health care transformation. Today, I am honored to present some solutions from my work at the Engelberg Center for Health Care Reform at The Brookings Institution, as a Commissioner on the National Commission on Physician Payment Reform[1], and perhaps most importantly, as a practicing internal medicine physician.
Overview of Health Care Cost Trends
Health care costs have dramatically escalated over time, though the rate of that growth has slowed in recent years. In 1970, national health expenditures totaled 74.9 billion dollars, or 7.2 percent of GDP. In 1990, total spending increased ten-fold and amounted to 724.3 billion dollars or 12.5 percent of GDP. Based on the most recent figures from the Centers for Medicare & Medicaid Services (CMS), as of 2011, costs have ballooned to more than 2.7 trillion dollars and account for approximately 18 percent of GDP.[2] The Institute of Medicine (IOM) estimates that almost 30 percent of these costs, or 765 billion dollars, are attributable to wasteful spending in poor care delivery, excessive administrative costs, unnecessarily high prices, and fraud.[3]
Amidst rapidly escalating prices, the annual rate of cost growth has slowed in recent years. Each year between 1980 and 1990, costs rose an average of 11 percent. From 2000-2007, annual costs grew by an average of 7.6 percent. But since 2009, costs have escalated by just 3.9 percent each year[4],[5], and have been trending downward since 2002. The reason for this recent decline is likely multi-factorial. Possible explanations include sustained unemployment and lower overall spending during the recession; structural improvements to the health care system codified in the Patient Protection and Affordable Care Act in 2010; and an increase in out-of-pocket spending due to less generous employer-provided insurance plans.
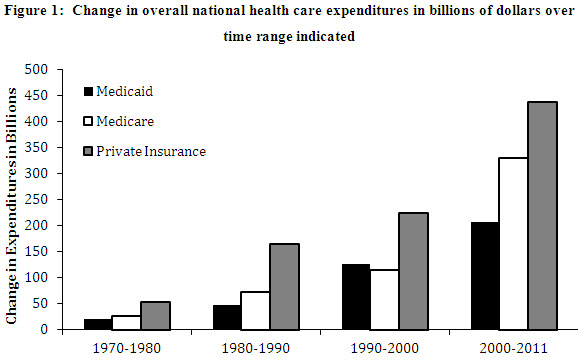
In looking more closely at spending trends by payer, Figure 1 highlights how quickly expenditures in the public and private sectors have risen in recent years:
- From 1970-2000, the costs of Medicare and Medicaid rose 217.1 billion dollars and 195.2 billion dollars, respectively[6]
- From 2000-2011, costs in Medicare increased 329.5 billion dollars and in Medicaid, 207.2 billion dollars
- Private sector costs rose 443.8 billion dollars from 1970-2000 and 437.1 billion dollars from 2000-2011[7]
Based the data presented in Figure 1, the increase in overall combined expenditures in the public and private sectors over the past eleven years are greater than the total expenditures during the preceding 30 years. Across all payers, Medicare spending has increased most drastically over that time.
Based on the current state of health care legislation, the Congressional Budget Office (CBO) estimates that the cost of the Medicare program will be approximately 6.4 trillion dollars from 2013-2022.[8]
Historical Trends of Health Care Expenditures Across Care Continuum
Examining the variance of costs across the continuum of care is important for understanding where and how health care costs distribute. Table 1 provides longitudinal Medicare data on physician and clinical services (largely the outpatient setting), hospital care (inpatient), post-acute care spending, spending on prescription drugs and medical products (durable medical equipment, and other non-durable medical products). Table 2 provides analogous data for the private sector.
Table 1: Medicare Spending Across the Continuum of Care[9]*
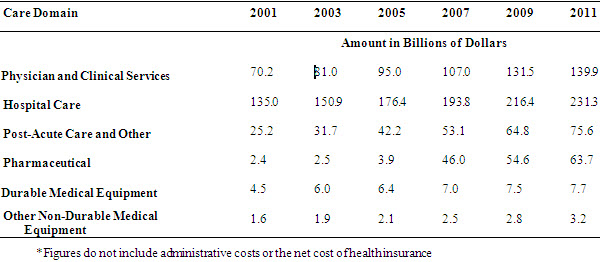
Table 2: Private Sector Spending Across the Continuum of Care[10]*
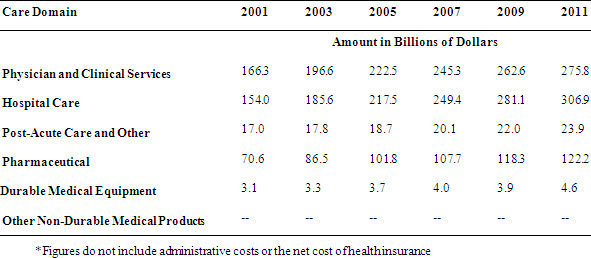
There are a couple of notable trends in spending across the continuum of care based on payer. First, Medicare’s total expenditures are highest for inpatient hospital care, whereas outpatient care consumes the largest portion of private sector spending. However, the rate of growth is inverted—the growth rate of inpatient expenditures is greater in the private sector when compared to Medicare and the outpatient or ambulatory costs have risen at a greater rate in the public sector. Second, growth in pharmaceutical spending, while certainly explained by the introduction of Medicare Part D, continues to be a growing share in both the private and public sector. These trends illustrate both challenges and opportunities for savings—namely, that while attention is being paid to costly inpatient admissions, we must also look thoughtfully at innovations and utilization in the ambulatory setting in Medicare. Additionally, as inpatient costs decrease in Medicare, yet hospital bed growth is increasing in certain geographic areas, it will be important to understand the relationship between capacity and spending in both sectors. Regardless, mechanisms to coordinate care and extract inefficiencies across the continuum offer the greatest promise at curbing overall growth.
The Affordable Care Act and Effects on Spending
The Affordable Care Act includes a number of reforms that have transformed the health care system and decreased overall spending. Enhanced access to coverage, consumer protections, and payment reforms provide important direct and indirect economic benefits to millions of Americans and also extend the life of the Medicare Trust Fund by at least eight additional years. Increased coverage in the form of Medicaid expansions and Health Insurance Marketplaces translates to improvements in the labor market with more people working, working productively, and less job lock from those who fear losing access to health insurance when switching jobs. As a result of restrictions to the amount of money spent on administrative costs or marketing, Americans have received rebates totaling 1.1 billion dollars from insurers over the past two years.[11] With respect to payment reform and other changes to the delivery of care, I will highlight several provisions that have already demonstrated cost savings or offer great promise for continuing to curb cost growth in the Medicare program. In addition to direct consequences to the Medicare Trust Fund, programs and policies in the ACA have also had a significant effect within the private sector, which has partly contributed to the reduction in overall national health expenditures through care transformation.
Accountable Care Organizations
The Accountable Care Organization (ACO) model is an example of a delivery system reform that fosters greater coordination of care while concurrently aligning financial incentives to encourage organizations to deliver more efficient care. The Centers for Medicare & Medicaid services (CMS) recently reported that organizations participating in the Pioneer ACO program achieved lower cost growth (0.3 percent) for their 669,000 beneficiaries than the growth observed (0.8 percent) for similar beneficiaries in the fee-for-service model during the same period. Of the 32 Pioneers, 13 Pioneers with significant savings generated gross savings of 87.6 million dollars in 2012. Of those gross savings, Medicare netted nearly 33 million dollars as the Trust Fund share of the ACO savings. Reduced hospital admissions and readmissions were reportedly principal drivers of overall cost savings.[12]
Additionally, private sector accountable care contracts are becoming more commonplace, with some demonstrating early results through a shift from volume-based payment to a value-based financing mechanism.[13] Private sector ACO efforts are noteworthy for their direct engagement with providers to redesign workflows and impact care coordination at a population level. A joint partnership between United HealthCare and Tucson Medical Center (TMC) centered on accountable care has led to more investments in ways to test care coordination tools. As a result of ACO efforts, TMC and its affiliated physician groups created a management services organization (MSO) as a business entity to develop and test ACO-specific clinical and administrative tools. The MSO then engaged Optum—a subsidiary of United HealthCare—to contribute clinical, administrative, and technical support to the enterprise.[14]
Bundled Payments
In order to achieve meaningful savings in the inpatient setting, the Center for Medicare & Medicaid Innovation (CMMI) has introduced bundled payments[15] as a model for hospital payment and delivery reform. A bundled payment is a fixed payment for a comprehensive set of hospital and/or post-acute services, including services associated with readmissions. Moving from individual payments for different services to a bundled payment for a set of services across providers and care settings encourages integration and coordination of care that will raise care quality and reduce readmissions. Variants on bundled payments are being demonstrated and differ in the scope of services included in the bundle and whether payment is retrospective—based on shared Medicare savings—or prospective, which intensifies the financial risk and return to investing in changes to the efficiency and quality of care. Currently, 467 health care organizations across 46 states are engaged in the bundled payment initiative.
Readmissions and Transitions in Care
According to CMS, one in five Medicare beneficiaries discharged from a hospital is readmitted within 30 days. Annually, that amounts to 2.6 million seniors and a cost of more than 26 billion dollars.[16] It is likely that multiple factors along the care continuum, from discharge inefficiencies to post-acute care issues, affect readmission rates. The Affordable Care Act includes two major efforts to improve coordination and reduce the costly inefficiencies of care. October 1, 2012 marked the beginning of the Hospital Readmissions Reduction Program (HRRP), an effort to reduce the frequency of re-hospitalization of Medicare patients. The program consists primarily of financial penalties levied against hospitals with readmission rates that are deemed to be excessive in several clinical areas such as congestive heart failure and pneumonia. According to CMS, approximately two thirds of U.S. hospitals will receive penalties consisting of up to 1 percent of their reimbursement for Medicare patients. These penalties will increase to 3 percent by 2015. CMS expects to recoup 280 million dollars from the 2217 hospitals penalized in 2013 alone.
Another effort at curbing the cost of care incurred by inefficient transitions is the CMMI Community-based Care Transitions Program (CCTP)[17], which addresses the transition from the inpatient hospital setting to the post-acute care setting. The CCTP initiative is important because it is not a demonstration project or pilot, but instead reflects a change in payment. The 112 participating organizations are paid an all-inclusive care management fee per eligible discharge that is based on the cost of providing care to the patient and implementing the systemic reforms at the hospital level.
While these and many other provisions within the Affordable Care Act offer an important foundation for reducing overall spending in healthcare, additional opportunities exist to go further toward bending the cost curve. As we identify in Table 3, it is important to look at the continuum of care and apply appropriate reforms that can have an impact within each sector. A combination of financing reforms that move us away from fee-for-service, delivery reforms that improve coordination in the inpatient and outpatient setting, and structural reforms that can lower the purchasing price for the goods and supplies of health care offer significant opportunities for savings.
These opportunities are neither partisan nor do they involve a radical redefinition of the Medicare benefit package. Rather, they build on lessons from the introduction of Medicare, the advent of capitation and managed care, physician hospital organizations (PHOs), state-based reforms, the implementation of the Medicare Part D program, and the aforementioned initiatives in the Affordable Care Act.
Opportunities for Savings
Within and across the continuum of care, there exist savings opportunities which can promote value, reduce cost and engage patients. These reforms will not only protect our nation’s long-term fiscal growth but will also improve the quality of care delivered to our patients. An important caveat is that although savings opportunities are presented by sector, it would be a mistake to assume that policies affecting each sector do not have a significant interaction effect with each other; in other words, policies affecting inpatient readmissions will affect outpatient care, post-acute care, etc. In fact, some of the strongest drivers of sector utilization are often the result of policies affecting other sectors.
Ambulatory Care Savings
The principal opportunity in the outpatient or ambulatory sector is the shift in physician payment from a volume-based fee-for-service system to one that would allow for better care coordination and shared financial risk outside traditional medical borders. While the cost of repealing the Sustainable Growth Rate is not insignificant, it reflects an opportunity for policymakers to place an investment in shifting care from the current siloed state to one that will help to enhance the important investments in coordination of care, such as patient-centered medical homes and accountable care organizations. Our work under the Merkin Initiative on Payment Reform and Clinical Leadership and additional efforts at Brookings have identified opportunities for such savings within physician payments[18],[19]. First, a set of services currently reimbursed for a particular episode of care or part of chronic care management are bundled together into a single payment to physicians as a case management payment. For example, in clinical oncology, a case management payment would include after hours phone care for breast cancer or a palliative care counselor for patients with lung cancer. This enables clinicians to focus less on volume and more on tighter coordination among providers and settings for patients. In addition, a proportion of FFS payments would become a fixed care coordination payment paid to physicians, which is built on concepts such as quality improvement and could qualify physicians to meet requirements for the Physician Quality Reporting System and Meaningful Use. These fixed care coordination payments allow flexibility for physicians to invest in clinical practice transformations that maximize their ability to treat patients in clinically appropriate ways while not reducing their income due to the reductions in billable procedures that would otherwise occur.
The Accountable Care Organization model should also be modified to allow for primary care physicians and specialists to work together and care for a population of patients with chronic diseases in a differentiated manner; after all, one size does not fit all when it comes to care and there is certainly no exception to the ACO. The rule of attribution should be modified to allow for providers of all types (including mental health and behavioral health specialists) to work together to care for patients with chronic disease; members of this committee have also echoed this recommendation. [20] Additionally, financial benchmarks must also point towards a longitudinal budget, especially if we replace fee-for-service payments in Medicare. Currently, ACOs are financially assessed year-to-year despite the longer time trajectory that some savings efforts might take (enhanced prevention efforts, etc). Assessment at a longer interval as well as the ability to potentially benefit from first dollar savings (as opposed to savings accrued after a certain threshold) could strengthen overall impact and add even more savings back to the Medicare Trust Fund. Finally, as long as Medicare beneficiaries enjoy the ability to see any provider of their choosing, we must seek methods to actively engage patients to understand the promise of PCMHs, ACOs and all of the other acronyms/nomenclature placed upon them. By doing so, we can ensure that beneficiary choice is protected while also allowing ACOs and other risk-bearing entities to have more certainty with regard to their patient populations. As illustrated in Table 3, experts have estimated that additional enhancements to the ACO model beyond what I have described could accrue billions of dollars in savings.
Inpatient Savings
There is no question that given the proportion of expenditures in the inpatient/hospital setting, any opportunity to increase efficiencies and garner savings should be explored. The aforementioned experience with readmissions penalties can be built upon further. Currently the penalties apply to acute myocardial infarction, pneumonia, and heart failure. Expansion to a wider number of conditions will have a multiplicative impact on budgets as well as patient care. Thus far, we have seen significant investments in improved information flows at time of admission and discharge as well as increased vigilance to factors which drive readmissions—adherence to medications, poor follow-up after discharge, and lack of coordination between providers. In a similar vein, the bundled payment efforts hold great promise, but much like the Accountable Care Organization initiatives, will likely need modifications and flexibility in order to achieve full potential. Finally, a driver in the growth of hospital-based outpatient care has been the differential site of service payment within Medicare. Medicare payments for evaluation and management (E&M) were 80 percent higher in outpatient hospital settings than physician offices for same services. For example, Medicare pays $450 for an echocardiogram done in a hospital and only $180 for the same procedure in a physician’s office. As noted by the National Commission on Physician Payment Reform, this trend has only exacerbated cost growth and increased income differential between primary care and other specialties.[21],[22] Meaningful reforms must eliminate this differential and focus on how best to align financial incentives with the quality of care provided to patients. The site of care should take into account clinician judgment and patient preference and not the associated reimbursement.
Post-Acute Care
The term “post-acute care” is often a disservice to this extremely diverse and important sector. While the care is often delivered after an episode in the hospital (hence the label), it can take place in a variety of ways and in a variety of settings, everything from home health to hospice. Given the changing demographics of our population, care delivered in settings such as skilled nursing facilities or in the home will be a more common occurrence. As noted earlier, the proportion of post-acute care expenditures in Medicare is growing and care transformation in these settings will require the same degree of coordination, if not more. The expansion of payment bundles in Medicare to include more post-acute organizations as well as longer episodes can result in billions of dollars in savings and also ameliorate the vast cost differentials in this sector. A recent IOM study points to a great deal of variation in the post-acute setting, which supports payment reform in this sector as well.[23] Another area that deserves more attention is hospice care. Half of Medicare’s expenditures in hospice were for beneficiaries whose length of stay was over 180 days.[24] At the other end, for many beneficiaries, admission into hospice is often too late—each situation is untenable, highlighting the need for meaningful payment reforms that are at least budget neutral and can allow for appropriate care to beneficiaries during an almost universally difficult time for patients and their loved ones.
Additional Savings in Pharmaceuticals, Supplies and Administrative Simplification
As highlighted in Table 3 there are additional opportunities to further simplify our already lean Medicare administrative costs and thus hopefully have an effect on the private sector as well. Such reforms include standardization of claims forms, processing actions and electronic transactions (which becomes easier now that over half of providers are meaningful users of electronic health records). In keeping with the theme of building on current initiatives within Medicare, extension of competitive bidding beyond durable medical equipment for other supplies offers potential savings along with demonstrating the importance of providing CMS with flexible authorities and resources to implement a competitive program that will accrue savings to the Trust Fund and beneficiaries. Finally, many expert bodies and analysts have discussed the role of pharmaceuticals and savings within—everything from price negotiations to low-income subsidies. Two common themes have emerged: savings from the payment for physician-administered drugs such as oncolytics or immunologic drugs, and savings from reducing brand-name drug usage. While I illustrate the potential savings by decreasing the Average Sales Price (ASP) adjustment from ASP+6 to ASP+3, it is critical that the Committee pair this with a concomitant reform to physician payments and eliminate the fee-for-service payments that usually accompany the administration of such pharmaceuticals in the Part B Medicare program. Encouragement of therapeutic substitution also offers promise. Researchers recently estimated that up to 1.4 billion dollars would have been saved in 2008 alone if generic drug usage in the Medicare population were equivalent to that of the Veterans Affairs System.[25]
While I illustrated opportunities for savings in the Medicare program, there are a number of similar and related reforms that should be implemented in the Medicaid program and given the projected growth in Medicaid enrollment over the next decade, the Committee should also consider how best to align such opportunities. Our nation’s economic prosperity will be intrinsically linked to our ability to benefit from alignment of Medicare and Medicaid while learning from the true pioneers in these areas- states such as Oregon, Washington, Colorado and New York are leading the way in identifying patient-centered efforts to improve delivery to our nation’s poor and elderly.
TABLE 3: Summary of Savings Opportunities by Sector
|
Sector |
Savings Opportunity |
Potential Economic Impact |
|
Ambulatory Care |
Payment models that minimize fee-for-service care:
|
Repeal of the Sustainable Growth Rate (SGR) will cost approximately 139.1 billion dollars[26] |
|
Extending the ACO Model[27]
|
Experts have projected possible savings of up to 192 billion dollars from 2014-2023[28] through replacement of physician fee cuts with an inflation-based adjustment and increased financial risk/accountability. |
|
|
Inpatient Care |
Extension of hospital readmissions penalties for a broader number of conditions |
While it is not clear exactly how much money would be saved, it is clear that the current program has generated significant savings (280 million dollars in 2013 alone), thus expansion would have a strong budgetary impact |
|
Elimination of site of service differential payments in Medicare for same services performed in hospital-based settings vs office-based settings. |
In 2011, Medicare and beneficiaries paid 1.5 billion dollars more for E&M and echocardiograms alone than they would have if payments had been equal across sites of care[29] |
|
|
Expansion of bundled payments to include more conditions and involve more care settings |
Bundles will likely drive down unit costs of care (cost per bundle), however it is unclear if it will have a significant shift on the volume of overall care |
|
|
Post Acute Care |
Expansion of payment bundles for post-acute care
|
Potential for an estimated 8.2 billion dollars in savings from 2014-2023[30] with reforms in the post acute sector |
|
Payment reforms within hospice
|
MEDPAC estimates that such reforms would be budget neutral the first year |
|
|
Supplies |
Refine and expand competitive bidding to other types of equipment beyond durable medical equipment (DME)[31] |
Pilot program in DME competitive bidding saved Medicare 202 million dollars in year one[32] |
|
Administrative |
Administrative simplification[35]
|
Institute of Medicine estimates savings of 181 billion dollars[36] |
|
Prescription Drugs |
Modify payment for physician-administered medications[37]
|
Savings of approximately 20 billion dollars from 2014-2023[38] |
|
Encourage therapeutic substitution where clinically appropriate |
Savings in 2008 alone would have been 1.4 billion dollars[39] |
Looking Ahead
Just as there are significant opportunities to deal with the challenging cost conundrum in healthcare, there are additional areas which could hold great promise. Notwithstanding, it is not entirely clear how best to enact these policies at the federal level and what effect they might have on the federal budget. One such area is transparency.
As noted in previous hearings hosted by this Committee, there is a great deal of interest in transparency initiatives and efforts to ensure that beneficiaries have the best ability to be a consumer of health care services. A basic psychological premise of consumerism is centered on the notion that information is power. The converse of this premise has been poignantly illustrated by recent analyses and commentary[40],[41] that have revealed that most patients and their physicians have little to no understanding of the true cost of care or pricing, often resulting in poorly informed decision-making. It is clear that as consumers face increased out of pocket spending and continue to bear more financial responsibility, there is a need for a systematic approach to increase transparency and then deal with the consequences of such transparency. Several solutions have been proposed for improving the transparency of pricing:
- Anti-trust litigation to reduce the market power of certain insurance companies and providers to drive up prices and obscure them from consumers[42]
- Incentivizing price transparency through legislation and regulatory action[43]
- Market solutions such as making transparent and releasing data on quality and prices of providers to employers would enable them to demand lower-cost and higher quality health plans, hospitals and providers[44]
These solutions are important to consider, but it is unclear what impact these reforms might have on the overall cost of care. Nevertheless, action is warranted—an initial important step would be to continue to expand ongoing efforts around transparency such as the CMS Hospital and Physician Compare Initiative. Additionally, as federally supported and facilitated health insurance marketplaces are implemented nationwide, we should have a better understanding of how transparency affects choice, price, and utilization and what lessons those hold for the Medicare and Medicaid programs. If information is power, we must make sure that patients have as much of it as possible, but simply making the information publicly available will likely not be enough.
In conclusion, as Congress recesses for the month of August, you will each hear directly from the most important witnesses to the ongoing cost challenges—patients. You will likely hear stories that highlight concerns over growing out of pocket costs, information asymmetry, and the sheer complexity of American healthcare. You will also hear stories of dedicated doctors, nurses, and health professionals who work to make sure that every patient receives the best care possible. You have the unique ability to translate these stories into policies that can build upon what is working and modify or eliminate anything that is not adding value to our care. By doing so, we will continue to slow cost growth and encourage greater economic security for our nation.
Thank you for this opportunity and I look forward to your questions.
[1] Frist W, Schroeder S, et al. Report of The National Commission on Physician Payment Reform. The National Commission on Physician Payment Reform. http://physicianpaymentcommission.org/wp-content/uploads/2013/03/physician_payment_report.pdf. Accessed July 24, 2013.
[2] Centers for Medicare & Medicaid Services, Office of the Actuary, National Health Statistics Group, Historic National Health Expenditure Data. http://www.cms.gov/Research-Statistics-Data-and-Systems/Statistics-Trends-and-Reports/NationalHealthExpendData/Downloads/tables.pdf. Accessed July 24, 2013.
[3] Institute of Medicine, The Healthcare Imperative: Lowering Costs and Improving Outcomes: Workshop Series Summary. http://www.iom.edu/Reports/2011/~/media/Files/widget/VSRT/healthcare-waste.swf. Accessed July 24, 2013.
[4] Centers for Medicare & Medicaid Services, Office of the Actuary, National Health Statistics Group, Historic National Health Expenditure Data. http://www.cms.gov/Research-Statistics-Data-and-Systems/Statistics-Trends-and-Reports/NationalHealthExpendData/Downloads/tables.pdf. Accessed July 24, 2013.
[5] Hartman M, et al. National Health Spending in 2011: Overall growth remains low, but some payers and services show signs of acceleration. Health Affairs, 2013; 32: 87–99.
[6] Centers for Medicare & Medicaid Services, Office of the Actuary, National Health Statistics Group, Historic National Health Expenditure Data. http://www.cms.gov/Research-Statistics-Data-and-Systems/Statistics-Trends-and-Reports/NationalHealthExpendData/Downloads/tables.pdf. Accessed July 24, 2013.
[7] Ibid.
[8] Congressional Budget Office. How Have CBO’s Projections of Spending for Medicare and Medicaid Changed Since the August 2012 Baseline? February 21, 2013. http://www.cbo.gov/publication/43947
[9] Centers for Medicare & Medicaid Services, Office of the Actuary, National Health Statistics Group, Historic National Health Expenditure Data. http://www.cms.gov/Research-Statistics-Data-and-Systems/Statistics-Trends-and-Reports/NationalHealthExpendData/Downloads/tables.pdf. Accessed July 24, 2013.
[10] Centers for Medicare & Medicaid Services, Office of the Actuary, National Health Statistics Group, Historic National Health Expenditure Data. http://www.cms.gov/Research-Statistics-Data-and-Systems/Statistics-Trends-and-Reports/NationalHealthExpendData/Downloads/tables.pdf. Accessed July 24, 2013.
[11] U.S. Department of Health and Human Services. Health care law saved an estimated $2.1 billion for consumers. http://www.hhs.gov/news/press/2012pres/09/20120911a.html, Published September 2012. Accessed July 26, 2013.
[12] Patel K and Lieberman S. Taking stock of initial year one results for Pioneer ACOs. Health Affairs Blog. http://healthaffairs.org/blog/2013/07/25/taking-stock-of-initial-year-one-results-for-pioneer-acos/. Published July 25, 2013. Accessed July 26, 2013.
[13]Markovich P. A Global Budget Pilot Project Among Provider Partners And Blue Shield of California Led to Savings in First Two Years. Health Affairs. September 2012; 31(9): 1969-1976. http://content.healthaffairs.org/content/31/9/1969.abstract. Accessed July 23, 2013.
[14]Carluzzo K, Larson B, Van Citters A, et al. Tucson Medical Center: A Community Hospital Aligning Stakeholders for Accountable Care. The Commonwealth Fund. http://www.commonwealthfund.org/~/media/Files/Publications/Case%20Study/2012/Jan/1575_Carluzzo_Tucson_case%20study_01_12_2012.pdf. Published January 2012. Accessed July 23, 2013.
[15] Centers for Medicare & Medicaid Services. Bundled Payments for Care Improvement Initiative. http://innovation.cms.gov/initiatives/bundled-payments/
[16] Centers for Medicare and Medicaid Services. Community-based Care Transitions Program.
[17] Ibid.
[18] Statement of Kavita K. Patel on Physician Payment Reform Before the Senate
Finance Committee. 14 May 2013. Full transcript available at: http://www.finance.senate.gov/imo/media/doc/Kavita%20K%20Patel%20Senate%20Finance%20Testimony%20FINAL.pdf
[19] Bending the Curve: Person-centered Health Care Reform: A Framework for Improving Care and Slowing Health Care Cost Growth. The Brookings Institution. April 2013. https://www.brookings.edu/~/media/research/files/reports/2013/04/person%20centered%20health%20care%20reform/person_centered_health_care_reform.pdf
[20] http://www.wyden.senate.gov/news/blog/post/wyden-outlines-major-medicare-reforms-at-aco-summit
[21] MedPAC. Report to the Congress: Medicare Payment Policy. March 2013. Page 48-49.
[22] Frist W, Schroeder S, et al. Report of The National Commission on Physician Payment Reform. The National Commission on Physician Payment Reform. http://physicianpaymentcommission.org/wp-content/uploads/2013/03/physician_payment_report.pdf.
[23] Institute of Medicine. Variation in Health Care Spending: Target Decision Making, Not Geography. http://www.iom.edu/~/media/Files/Report%20Files/2013/Geographic-Variation2/geovariation_rb.pdf
Accessed July 26, 2013
[24] Neuman K. and Sadownik S. MedPAC Presentation: Medicare Hospice Policy Issues. April 4, 2013. http://www.medpac.gov/transcripts/hospice_April_2013_presentation.pdf
[25] Gellad W.F., Donohue J.M., Zhao X., Mor M.K., Thorpe C.T., Smith J., Good C.B., Fine M.J., Morden N.E. Brand-Name Prescription Drug Use Among Veterans Affairs and Medicare Part D Patients With Diabetes: A National Cohort Comparison. Annals of Internal Medicine. 2013. http://annals.org/article.aspx?articleid=1696030
[26] Congressional Budget Office. The Budget and Economic Outlook: Fiscal Years 2013 to 2023. February 2013. Page 31.
[27] Lieberman SM.2013. Reforming Medicare through ‘Version 2.0’ of Accountable Care. Health Affairs: 32(7): 1258-1264.
[28] Ibid.
[29] MedPAC. Report to the Congress: Medicare Payment Policy. March 2013. Page 48-49
[30] Office of Management and Budget. The White House. Fiscal Year 2014 Budget of the U.S. Government. April 2013. Page 38, 197.
[31] Bipartisan Policy Center. A Bipartisan Rx for Patient-Centered Care and System-Wide Cost Containment. April 2013. Pages 60-61.
[32] Centers for Medicare & Medicaid Services. Press Release: Contract suppliers selected under Medicare competitive bidding program. April 9, 2013.
[33] Ibid.
[34] Ibid.
[35] Institute of Medicine, The Healthcare Imperative: Lowering Costs and Improving Outcomes: Workshop Series Summary. http://www.iom.edu/Reports/2011/~/media/Files/widget/VSRT/healthcare-waste.swf. Accessed July 24, 2013.
[36] Ibid.
[37] Office of Management and Budget. The White House. Fiscal Year 2014 Budget of the U.S. Government. April 2013. Page 41.
[38] Ibid.
[39] Gellad W.F., Donohue J.M., Zhao X., Mor M.K., Thorpe C.T., Smith J., Good C.B., Fine M.J., Morden N.E. Brand-Name Prescription Drug Use Among Veterans Affairs and Medicare Part D Patients With Diabetes: A National Cohort Comparison. Annals of Internal Medicine. 2013. http://annals.org/article.aspx?articleid=1696030
[40] Brill S. Bitter Pill: Why Medical Bills are Killing Us. Time. March 4, 2013.
[41] Reinhardt, U. The Culprit Behind High U.S. Health Care Prices. Economix Blog, New York Times. http://economix.blogs.nytimes.com/2013/06/07/the-culprit-behind-high-u-s-health-care-prices/?_r=0
Published June 7, 2013. Accessed July 26, 2013.
[42] Price Transparency in the Health Care Market. UCSF/UC Hastings Consortium on Law, Science, and Health Policy. March 18, 2013. http://ucsfconsortium.uchastings.edu/research/pricetransparency/pricetransparency_whitepaper
[43] Ibid.
[44] Ibid.

Commentary
TestimonyContaining Health Care Costs: Recent Progress and Remaining Challenges
July 30, 2013