
Previous analyses of Census Bureau estimates make plain that the nation’s population growth has ground down to a historic low: only 0.1% growth between July 2020 and July 2021. During this prime year of the COVID-19 pandemic, the number of deaths rose sharply, births declined, and immigration reached its lowest levels in decades. At the same time, population movement within the U.S. led to sharp declines in many of its largest metro areas—particularly in these areas’ biggest cities.
Now, newly released Census Bureau estimates allow us to examine these shifts via specific race-ethnic and age groups. Unlike the 2020 census data, these estimates permit analyses of annual population change.1
This report focuses on annual changes from July 2016 to July 2017 through July 2020 to July 2021. This period includes three years prior to the pandemic, one year with partial pandemic exposure (2019 to 2020), and one year with full pandemic exposure (2020 to 2021). This allows for an assessment of race-ethnic and age shifts before and during the pandemic.
This is also a significant period because, as a previous report shows, the nation’s white population began to decline in 2016.2 This initial white population loss occurred before the pandemic and is related to the aging of the white population, which has led to fewer births and more deaths—losses that are projected to continue. And as shown below, the pandemic has exacerbated this white population loss.
The examination of age shifts shows a loss of young people under age 18 and those in their prime working ages (18 through 59). Moreover, when looking at age and race, it becomes clear that nonwhite Americans, especially Latino or Hispanic Americans, comprise larger shares of the population at all ages.
This report also revisits earlier analyses of notable population declines in large metro areas and big cities. It shows that most of those declines are due to white population losses, both from the national white population decline as well as white population movement to smaller-sized places.
While these trends are exaggerated in the prime pandemic year, it is plain to see that the nation is facing a long-term transition toward greater diversity and aging, both nationally and across large swaths of the country.
White population losses contributed the most to the pandemic year growth slowdown
The nation’s population grew by a mere 392,665 during the prime pandemic period of July 2020 to July 2021—down from over 1 million in each of the three previous years, and over 2 million for 2016-17. Yet when looking at these trends for major race-ethnic groups, it was the increased loss in the white population (to -878,693) which accounted for most of the nation’s growth decline.

While it is true that each of the other race-ethnic groups grew more slowly in 2020-21 (download Table A), white population loss contributed most. Moreover, it continued a trend, now five years running, of white population loss across the nation as a whole.
When examining the prime demographic components of the nation’s growth slowdown (see Figure 2), it is clear the large negative natural increase (more deaths than births) is what propelled the white population loss in 2020-21. In the year before the pandemic (2018-19), white natural increase was -289,849. This dropped further in 2020-21, to -906,427, due to substantially more deaths and fewer births.

While each of the other race-ethnic groups registered positive natural increase levels in 2020-21, these levels were lower than those observed before the pandemic. (Download Table B.)
It is also the case that growth from international migration slowed down sharply during the prime pandemic year, though immigration restrictions had been leading to lower levels even before the pandemic. Overall, the sharp downturn in national growth was most due to a decline in natural increase stemming from a rise in deaths and decline in births within the white population.
Increased losses in the nation’s youth and working-age populations
The aging of the nation’s population is not a new phenomenon. The baby boomer generation’s transition into the older-age category has increased that category’s gains since 2010. This generational accession will continue for much of the next decade—decreasing the share of the nation’s prime working-age population. This aging of the population has also led to slower growth in the youth population, as women in their childbearing years make up smaller shares of the total population (particularly among white Americans).

 Thus, it is not surprising that even before the pandemic, there was an annual loss in both youth (under 18) and prime working-age (18 to 59) populations, as shown in Figure 1. However, in 2020-21, the magnitude of these losses increased, especially for youth, in light of the decline in births and slowdowns in the generally younger immigrant population. And while growing far more than others, the 60-and-older age group still showed a marked growth decline.
While all race-ethnic groups contributed to these pandemic year declines, the increased losses in white youths and lower gains for seniors contributed heavily to the national pattern. Particularly in 2020-21, fewer white births and fewer immigrants (as well as the continued accession of baby boomers into older ages) were most responsible for the loss of the nation’s youth and working-age populations.
It is noteworthy that in 2020-21, Latino or Hispanic, Asian American, Black, and Native American and Alaska Native youth populations registered losses—the first time ever for the first two groups. (Download Table A.)

Another measure of the aging of the U.S. population and its race-ethnic groups is median age. The new census estimates show the national median age increased from 37.2 in 2010 to 38.8 in 2020. The white population’s median age is the oldest, rising from 42.1 to 43.8 during that same period. All other race-ethnic groups have lower median ages, with the lowest being 20.9 for persons identifying as two or more races. While all of the latter groups are also aging, the fact that they are growing while the white population is declining suggests that they will help to moderate the overall aging of the U.S. in the future.
A more diverse nation at all ages
The new census estimates make plain two facts: 1) diversity is greater for the nation’s younger age groups than older age groups; and 2) the nation is becoming more diverse at all ages.
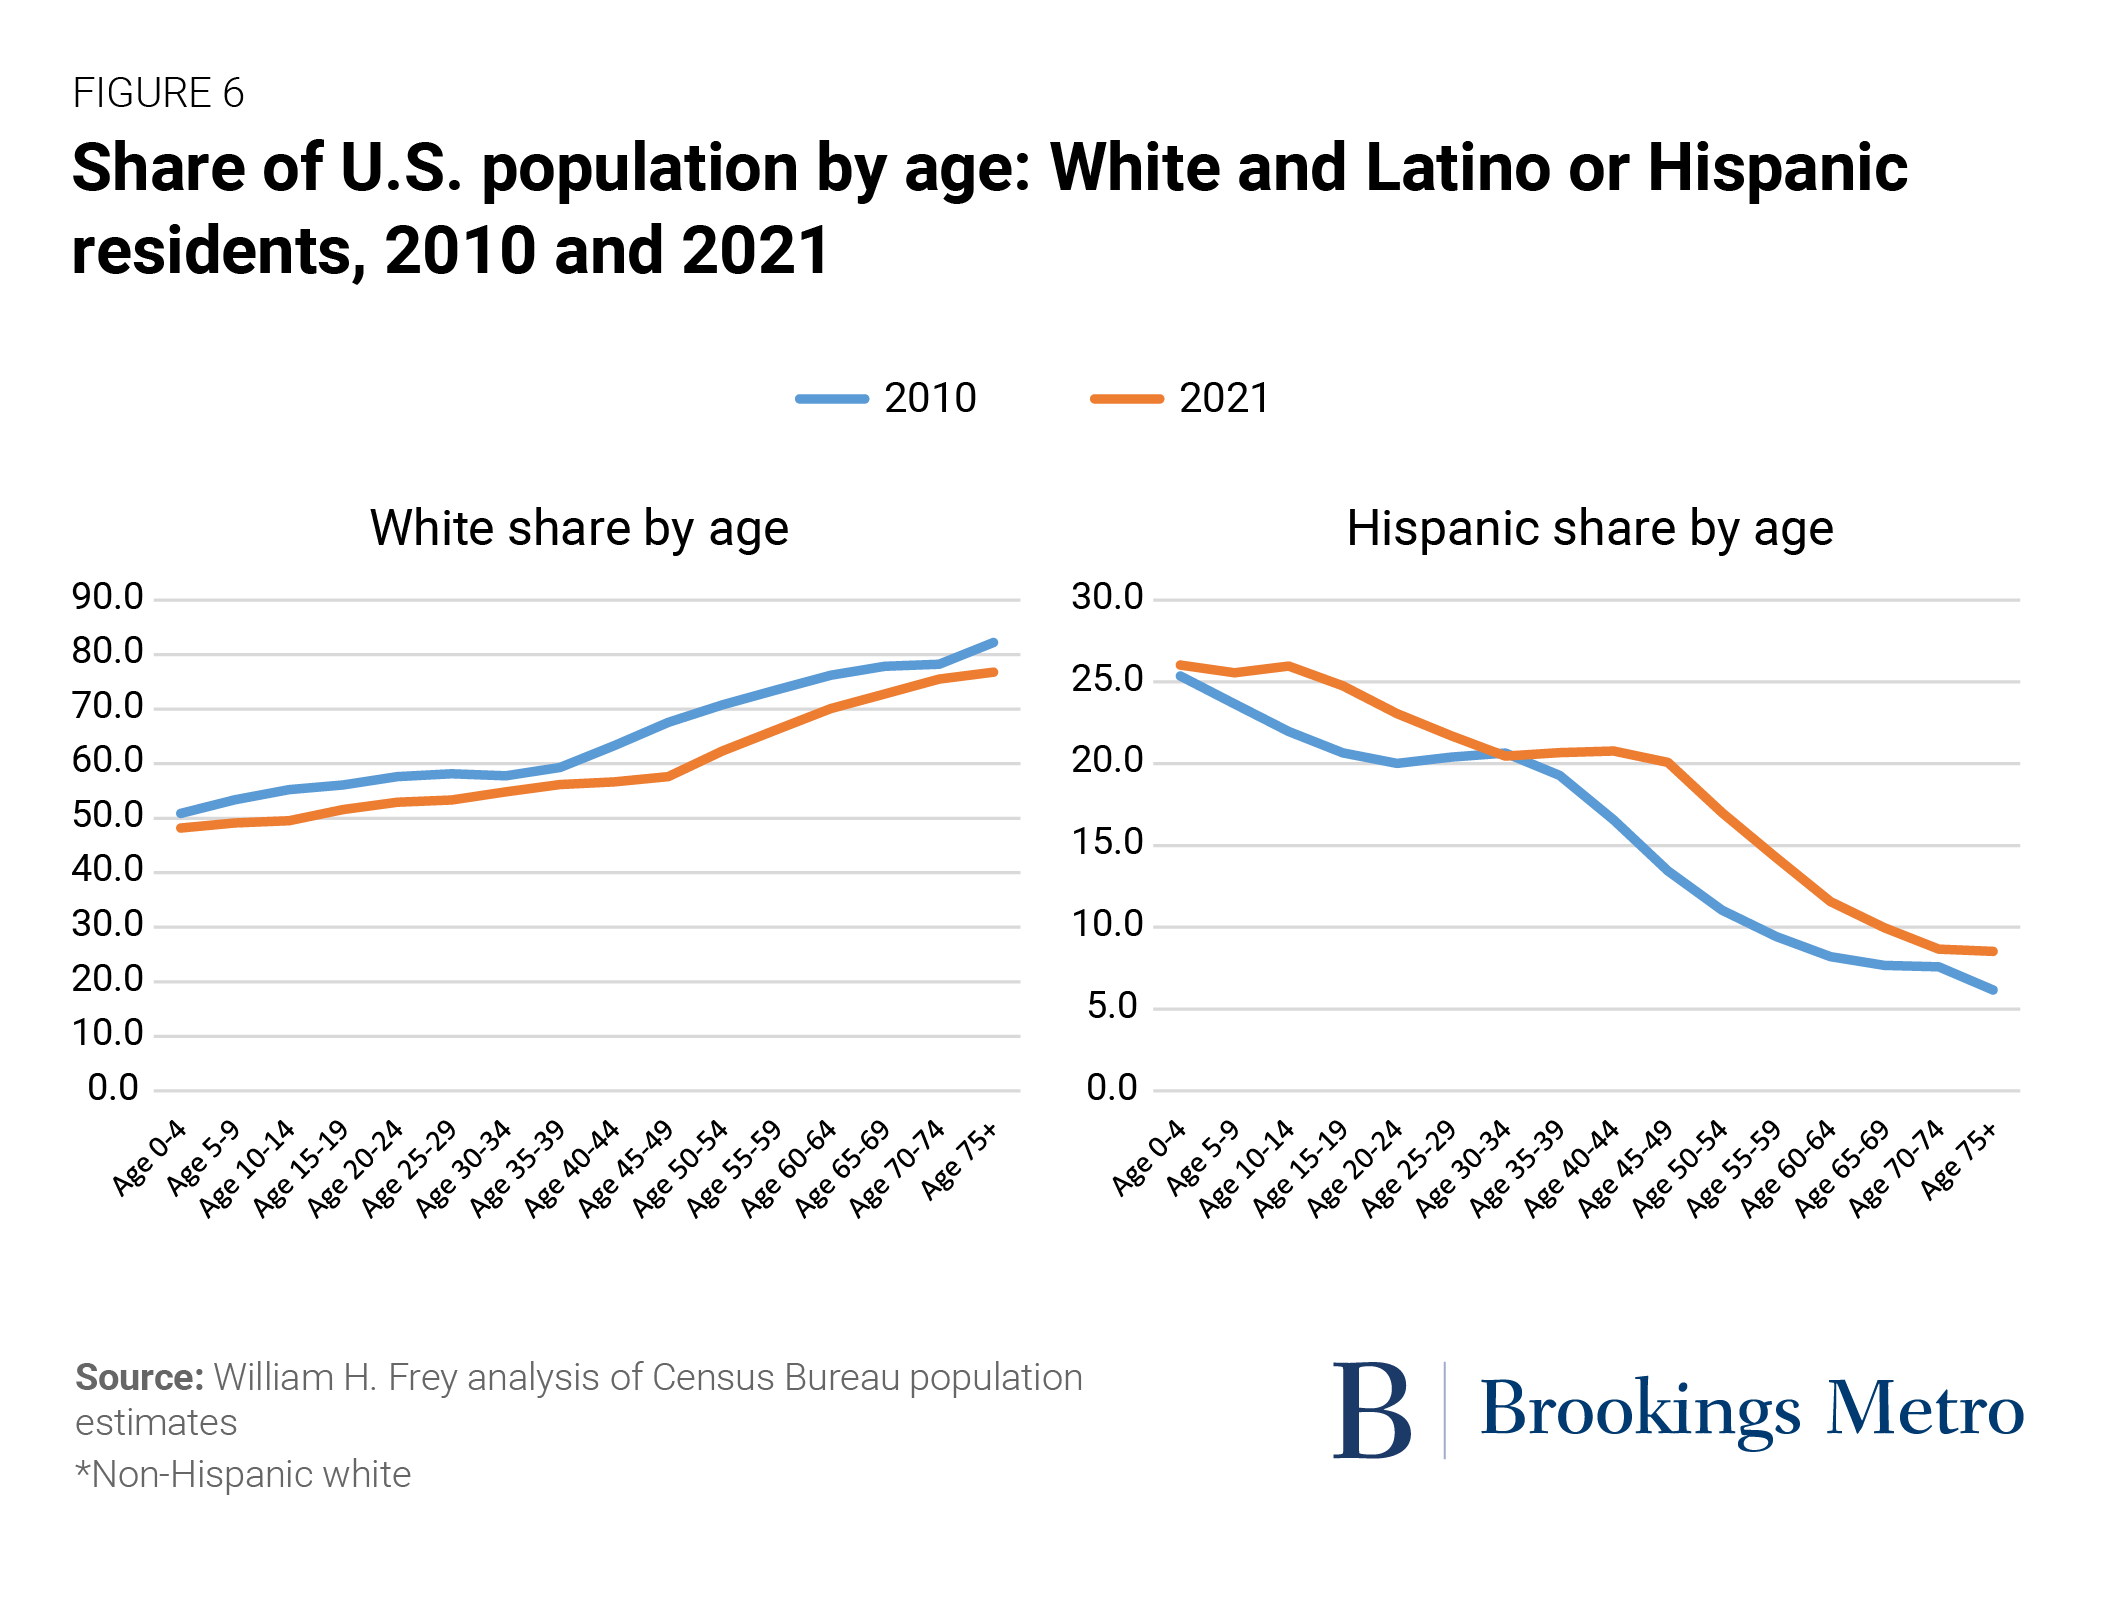
Both points can be seen in Figure 6, which compares diversity measures by age for 2010 and 2021 (download Table C). The left chart portrays the share of each age group’s population that identifies as white and not with any other race or ethnic group. In 2021, less than half of those under age five identified as white, compared with 76.8% among those 75 and older. In 2010, the respective white shares were 50.9% and 82.2%. At all ages, the 2021 white share of the population is less than the 2010 share. But the changes are biggest when comparing those who were born in the 1970s (ages 45 to 49 in 2021) with those born about a decade earlier (ages 45 to 49 in 2010)—reflecting the rise of more diverse babies during the early years of expanded immigration to the U.S. and the contributions of subsequent immigration waves.
These patterns are also reflected in the share of the population identifying as Latino or Hispanic in each age group in 2010 and 2021. While in both years, those in younger age groups are more likely to identify as Latino or Hispanic, the largest gaps in age identification occur in persons aged 45 and 60 in 2021 and those of the same age in 2010. The Latino or Hispanic rise in that generation is due to both more births and immigration, impacting the nation’s diversity in older age groups as well as youth.
White losses are greatest in major metro areas, big cities, and outside the South
The spike in national white population losses during the prime pandemic year raises the question of how this may have impacted overall geographic population shifts within the U.S. One of the impacts is the unusual decline in the aggregate populations of the nation’s major metro areas (the 56 metro areas with populations exceeding 1 million).
In the early part of the 2010s, urban areas experienced high growth, which receded mid-decade as the population dispersed to smaller areas. The loss in their combined populations for 2020-21 can be attributed to pandemic fears of living in highly dense areas, as well as opportunities elsewhere.

 The new Census Bureau estimates show that the white population contributed heavily to this loss. As Figure 7 indicates, the white population in these areas dropped by more than 900,000, well above the nearly 300,000 drop in the total population (with gains from other race-ethnic groups making up the difference). As Figure 8 shows, these other groups, especially Latino or Hispanic, Asian American, and Black populations, registered growth declines in these areas. But the biggest changes occurred because of white population losses.
Among the nation’s 56 major metro areas, 43 saw absolute declines in their white populations. Sixteen saw absolute declines in their Black populations, and six saw declines in Latino or Hispanic and Asian American populations (download Table D). The New York metro area sustained the largest white losses over 2020-21 (222,000), followed by Los Angeles (103,000), Chicago (82,000), San Francisco (80,000), and Boston, Seattle, Washington, D.C., and Philadelphia (all above 30,000). (Download Table E.) Most metro areas that either lost or gained white residents suffered greater losses or smaller gains in 2020-21 than in the previous year. This is the case for the metro areas that gained the most white residents: Phoenix and Austin, Texas, both of which still gained more white residents in pre-pandemic years.

Just as major metro areas lost population in 2020-21, so did these areas’ urban core counties. Using a typology developed by Brookings Metro, Figure 9 shows that the white population has contributed most to these losses as well.3 Among the 142 counties (both urban core and suburban) with populations exceeding 1 million, 120 registered white losses in 2020-21, with the majority showing greater losses than in the previous year. (Download Table E.)
The 2020-21 national white population loss has also impacted population changes across the 50 states and Washington, D.C. (download Table F). During this year, a recent record of 18 states lost population, and 33 states showed losses in their white populations, led by California, New York, Illinois, Pennsylvania, Massachusetts, New Jersey, and Ohio. Florida gained the highest number of white residents, helping the South to be the only region to gain white residents. Other southern states that gained white residents include South Carolina, Tennessee, North Carolina, and Texas. States that gained the most white residents in the West include Idaho, Utah, Arizona, and Nevada.
White losses during the pandemic year: A blip or emerging trend?
The observations above make clear that the peak pandemic year, 2020 to 2021, led to historically low levels of growth in the U.S. and across its major metro areas, cities, and states. The decline in the white population contributed most to these shifts, registering a record population loss nationwide as well as in major metro areas, large cities, and regions outside the South.
However, this was not the first year that people of color accounted for all of the growth in the U.S. population and much of its geography. That began in 2016, due to more deaths, fewer births, and lower immigration. These demographic components impacted all race-ethnic groups, but pandemic forces made the nation’s white losses even more pronounced (except the baby-boomer-infused senior population, which nonetheless showed a growth slowdown). It also appears that white urban residents, more than their counterparts in other racial groups, were more able or willing to leave urban areas during the pandemic.
It will no doubt be the case that the nation’s population growth will pick up post-pandemic. But for the white population, these shifts will only moderate current losses as that population ages. Fortunately for the nation’s future, the overall population is younger, with a diversity of communities contributing to growth. Among these are people who identify with the rapidly growing “two or more races” population, including those with at least one white parent. Thus, from a purely demographic standpoint, a return to fewer deaths, more births, and—most importantly—more immigrants should keep the nation on a solid track as growth picks up among its increasingly diverse population.
Author

-
Footnotes
- These estimates are produced by the Census Bureau’s population estimates program: evaluation estimates for years 2010 to 2020; and 2021 vintage estimates for the years 2020 and 2021.
- White and other racial groups discussed in this report pertain to non-Hispanic members of those groups. Latino or Hispanic persons are reported separately.
- Urban core areas are defined as counties with more than 95% of their population residing in urbanized areas, among counties within metropolitan areas with populations exceeding 500,000, based on a typology developed by Brookings Metro.
The Brookings Institution is committed to quality, independence, and impact.
We are supported by a diverse array of funders. In line with our values and policies, each Brookings publication represents the sole views of its author(s).


