
America’s road toward a “more perfect union” is paved in race relations. Yet in recent years, there have been many signposts of discrimination and unrest indicating that the country has a very long way to go.
In a first-of-its-kind analysis, this report uses newly available data from Gallup to show that measures of well-being offer a valuable way to chart our collective progress toward a diverse, thriving society.
High well-being scores are correlated with greater individual and community stability, high racial and ethnic diversity, and lower rates of so-called “deaths of despair,” making it a more holistic indicator of how people are faring than traditional, narrower measures such as income or educational attainment.
The data underscores that although levels of well-being in the United States remain high relative to other countries, they have declined recently, especially among young adults. Other key findings include:
- Between 2008 and 2023, well-being fluctuated for all racial and ethnicity groups, with noticeable declines for all in the aftermath of the Great Recession and the COVID-19 pandemic.
- Since 2020, all racial and ethnic groups experienced a sharp drop in well-being, with Asian Americans seeing the largest decline, which aligns with the rise in anti-Asian hate.
- The decline in well-being has been especially pronounced in young adults ages 18 to 24. Between 2008 and 2023, young adults in each racial and ethnic group experienced 20 percentage point or larger reductions in well-being.
- The sharp fall in well-being since 2016 and again after the pandemic has resulted in Black Americans dying from suicide and despair-related deaths at equal rates as white Americans. American Indians and other smaller racial groups continue to exhibit the highest rates of deaths of despair and the lowest rates of well-being.
The report closes by highlighting the metro areas where different racial and ethnic groups exhibit high levels of well-being, which can offer insights into community-level solutions that could lift well-being elsewhere. Place provides an opportunity to see how people in different locales reckon with their circumstances, and as incubators of diversity, cities are powerful facilitators of change in America. If city governments and civic organizations can understand well-being from the perspective of different racial identities, they can dismantle the architecture of inequality in their communities and beyond.
This work is part of the Brookings Institution’s new partnership with HUMANLEVEL, a nonprofit initiative founded by John Legend that aims to uplift communities disproportionately impacted by institutionalized racism. Our two organizations will work together to develop innovative policy research that seeks to disrupt and dismantle assumptions, institutions, and pre-existing public policies that prevent Black, brown, and other marginalized communities from thriving. As part of the partnership, this report and others will provide research and analysis for community leaders and policymakers to help elevate places and enrich the lives of people throughout our country
How we are faring as a country is inarguably linked to race relations and how various racial groups are thriving. When discussing race in America and worldwide, we need to consider well-being. The new analysis and data presented here lay the foundation for exploring what factors are most affecting Americans’ well-being as we begin to understand why racial groups diverge in happiness or suffering.
How do we define well-being, and why measure it?
The term “well-being” encompasses the social, economic, and political factors that shape our lives, with consideration to how individuals reckon with those factors. The New Economics Foundation provides a succinct definition: “Well-being can be understood as how people feel and how they function, both on a personal and a social level, and how they evaluate their lives as a whole.”
Since 2006, Gallup has been the leading source of global data on well-being. To measure it, Gallup asks people to rate where they are in their present life and where they expect to be in five years (future life) on a scale of zero to 10. Ten is the best possible life, and zero is the worst.1 A person is considered “thriving” if they score seven or above on current life evaluation and eight or above in future life. They are considered “suffering” if they are at or below four on both measures. Most respondents in the United States rate themselves around a seven on current life evaluation.
By combining Gallup’s well-being index data from 2008 to 2019 with Gallup Center on Black Voices data from 2020 to April 2023, we have constructed the longest continuous time series of life evaluation data by race and ethnicity ever published. Moreover, we matched respondents’ ZIP codes to metro areas, creating the most comprehensive metropolitan-level life evaluation database ever published.
There are three important reasons for measuring well-being and how it relates to race and place:
- Well-being adds relevance to the study of race relations because it offers a more complete picture of life. Much of the research around diversity, equity, and inclusion focuses on racial disparities, and while these analyses provide context for our political histories, they focus on what is wrong with people and mask evidence of how and where we are progressing. Understanding how and where people are thriving spotlights solutions that other communities can learn from. Consequently, the national discourse and the study of race relations can benefit from the emerging research on well-being.
- Improving the well-being of diverse racial identities is how we collectively advance. If we can identify where people are thriving, we can look for positive civic action, racial cooperation, and policy change that encourages further well-being. Understanding our connections at a human level helps us see our shared fate, ignite systemic change, and build racial equity across our cities and communities. People of different hues have gathered across families, tribes, and political units since long before recorded history. Ancestral, cultural, and other differences have led to real and substantive conflicts over resources, territory, and people. However, our differences have also led to compromises, cooperation, and assimilation, while shaping the foundation for democracy. Despite continued discrimination and significant racial differences in socioeconomic status and political influence, our differences offer an opportunity to ultimately advance civilization.
- Well-being is an effective predictor of social stability and security. High well-being scores are correlated with greater individual and community stability, as well as factors such as high racial and ethnic diversity. Roughly 15% of the variation in the percentage of thriving respondents can be explained by racial diversity.2 Well-being is also a much stronger predictor of deaths of despair than traditional measures such as low income or low educational attainment. In this way, it is a more holistic measure of progress than uni-dimensional metrics such as gross domestic product or income, which perform poorly at capturing inequality between and within groups. Instead, well-being focuses attention on our interactions and relationships with each other and the places we inhabit.
Recent trends in well-being in the US show fluctuations and declines
According to the Gallup World Poll, globally since 2006, one out of every four people (25%) have indicated they are “thriving” in well-being, while 13% have indicated they are “suffering.”3 Gallup’s research has found that the variation across countries is enormous and largely driven by material well-being. Still, physical health, mental health, the quality of relationships, the quality and meaning of work, and attachment to the community are also important.
In United States, which falls in the top 20 countries on well-being scores, 48% of respondents reported they were thriving in 2022—the lowest level since reporting began in 2006. Still, only 4% of U.S. respondents reported they are suffering, whereas in 29 countries, such as Afghanistan and Lebanon, the percentage of respondents suffering is higher than the percentage thriving.
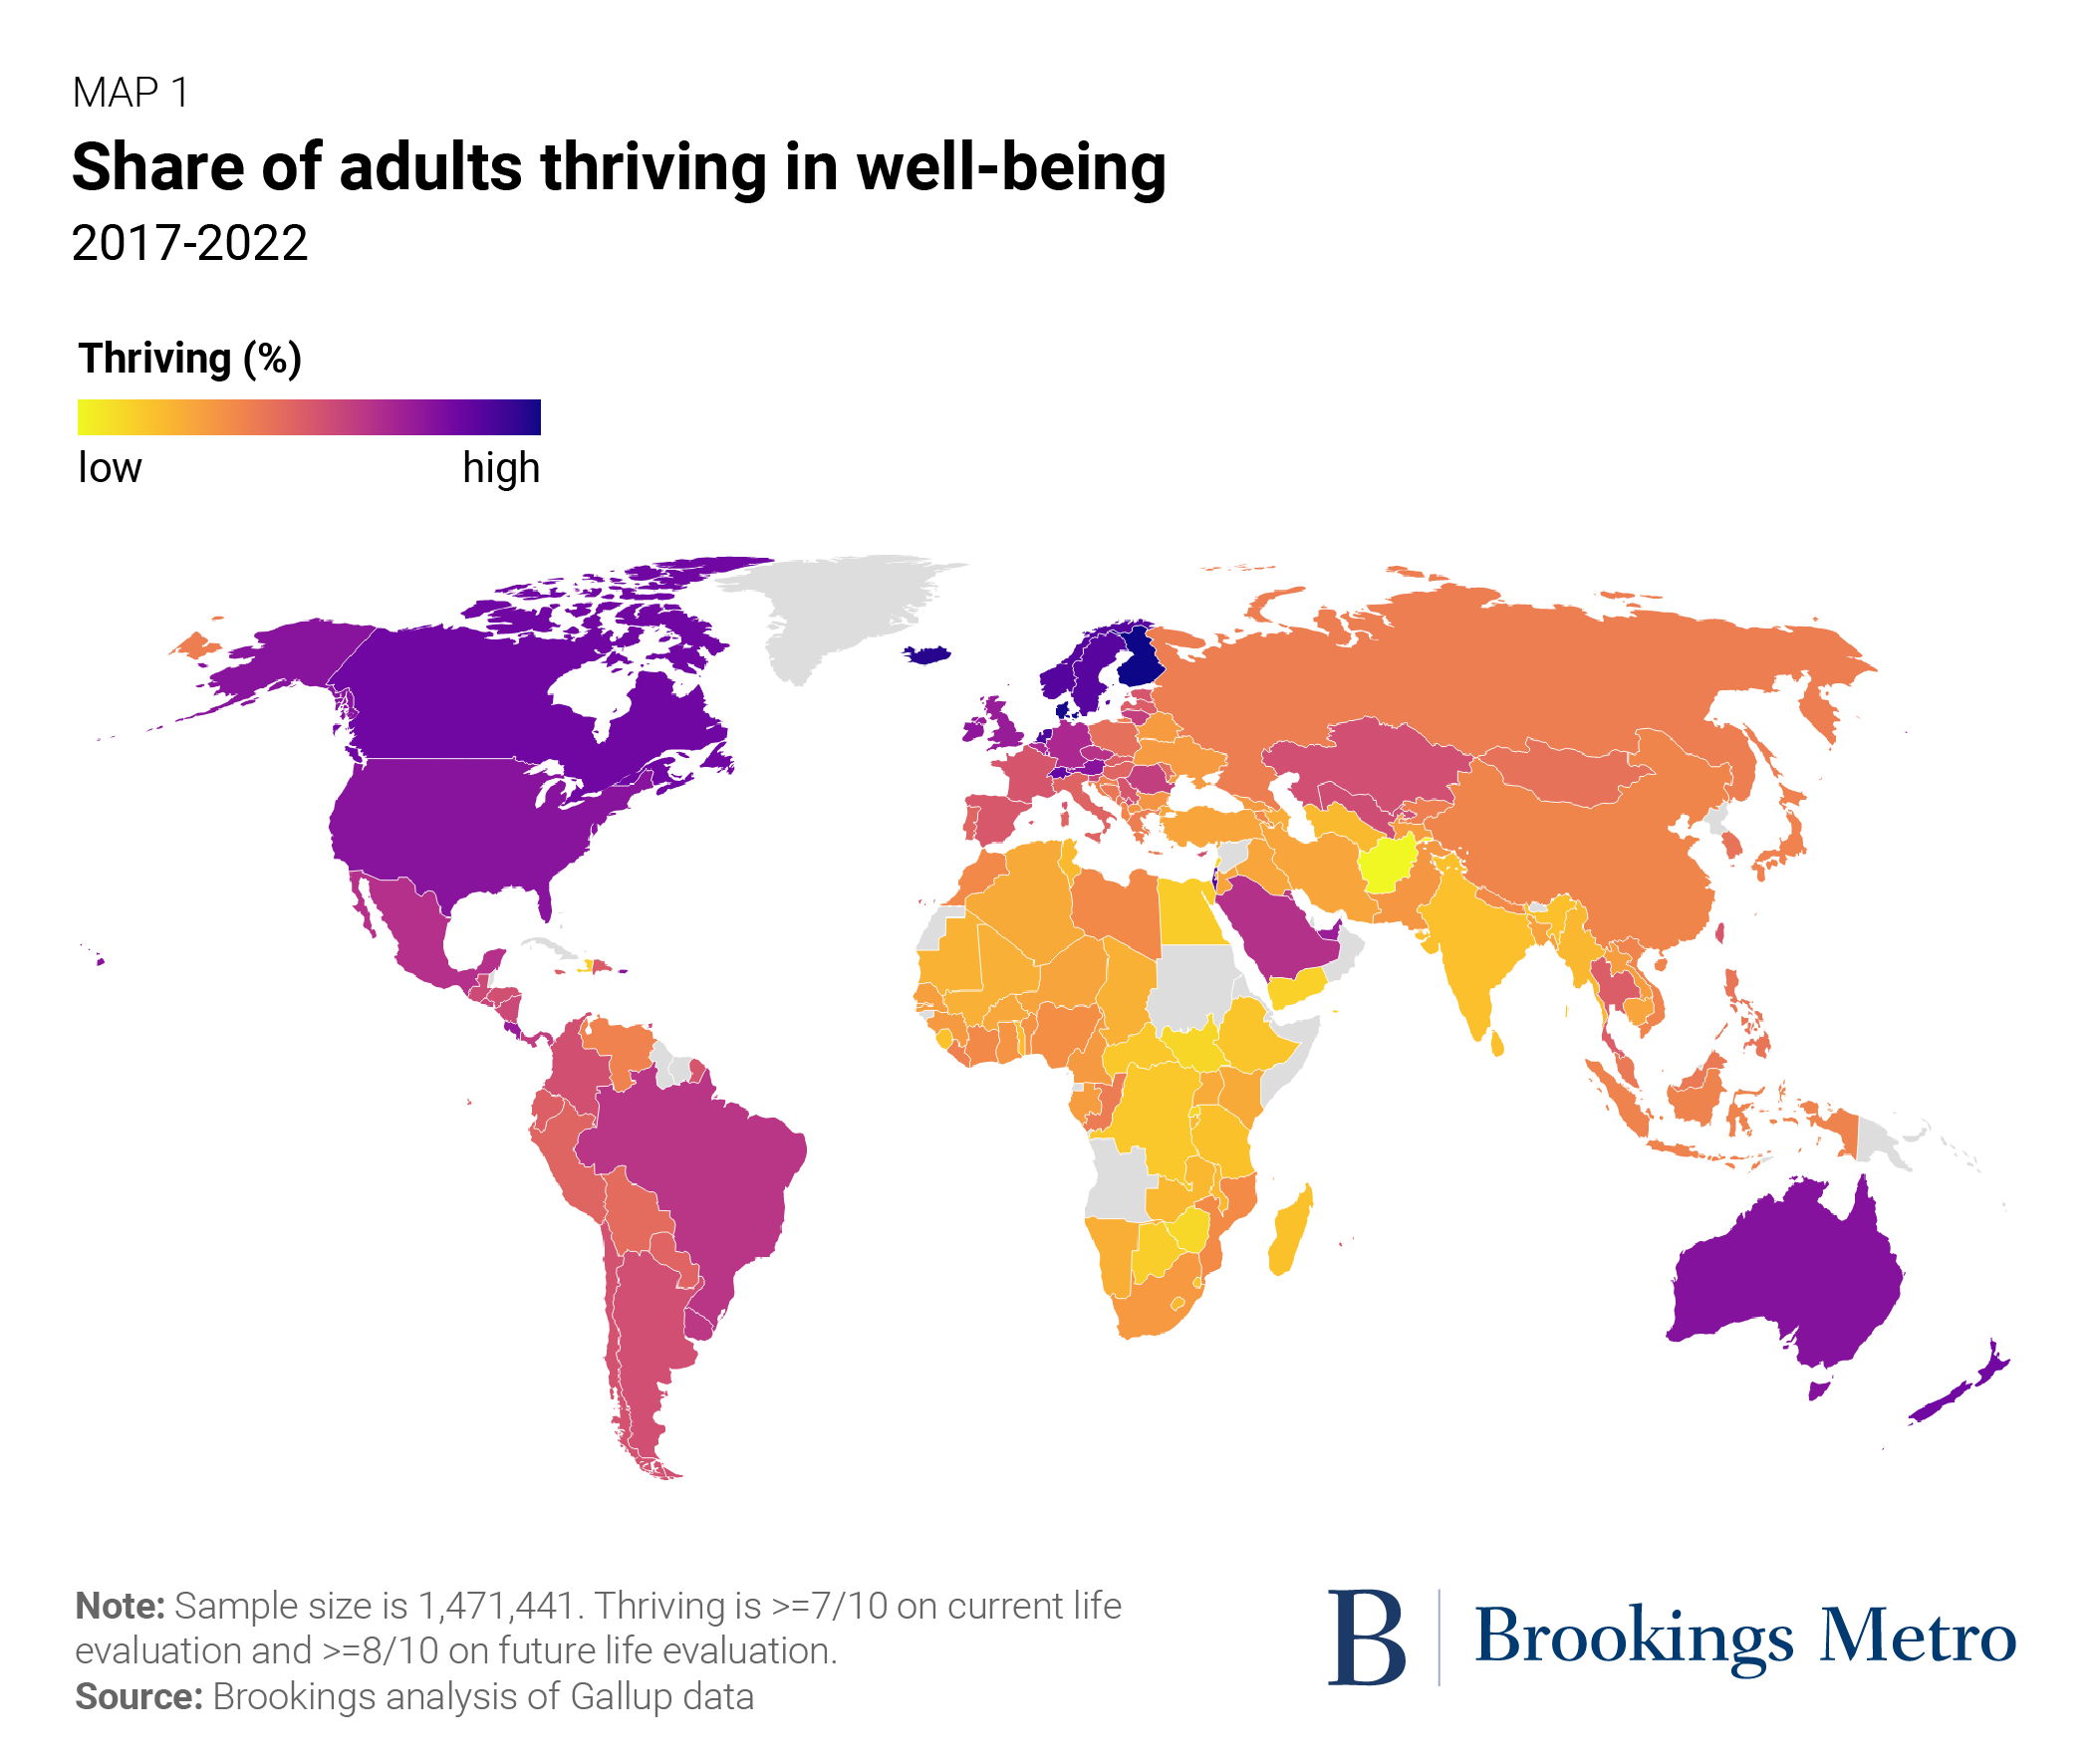
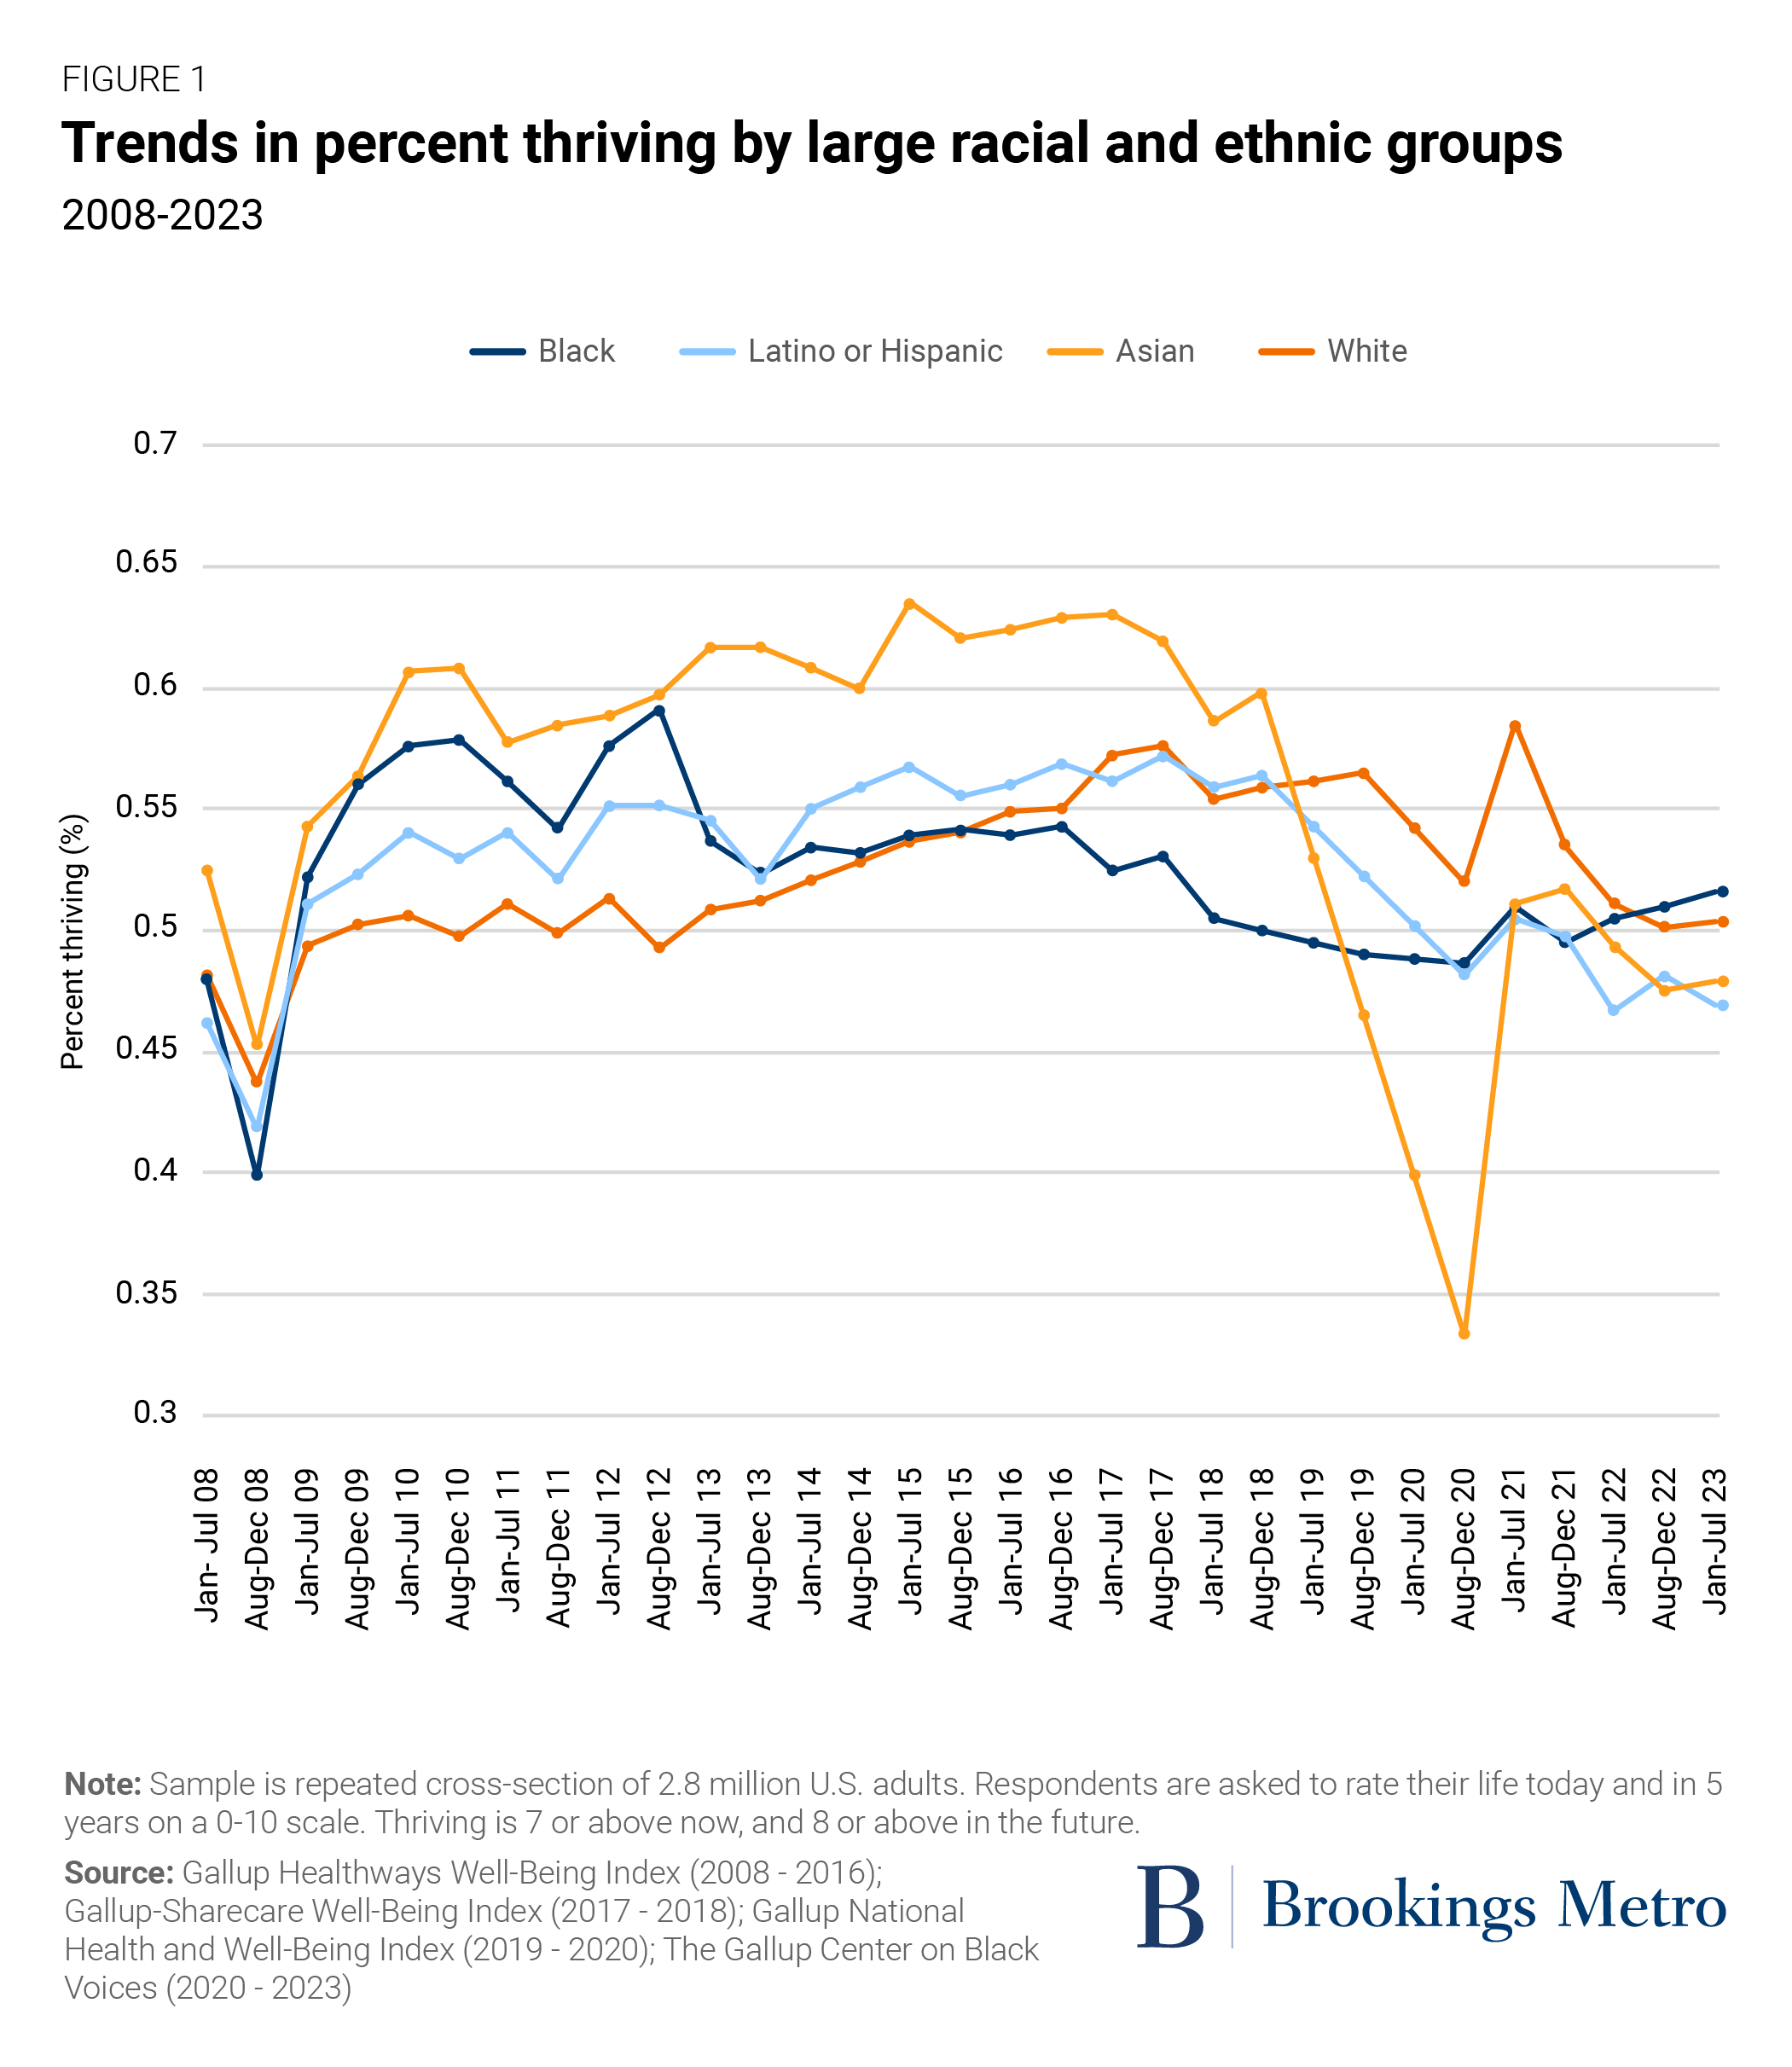
Figure 1 shows that between 2008 and 2023, well-being oscillated for all racial and ethnic groups in the U.S., with noticeable declines for all in the aftermath of the Great Recession and COVID-19 pandemic. And since at least 2019, well-being has declined among all groups, and we are yet to see a post-pandemic recovery.
Non-Hispanic white adults and those in relatively small or multiracial groups (including Native Americans) exhibited the lowest rates of thriving between 2008 and 2016. During this period, just 61% of non-Hispanic white adults registered high future well-being (the lowest across racial and ethnic groups) compared to 75% of Black adults (the highest). Combining current and future well-being, Asian Americans reported the highest rates of thriving during this time.
Between the periods of 2008-2016 and 2017-2019, all groups experienced an increase in the percentage of thriving respondents except Black Americans, who saw a decline from 54% to 51.9%. In contrast, the percentage of non-Hispanic white Americans thriving increased from 50.6% to 56.6%, and Latino or Hispanic Americans from 53.3% to 56.4%.
However, the overlapping impacts of the pandemic and social, political, and economic instability have contributed to significant and sustained declines in overall well-being. Since 2020, all racial and ethnic groups experienced a sharp drop in the percentage of adults thriving, consistent with the Gallup World Poll summary data. Asian Americans saw the sharpest decline, which aligns with the rise in anti-Asian hate.4 During this period, non-Hispanic white Americans registered the highest rates of thriving.
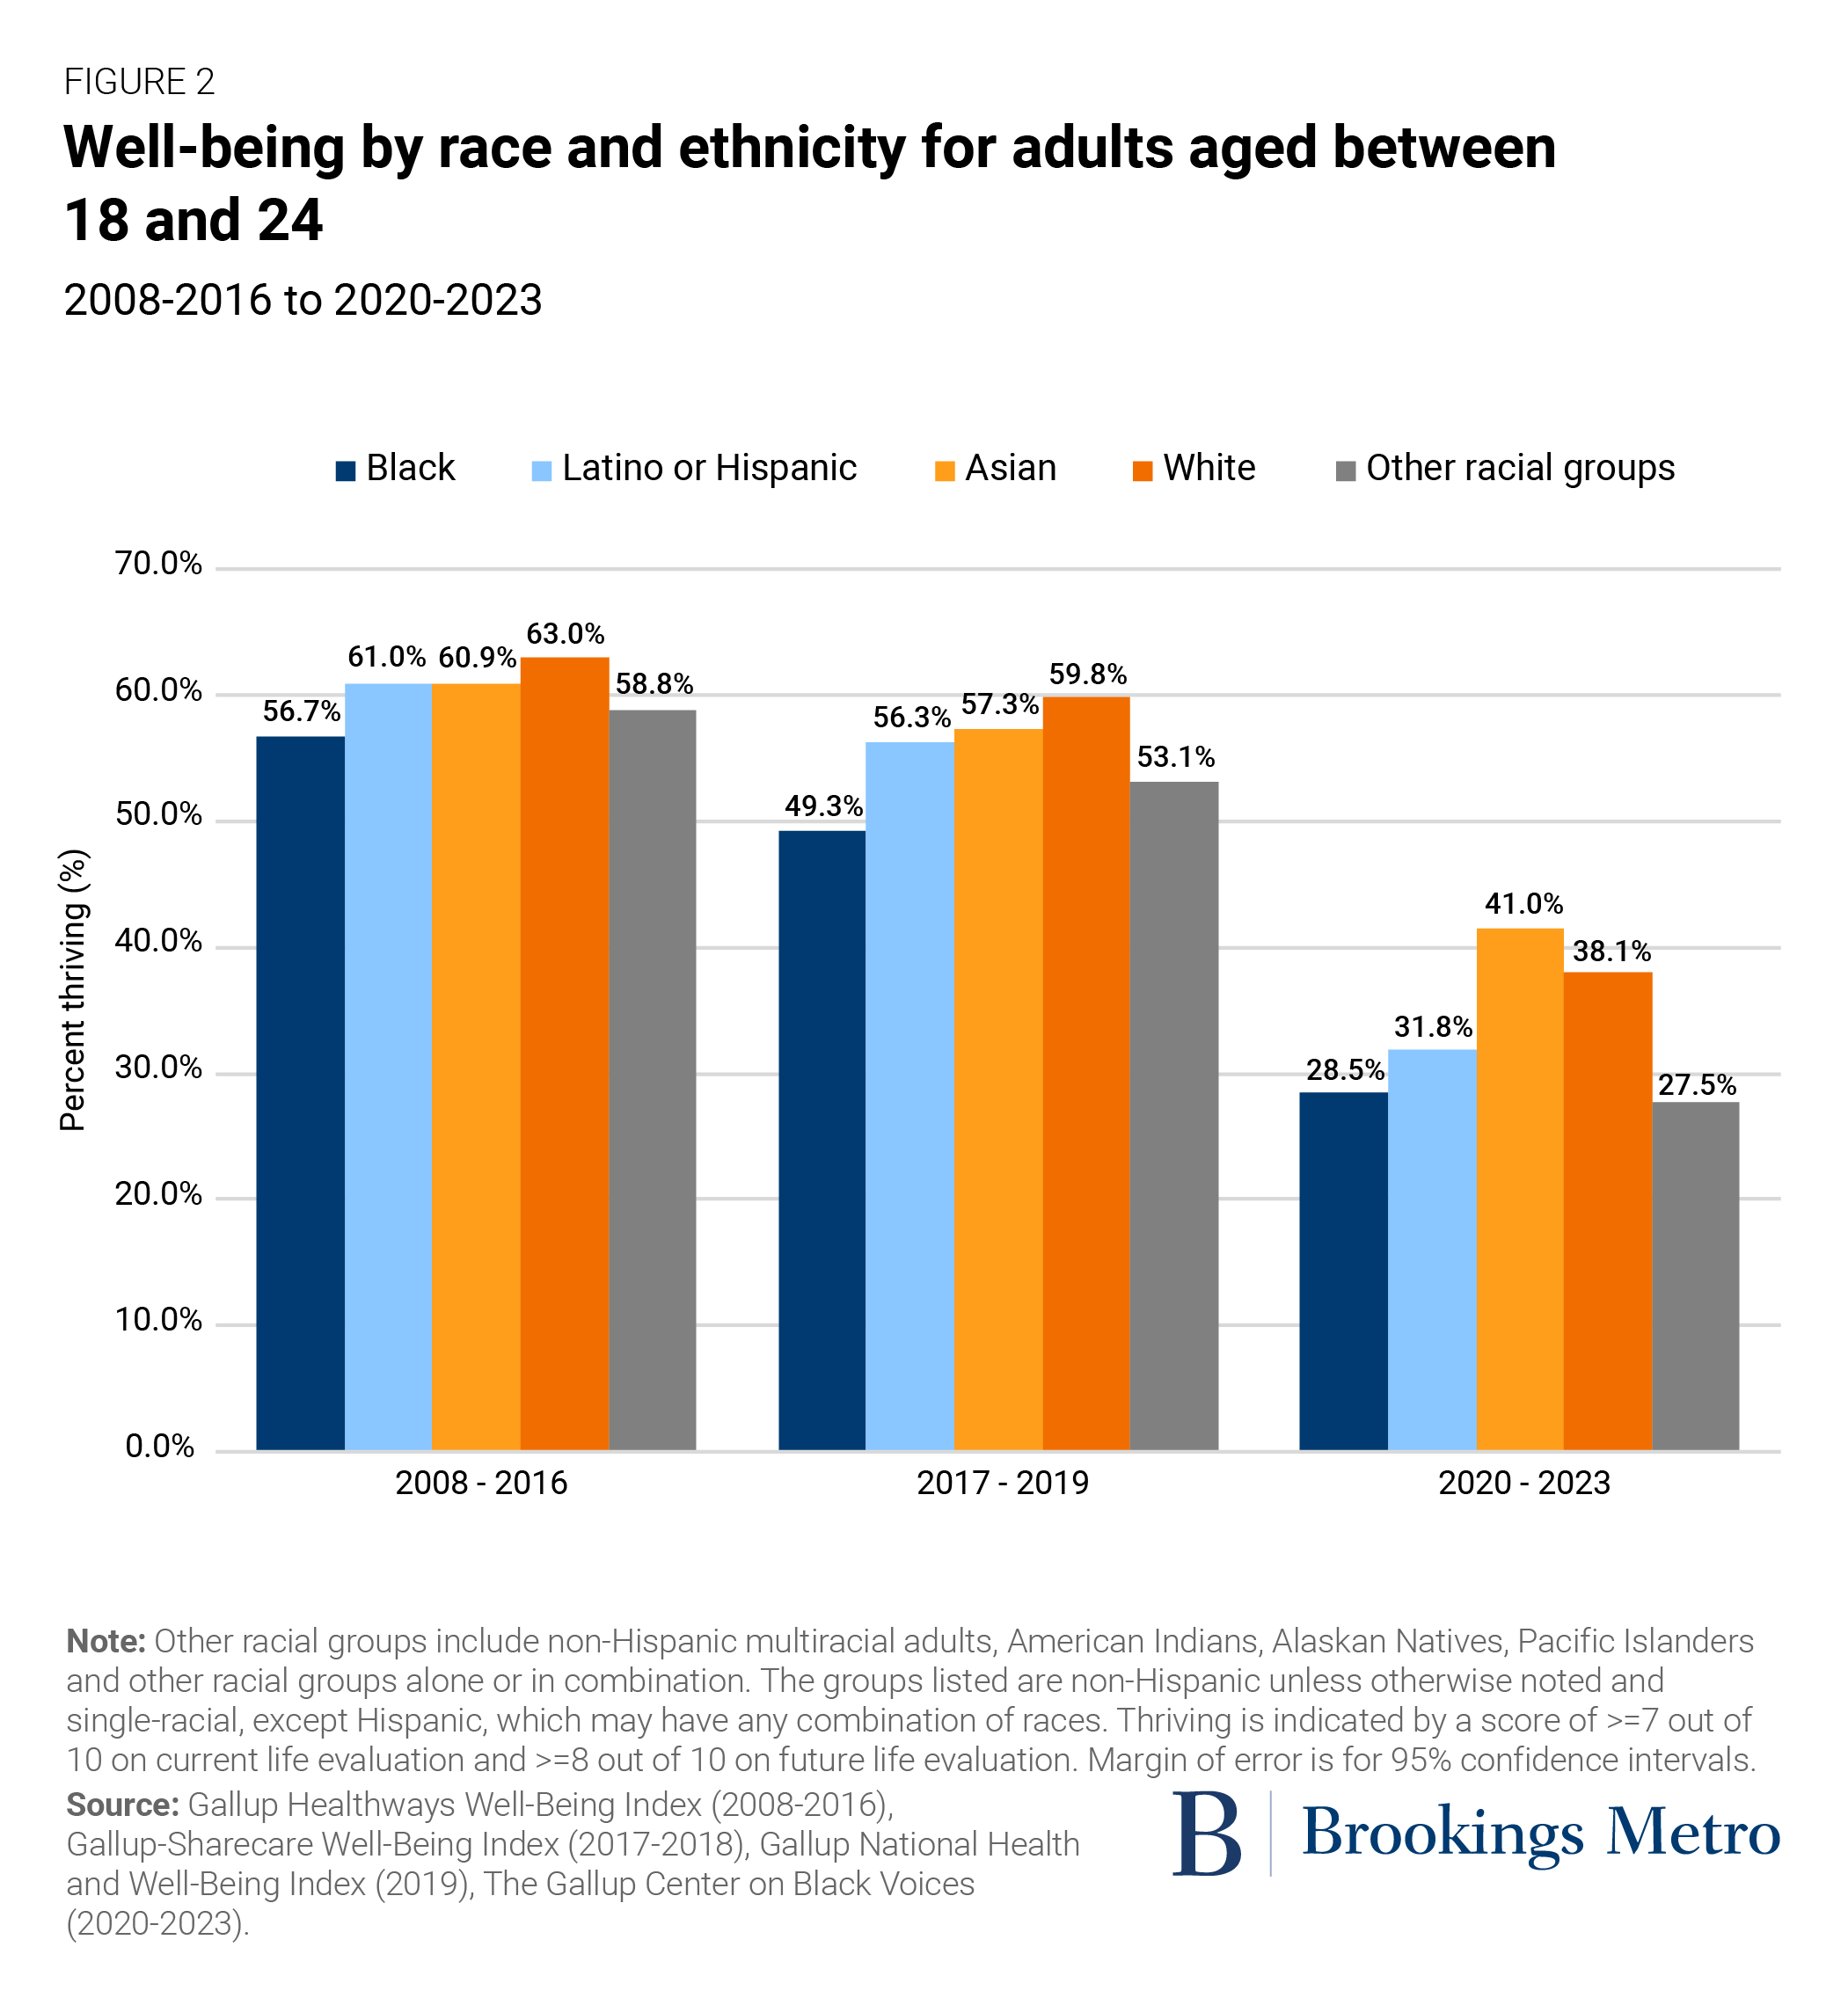
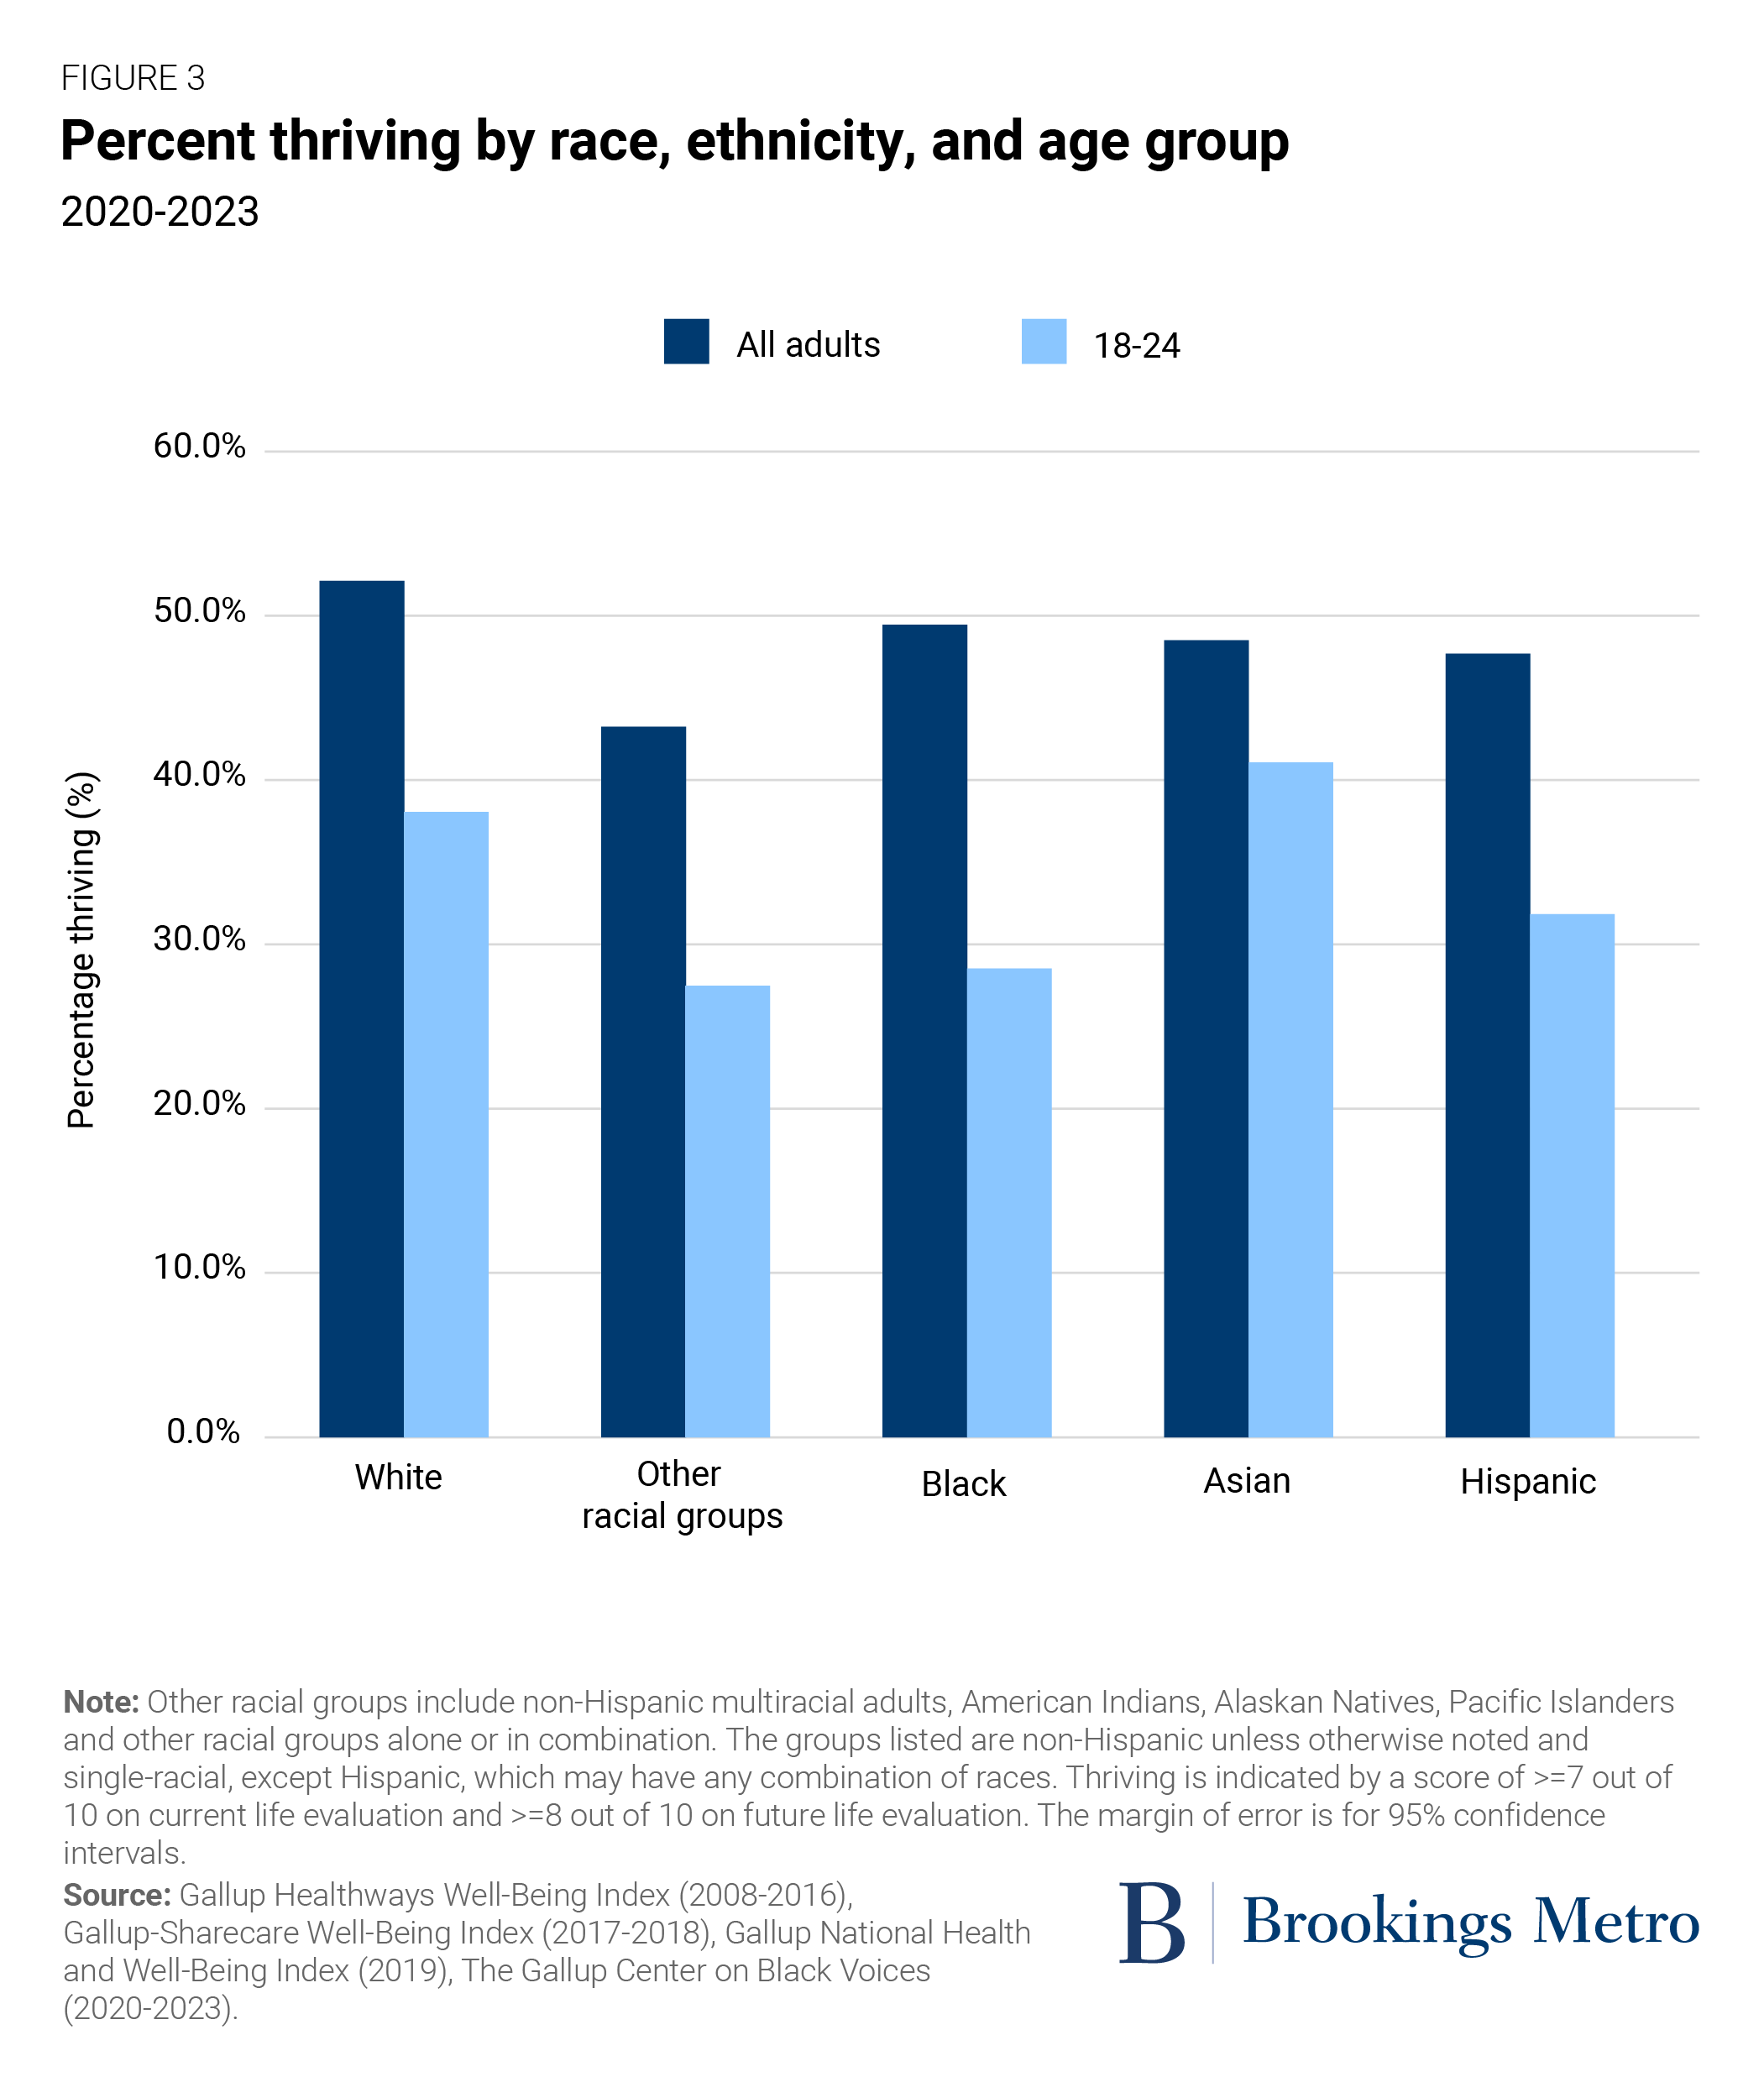
The decline in well-being has been especially pronounced in young adults ages 18 to 24. Figures 2 and 3 show that young white, Black, and Latino or Hispanic adults all saw 20 percentage point or larger reductions in well-being between 2008 and 2023, as did young people with non-Hispanic multiracial, American Indian, or other racial classifications. As recent Centers for Disease Control and Prevention data shows, these trends mirror alarming declines in adolescent health observed from 2011 to 2021, including higher suicidal ideation and attempts.
Moreover, Figure 2 shows that well-being is also becoming more unevenly distributed across racial lines for young Americans. Between 2020 and 2023, the variation between the adult groups reporting the highest level of thriving (white Americans) and the lowest (Latino or Hispanic Americans, excluding other racial groups) was about 4.2 percentage points. But for young adults, the variation across groups was between 9.2 and 13.5 percentage points. For example, 41% of Asian American young adults reported they were thriving, while only 28.5% of Black young adults did the same.
This shift toward lower youth well-being and more significant variation along racial lines is an obstacle to policies that attempt to promote shared interests, and it should raise the alarm for the capacity of the current approach to foster a collective sense of security.
Well-being and the crisis of deaths of despair in America
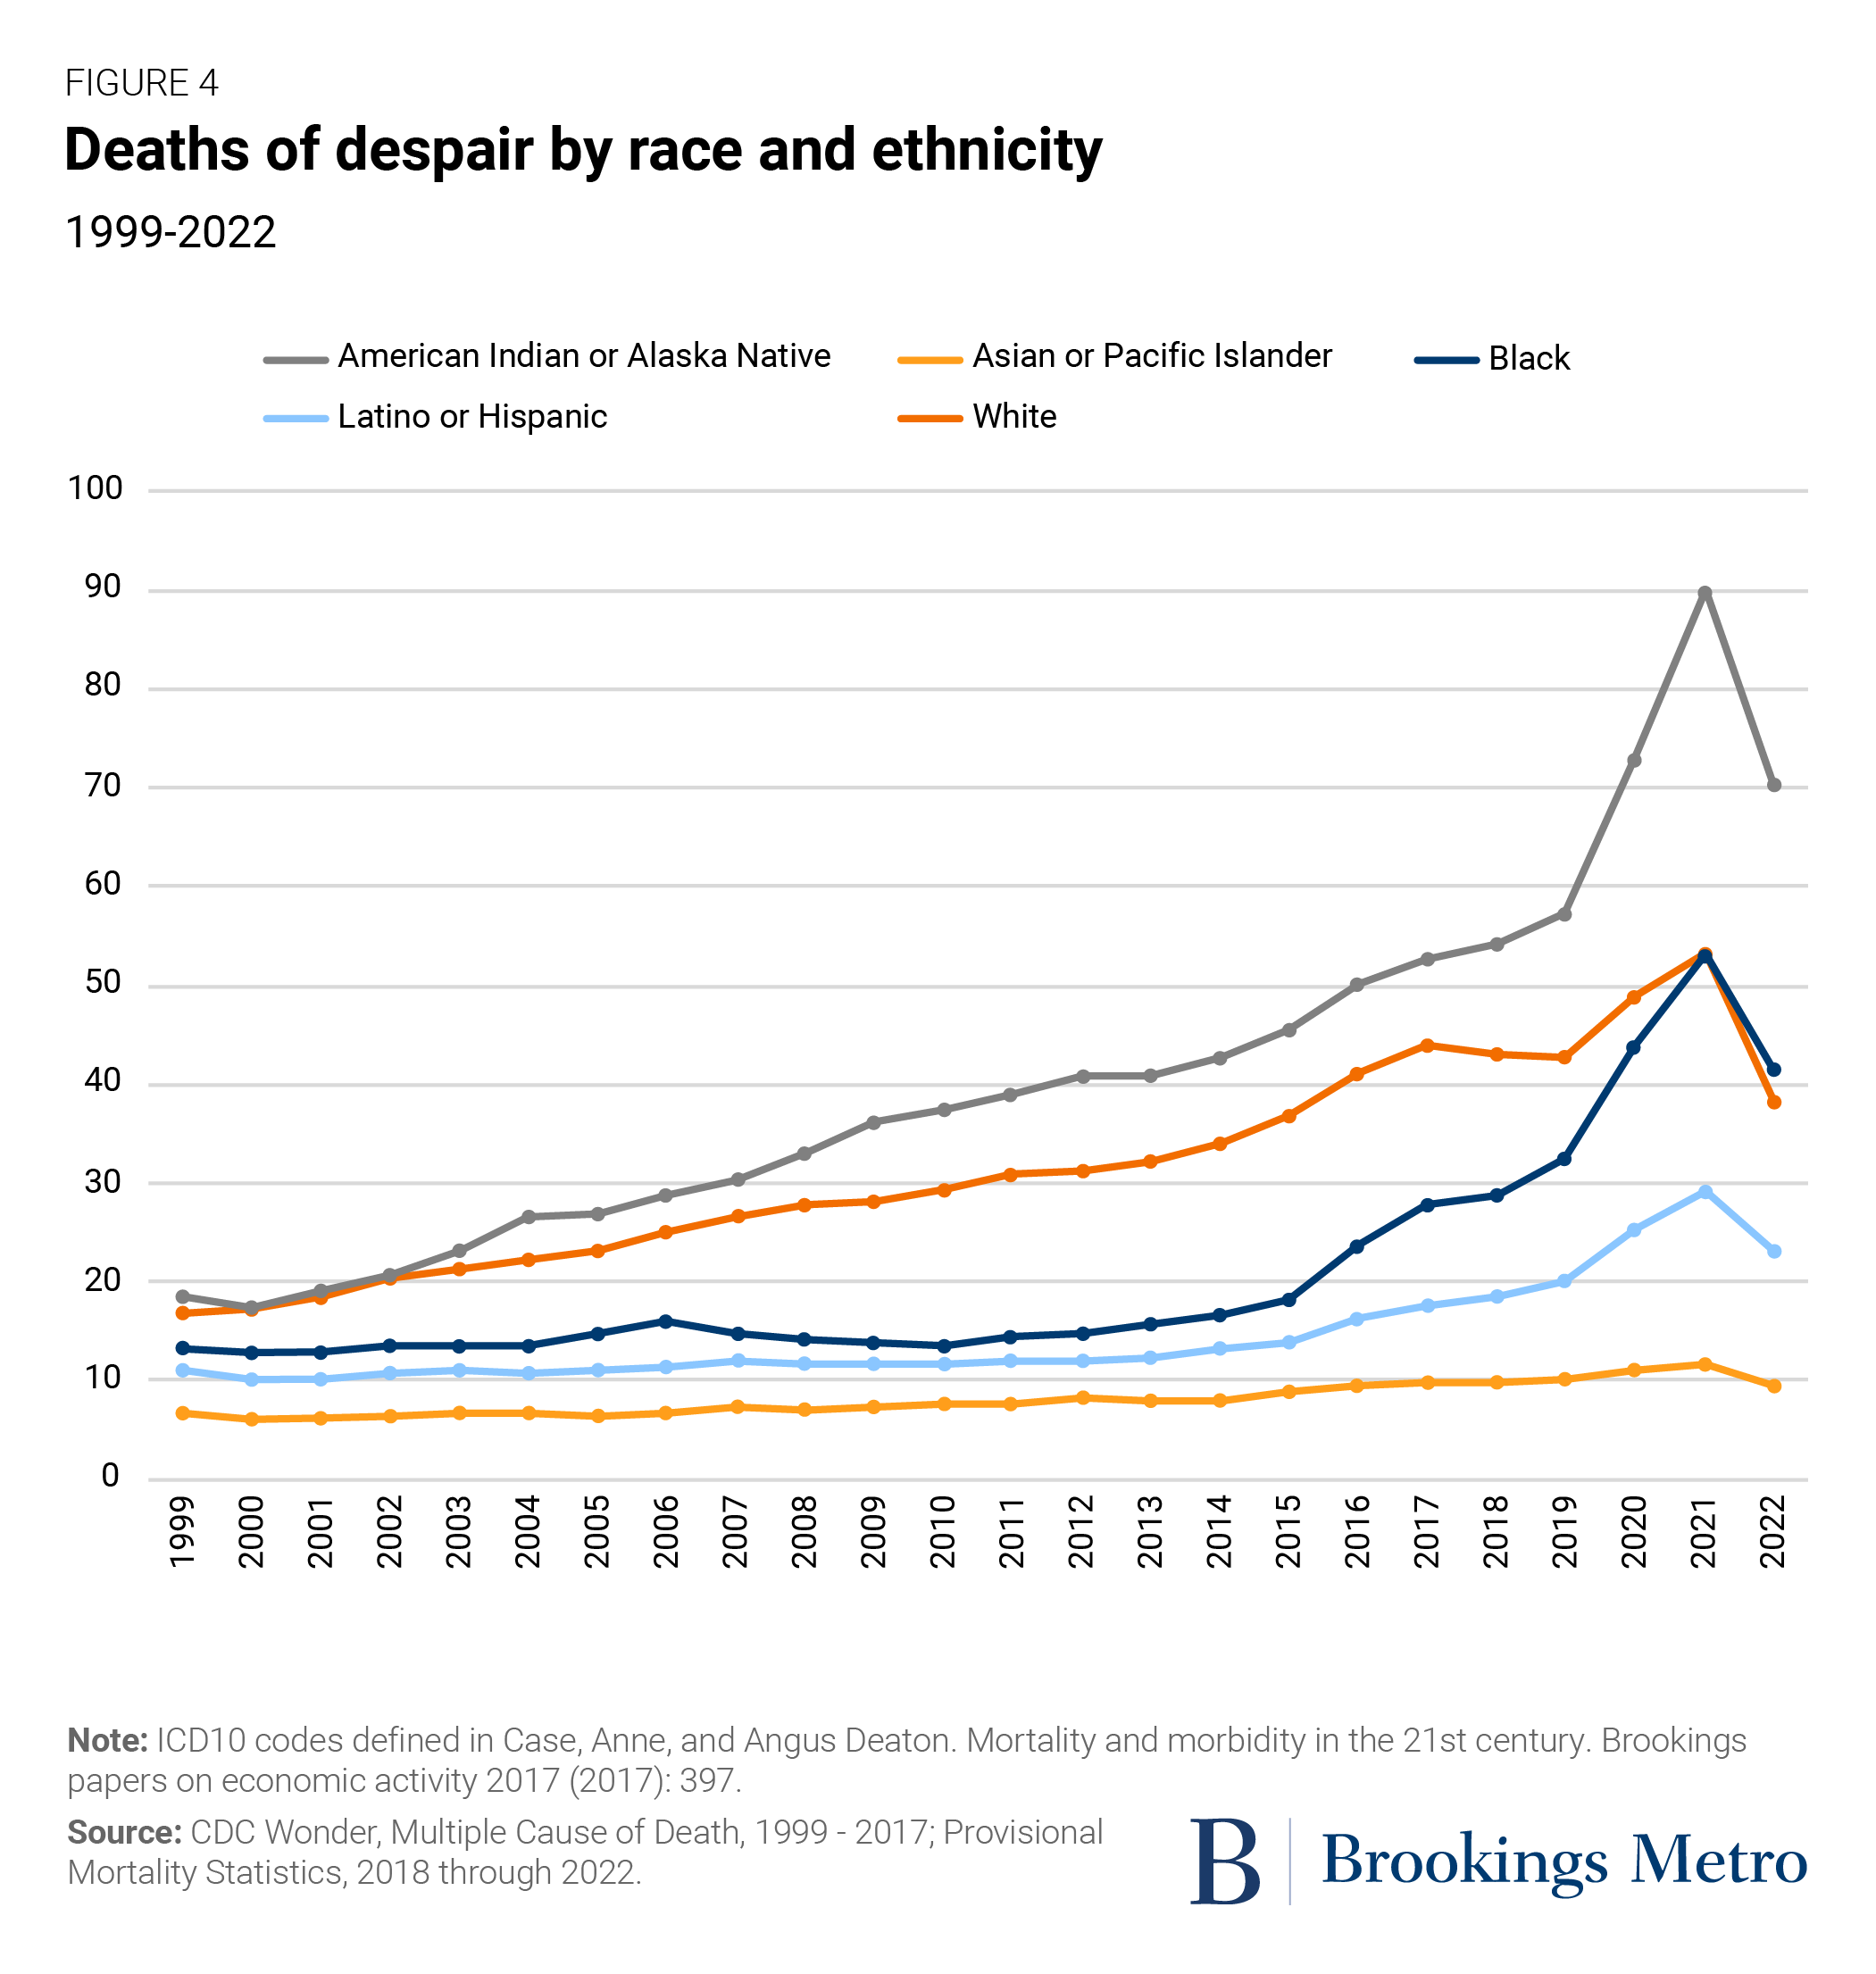
Well-being is a measure of thriving. However, an understanding of low well-being (suffering) provides equal insights. Recent work on deaths of despair (deaths from suicide, drug overdose, or alcoholism) offers a glimpse into how different racial groups cope, albeit negatively, with their environments.
In a series of groundbreaking works, economists Anne Case and Angus Deaton discovered that middle-aged non-Hispanic white Americans were increasingly dying from deaths of despair. In later work, they found the trend emerging in other racial groups and ages as well.
Well-being—and not conventional economic measures such as income—can help explain deaths of despair in the aggregate, across racial lines, and at the city level.
Personal and household income peak during middle age, so if income and well-being were tightly linked, this age should be least linked to deaths of despair. Yet Gallup data and analysis from scholars such as Jonathan Rauch show that well-being is at its lowest point in middle-age (40s to 50s) before it rises again later.
Well-being also provides a better explanation than socioeconomic measures for the racial trends in deaths of despair:
- Asian Americans had the highest rates of thriving and lowest rates of deaths of despair throughout the early 21st century (pre-pandemic).
- Non-Hispanic white Americans have higher rates of college attainment and higher incomes than Black and Latino or Hispanic Americans; however, they saw higher rates of deaths of despair up until the pandemic, consistent with their lower rates of thriving.
- The sharp fall in well-being since 2016 and again after the pandemic has resulted in Black Americans dying from deaths of despair at equal rates as white Americans.
- American Indians and other smaller racial groups continue to exhibit the highest rates of deaths of despair and the lowest rates of thriving.
When looking across U.S. cities, low well-being is a much stronger predictor of deaths of despair than income or educational attainment. To show this, we divided up 374 metro areas into groups of five, based on the percentage of residents who reported thriving in each area. The top-scoring metro areas had 25 deaths of despair per 100,000 residents from 2008 to 2020. The bottom-scoring group had 40.
Doing the same exercise with median household income or college attainment rate shows that these are also correlated with deaths of despair, but they are not as powerful at predicting them. The worst performers on income had 34 deaths of despair per 100,000 residents, and the worst performers on education had 33. Both of these are barely higher than the rate of the second-highest performing group of metro areas.5
The US metro areas where well-being is highest
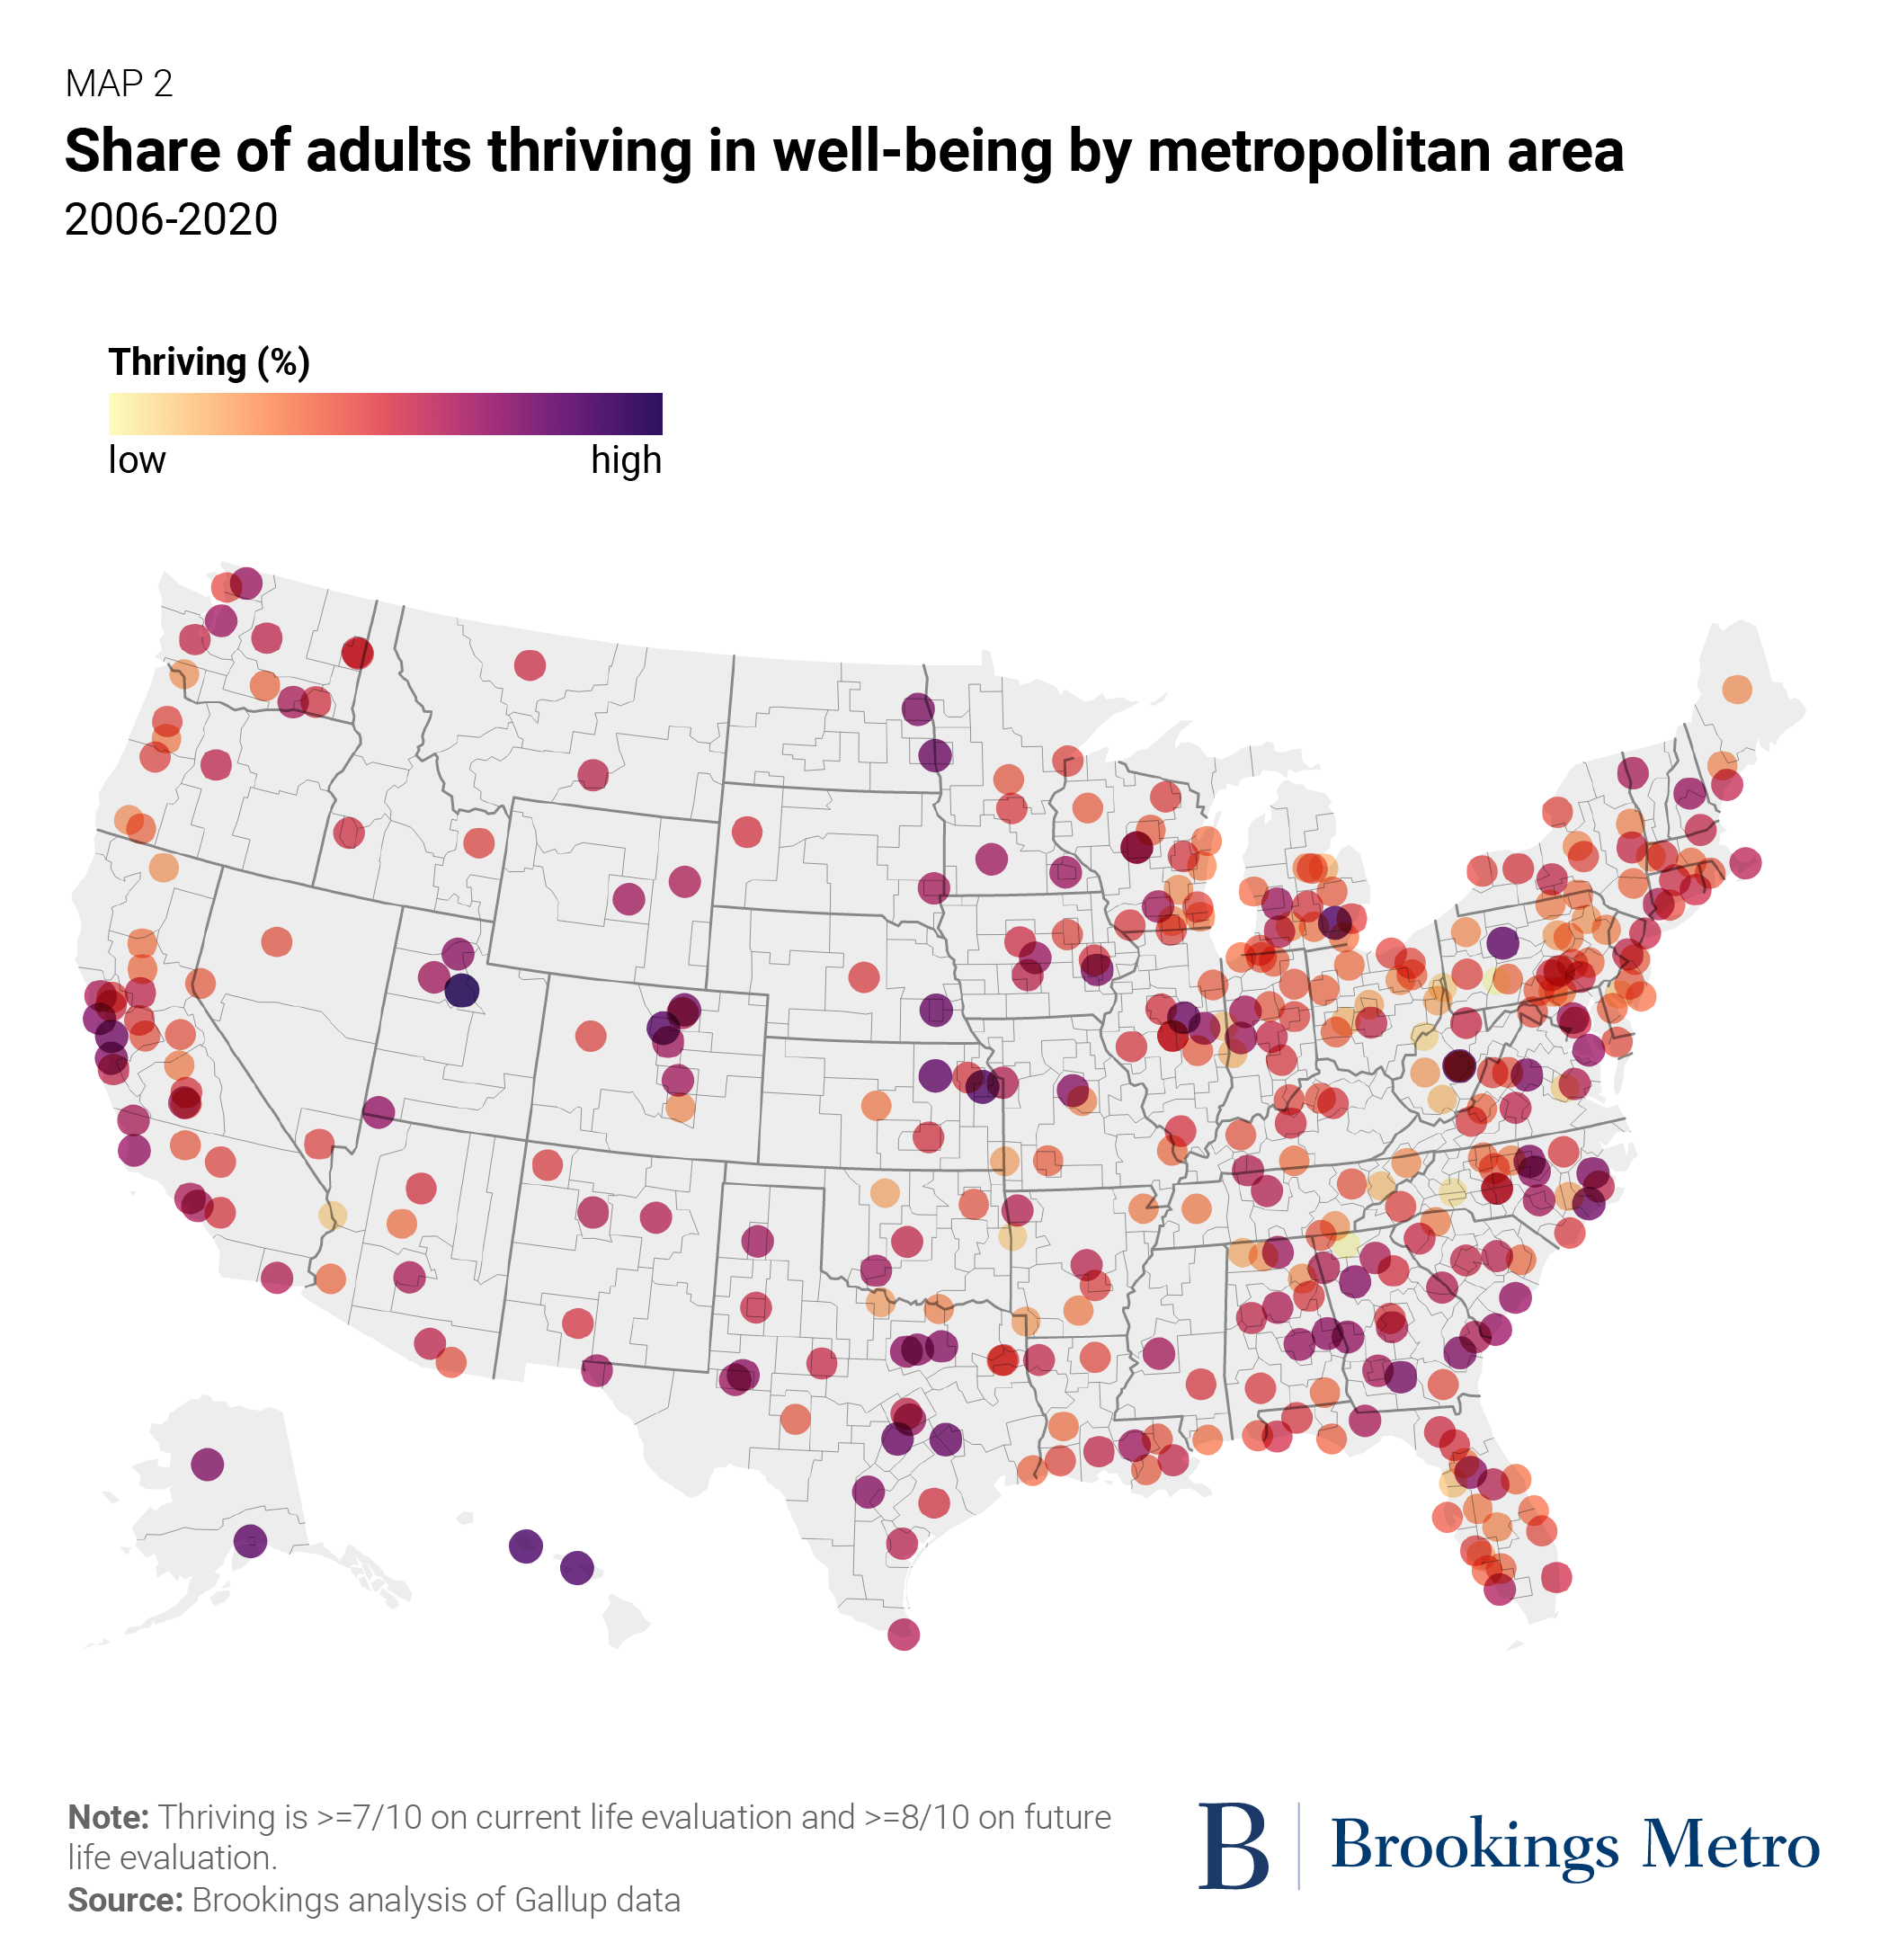
Where are Americans thriving? Broadly speaking, areas with the highest scores in well-being are overrepresented in the southern and western U.S., whereas the areas with the lowest scores are clustered around the Great Lakes, the Appalachians, and the Northeast. Coastal California, North Carolina, and Georgia tend to score highly.
Exploring well-being in metro areas matters because these places drive growth for their respective states and the country. Just as systems of inequality such as redlining were developed locally—and then were codified and resourced by the federal government—so too can inclusive policies. Understanding where people are thriving offers a foundation for racial cooperation and policy change. Dismantling the architecture of inequality can begin at the local level.
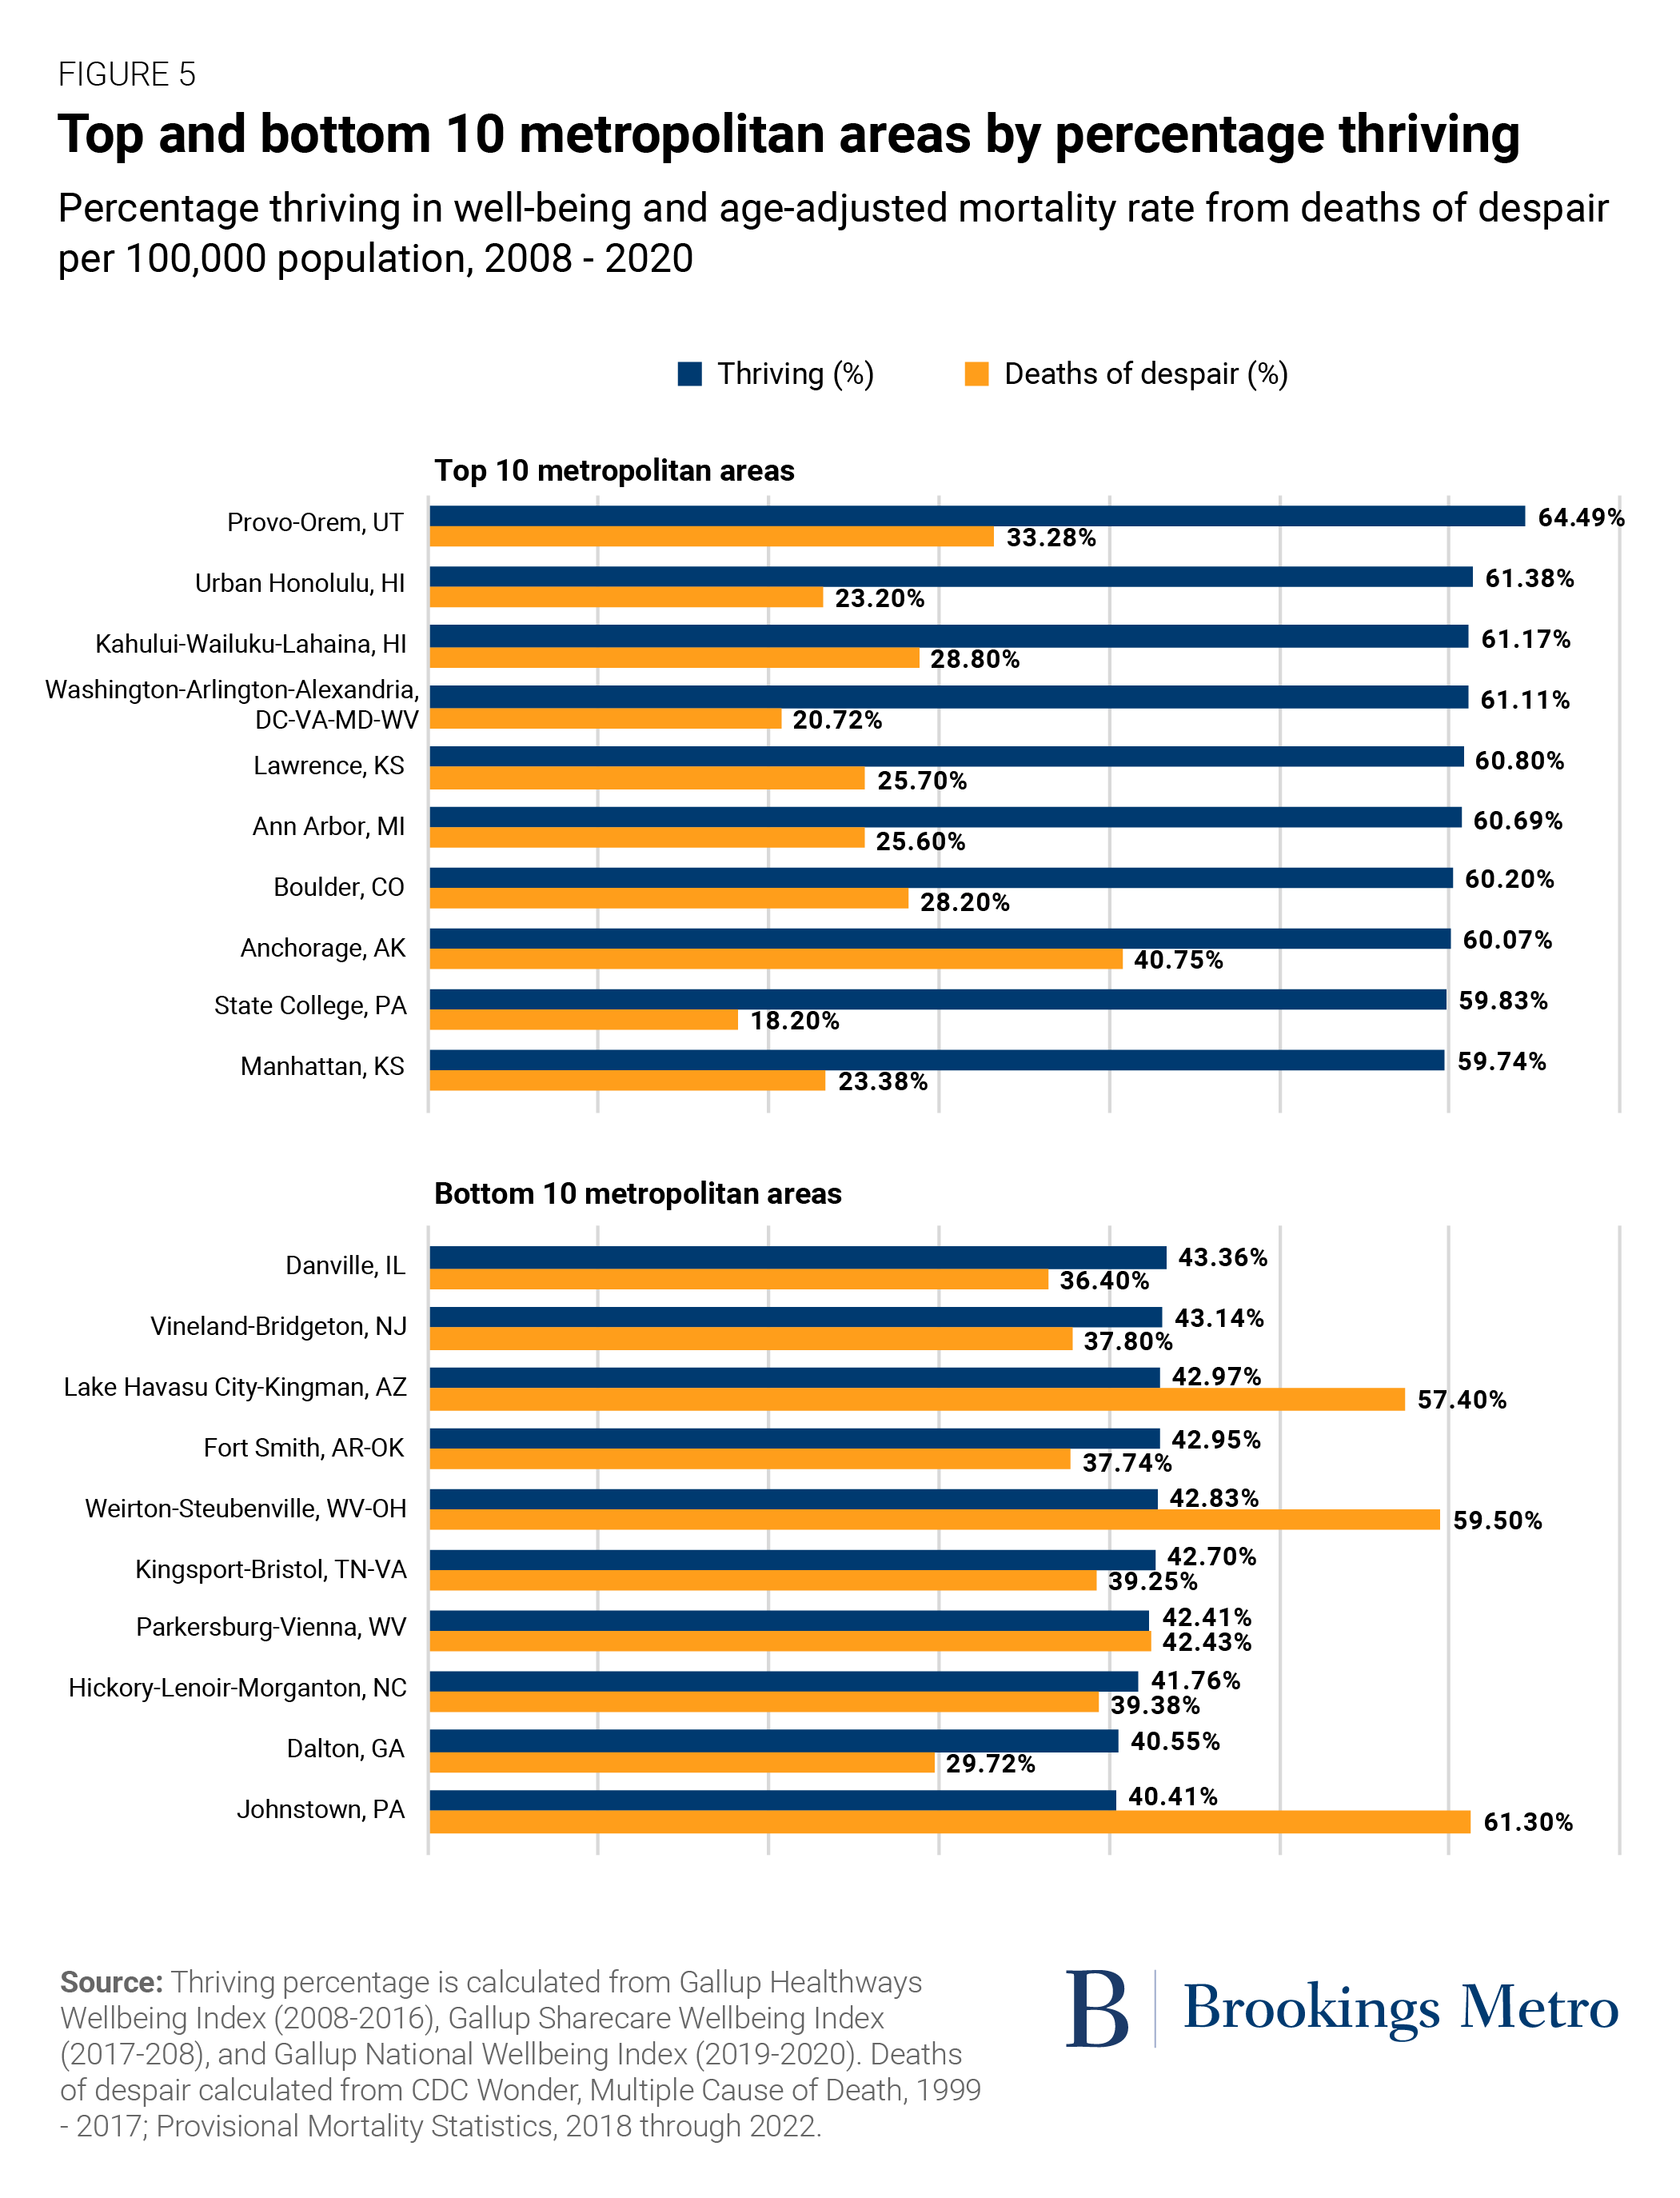
Figure 5 displays the top 10 and bottom 10 metro areas in the percentage of residents who reported they are thriving from 2008 to 2020. The table also reports the age-adjusted mortality rate from deaths of despair. For the average metro area, the share of residents thriving is 54%, and the mortality rate from deaths of despair is 29 per 100,000 residents. Eight of the top 10 regions for thriving are below the average for deaths of despair. For example, in Washington, D.C., 61% of residents are thriving, and there were only 21 deaths of despair per 100,000 residents. By contrast, deaths of despair are above average in all 10 metro areas with the lowest thriving rates. In some cases, the mortality rate is roughly double the average, as in Steubenville, Ohio, Johnstown, Penn., and Lake Havasu City, Ariz.
Many top-performing places where people are thriving across racial groups are college towns. Still, as noted above, educational attainment doesn’t explain the link between high well-being and low rates of deaths of despair.
This data shows that geography and place matter. While there are commonalities across cities where all racial and ethnic groups are thriving, there are also substantial differences in the regions and types of metro areas where each group is doing well.
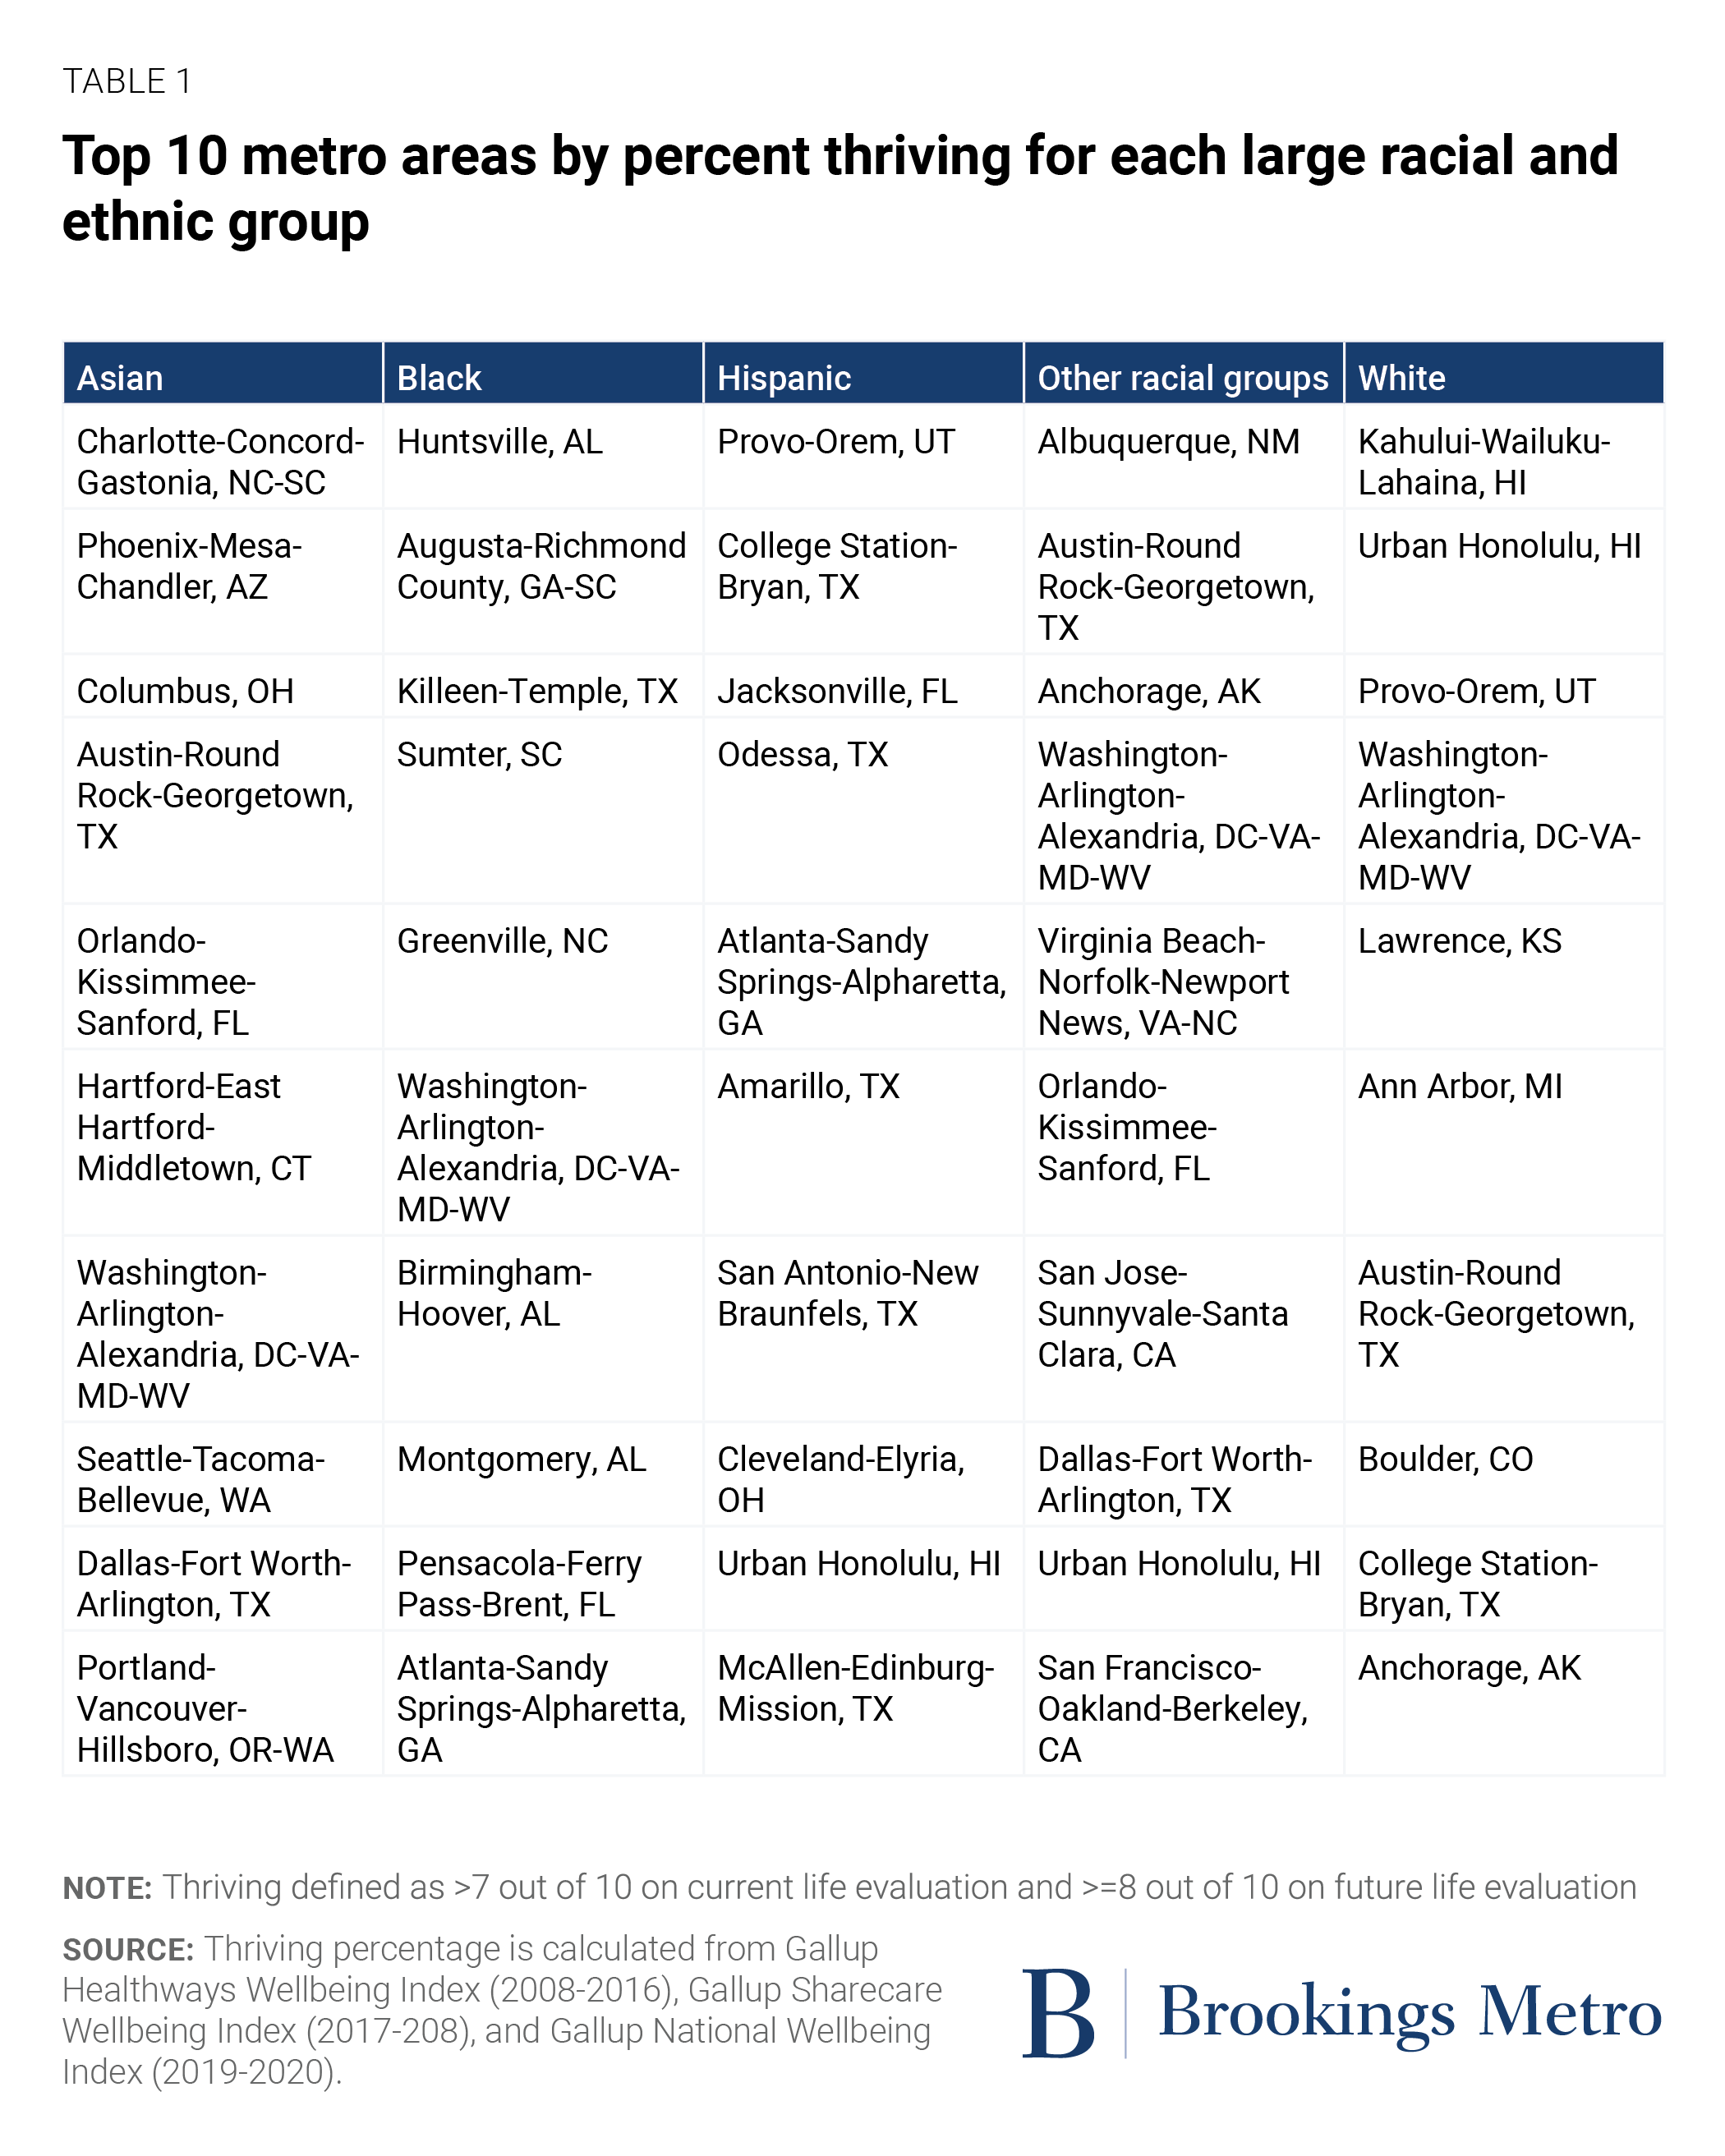
Table 1 provides a closer look at where people are thriving across and between racial groups, giving insights into how they are reckoning with the structures, economic trends, and social realities that help drive well-being, including whether or not a large number of people have died from deaths of despair.
Washington, D.C. scores in the top 10 for all racial groups except Latino or Hispanic Americans. Atlanta is in the top 10 for both Black and Latino or Hispanic Americans. Austin, Texas, is near the top for Asian Americans, those in other racial groups, and non-Hispanic white Americans. White Americans are most likely to thrive in Hawaii’s diverse but warm metro areas. In contrast, Black Americans enjoy their highest rates of thriving in Huntsville, Ala. and other small and midsized southern metro areas. Charlotte, N.C., Phoenix, and Seattle are among the top 10 for Asian Americans, whereas Texas is home to five of the top 10 areas for Latino or Hispanic Americans.
In February 2023, the Gallup Center on Black Voices surveyed 12,828 adult respondents and determined Black Americans are least likely to agree or strongly agree that the city or area where they live is the perfect place for them, followed by Latino or Hispanic Americans, Asian Americans, and white Americans—a majority of whom (57%) believe the city or area where they live is perfect for them. This is undoubtedly a reflection of institutionalized and structural racism and policy discrimination. Therefore, examining well-being in this manner can help determine where people continue to thrive, despite the de jure and de facto racism that still exists to this day. What are the civic lessons, policy insights, and collective actions and efforts in Huntsville, Ala. or Atlanta that provide a blueprint to uplift other places?
Our colleague Carol Graham and her co-author Sergio Pinto have found that thriving tends to be highest for people when they live in a place that has a relatively strong concentration of their race and culture, such as for Latino or Hispanic Americans in the Southwest and Black Americans in parts of the South. The increasing diversification in southern cities such as Atlanta—as opposed to the higher levels of segregation across neighborhoods in the Northeast—seems to also play a role.
Conclusion
Socioeconomic status and other conventional measures are only loosely connected with well-being, which is why group differences in current and anticipated life evaluation have shifted over the last 15 years despite consistent disparities in education and income. Well-being is a composite of material social and economic goods (housing, education, workforce, etc.) and the immaterial (social bonds, community cohesion) that influence outcomes. Universities and think tanks often elevate the former at the expense of the latter. By centering well-being in future analyses, we can account for the policies and behaviors that can transform a community for the better. Alongside traditional research on socioeconomic and racial outcomes, we will include the role of racial cooperation, social cohesion, and inclusivity using new datasets, surveys, and methods. Well-being offers a fresh framework for examining structural racism, opening the window for a new discourse. And our focus on place enables us to see variations of change due to the variety of civic actions, allowing for the cross-pollination of ideas between communities.
People of every racial and ethnic group want financial security, health, supportive social relationships, and opportunities to perform meaningful work in their homes or communities. Having confidence in institutions and leaders and having a sense of fairness in treatment by public officials, employers, and business partners also influence well-being. Building up these pillars of well-being avoids driving people to loneliness, anxiety, depression, and hopelessness, allowing them to thrive.
By focusing on where all groups are thriving, we can see where cooperation and democratic decisionmaking are most likely to be a reality and work toward high levels of well-being for everyone, regardless of race or ethnicity.

Authors


-
Footnotes
- Full wording is “Please imagine a ladder with steps numbered from zero at the bottom to ten at the top. The top of the ladder represents the best possible life for you and the bottom of the ladder represents the worst possible life for you. On which step of the ladder would you say you personally feel you stand at this time?” Future well-being asks: “On which step do you think you will stand about five years from now?” This is known as the Cantril ladder from Cantril, H. (1965). The pattern of human concerns. New Brunswick, NJ: Rutgers University Press.
- A regression of percentage thriving against the Simpson’s diversity index at the metro area level has an R squared of 0.1506.
- Data was obtained through Gallup Analytics.
- Note that data collection moved from random-digit dialing from 2008 to 2018 and address-based sampling in 2019 to panel-based data collection from Gallup and Dynata sources since 2019. Gallup statisticians developed analytic weights to maintain a nationally representative sample, but non-sampling errors could affect these results.
- A regression of deaths of despair on percentage thriving, the bachelor’s degree or higher educational attainment rate, and median household income confirms this result. Percent thriving is by far the strongest predictor alone or in combination with these other variables.
The Brookings Institution is committed to quality, independence, and impact.
We are supported by a diverse array of funders. In line with our values and policies, each Brookings publication represents the sole views of its author(s).