
U.S. housing markets have mostly recovered from the foreclosure crisis of the mid-2000s. But now analysts and commentators point to another concern: housing prices are rising faster than incomes because supply isn’t expanding enough. Some state and local policymakers are proposing policies designed to encourage more new construction. As we explained in a previous article, new construction is only one piece of housing supply. In this article, we unpack the housing supply puzzle. What are the different ways in which housing units enter and exit the inventory? How do mechanisms of housing gains and losses vary across geographic areas in the U.S.? How have they changed over time?
To describe patterns of housing change, we draw on HUD’s Components of Inventory Change (CINCH) reports. The underlying data comes from the biennial American Housing Survey, jointly managed by HUD and the Census Bureau.
Housing stock grew the most in the suburbs, churned the most in rural areas
To begin, we summarize additions, losses, and churn in the housing stock. Churn is the sum of additions and losses, and is frequently used as a measure of dynamism or turnover in housing markets. For instance, compare two hypothetical cities: one saw 800 new units constructed and 500 old homes demolished over a two-year period, while the other saw 300 newly built homes and no demolitions. Both cities would have a net gain of 300 homes, but the total level of housing market activity, or churn, is much higher in the first city. Because the U.S. housing stock is growing larger over time, we express churn as a percentage of the housing units present at the beginning of the two-year period.
The U.S. housing stock evolved slowly from 1985 through 2013, as expected for a durable good (Table 1). The two-year churn rate averaged 6 percent of the initial housing stock during this time. On average, additions exceeded losses, implying net growth in housing units.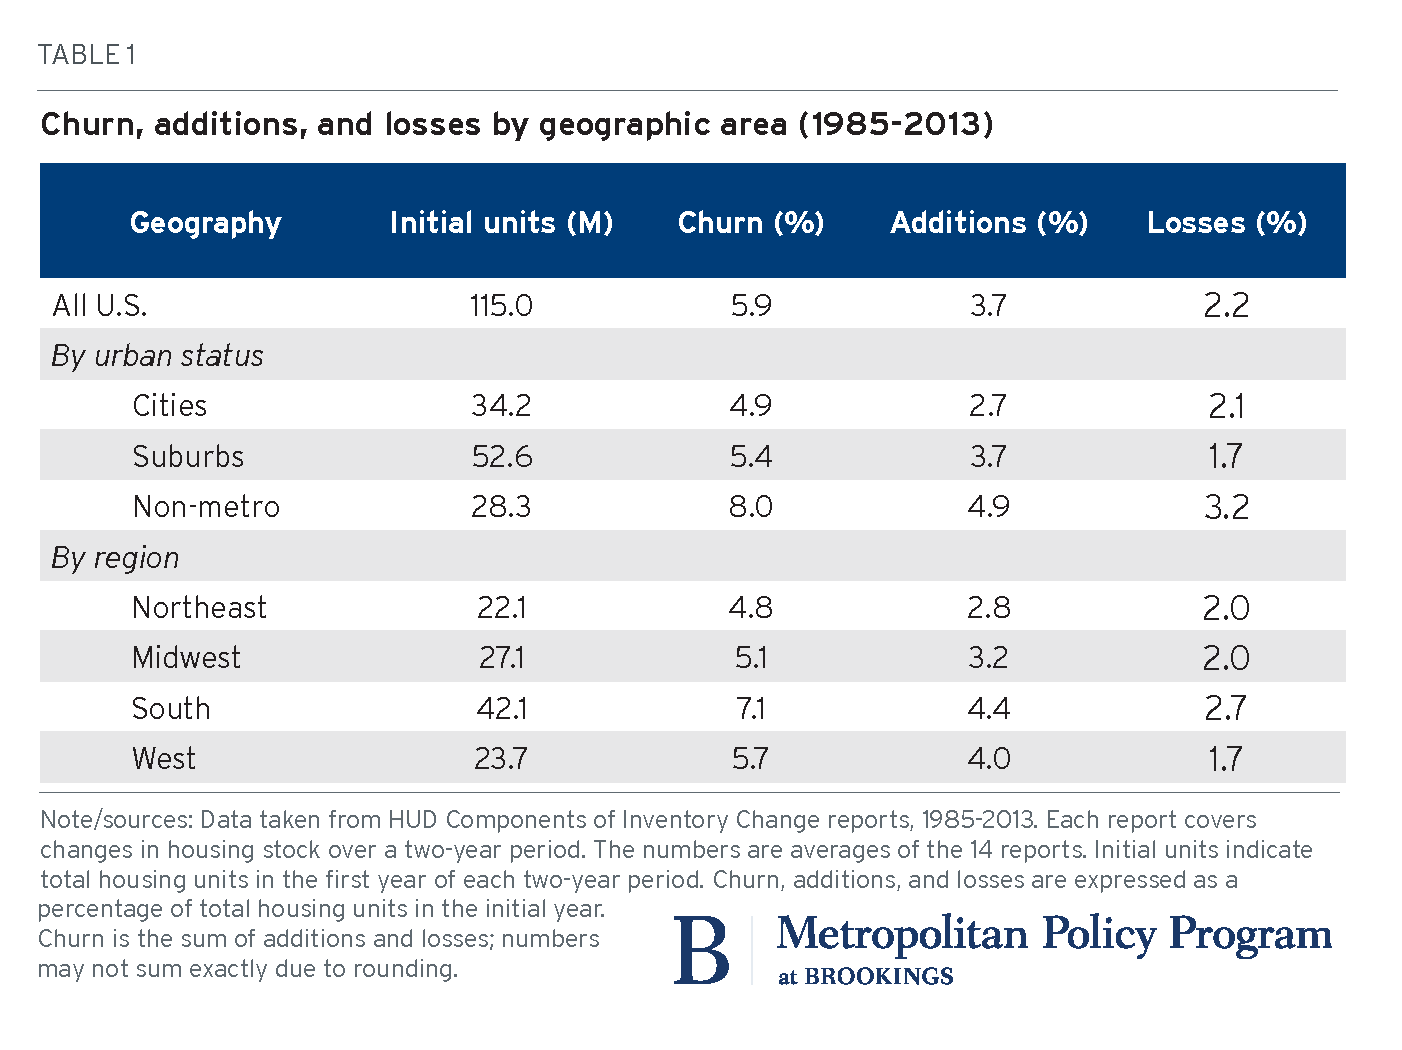 The size of the housing stock, churn rates, and the relative size of additions and losses varied across different geographic areas in the U.S. Suburbs accounted for the largest share of U.S. housing in all years during this period, around 46 percent of all units. About 30 percent of housing units were in central cities, with the remaining 25 percent outside metropolitan areas. The housing churn rate was higher in rural areas than in central cities or suburbs during this time period. But housing additions exceeded losses by larger margins in both central cities and suburbs, implying more growth inside metropolitan areas than outside them. Suburban areas had the largest margin of additions over losses, implying the net largest growth.
Comparing the four census regions, housing churn was higher in the South and West than in either the Northeast or Midwest. The South and West also had bigger positive margins of additions over losses, matching regional shifts in the U.S. population. The Northeast had the lowest churn rate as well as the smallest positive margin of additions minus losses.
Related Content
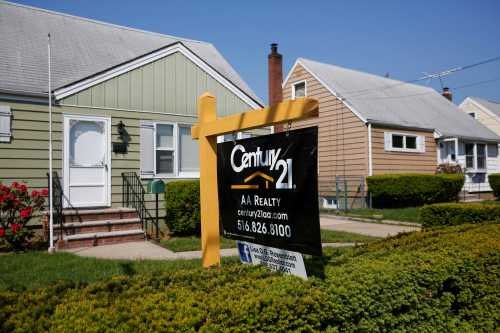

How “new” housing emerges depends on which part of the country you live in.
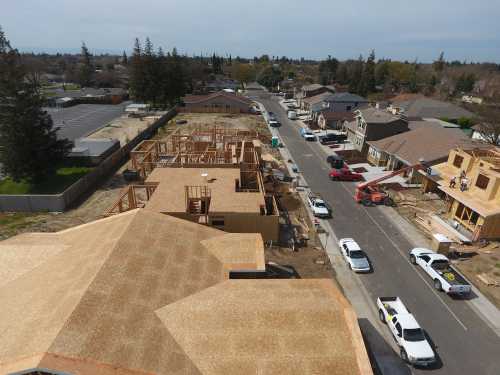
In assessing the health of the U.S. housing industry, analysts and the media tend to focus on measures of new construction. Nationally, that’s not an unreasonable choice: nearly 70 percent of additions to the U.S. housing stock came from new construction (Figure 1). But new construction is not the only means of adding housing. About 15 percent of additional units came from reconfigurations of existing buildings. For example, a large single-family house could be subdivided into several apartments, or an “accessory apartment” could be built over a garage. Relatively small shares of additions nationally came from three remaining channels: restorations of previously damaged structures; relocations of mobile homes; and conversions of non-residential structures, such as office buildings.

The mechanism that contributed most to housing gain differed across central cities, suburbs, and non-metropolitan areas. New construction played a larger role in suburban areas—which tend to have large parcels of open space attractive for developing subdivisions—than in central cities, which are denser and have fragmented land ownership. By contrast, reconfiguration of existing structures accounted for roughly one in four additional housing units in central cities, compared with fewer than one in 10 suburban housing units. Non-metropolitan areas saw substantially more gains from mobile homes and less new construction than the national average. Lower population densities and the smaller scale of rural communities raise the average per-unit cost of housing and related infrastructure.
Some differences were also evident across census regions. The components of housing gains in the Northeast were similar to those in central cities: less new construction, more reconfiguration of existing buildings and conversion of non-residential structures. Housing gains in the South and West were more closely linked to new construction. Mobile homes accounted for more than 10 percent of housing gains in the South, but only 4 percent in the Northeast.
No dominant mechanism explains housing losses, nationally or regionally
The loss of units from the housing stock receives much less attention from researchers and commentators than additions, although it is equally important in determining housing availability. This may partly reflect the complex and fragmented set of channels through which housing units are lost: no single mechanism explains more than one-fifth of housing losses nationally (Figure 2). The three largest contributors during this period were demolition, reconfiguring existing buildings to include fewer units (for instance, combining two apartments into one), and relocation of mobile homes. Other sources of loss included damaged houses being taken off the market and conversion of housing into non-residential uses.

As with additions, mechanisms of housing loss vary by metropolitan area status. Central cities lose more homes to building reconfiguration and damage. Losses in the suburbs look roughly like the national pattern. Similar to additions, mobile home movements explain nearly one-third of losses in non-metropolitan areas. Comparing loss components across census regions, demolitions play larger roles in the Midwest and the South. Mobile home movements explain nearly 30 percent of losses in the South, but less than 8 percent in the Northeast. Reconfigurations are most important in the Northeast.
It’s not your imagination. The U.S. really is adding less housing than it used to
The churn in U.S. housing markets fluctuates over time, like most macroeconomic indicators, but showed a marked downward trend during this period (Figure 3). Biennial churn rates dropped from about 7.5 percent between 1985 and 1987 to just over 2.5 percent between 2011 and 2013. Most of the decline in churn was driven by the slowing rate of additions to the housing stock. Additions to the U.S. housing stock exceed losses for nearly all two-year periods, implying overall growth in the housing stock. The positive margin of gains over losses widened during the housing boom (2001-2007), then narrowed during the Great Recession and recovery. Between 2011 and 2013, housing gains barely exceeded losses. Both additions and losses declined during the strong economy of the late 1990s, then continued to drop. Even in 2007, at the peak of the housing boom, additions and losses lagged previous levels. Throughout the entire period, losses were less noisy than additions, perhaps confirming prior research that housing often outlasts demand.

Most new housing is still added in suburbs, but the rate of suburban gains have slowed
The national trends over time shown in Figure 3 mostly reflect a steep decline in housing churn in suburban areas (Figure 4). Housing markets in central city, suburban, and rural areas saw declining churn over this time period. The drop-off in suburban areas was nearly twice as steep as in central city and non-metropolitan housing markets. Although suburban housing markets continued to grow, with additions outpacing losses, they grew at an ever slower rate, driven mostly by smaller gains.

Churn rates did not map clearly onto macroeconomic time trends in any region. Central cities saw declining churn rates during the relatively strong economy of the late 1990s and nearly flat churn during the early 2000s housing boom. Suburban housing markets saw declining churn during the late 1990s and the early 2000s. Non-metropolitan areas saw a sharp uptick in churn during the early 2000s, before the Great Recession brought churn rates back in line with prior levels. Time trends in churn rates did not differ much across the four census regions.
Takeaways for policy
State and local policymakers in many parts of the U.S. are grappling with ways to make housing more affordable. Our analysis of housing supply suggests two important lessons.
All housing markets are local: Reporting only on national numbers—housing starts, completions, or building permits—obscures underlying local variations that drive housing prices. Housing demand depends on local demographics, job markets, and place-based amenities. Housing supply depends on local availability of land and the cost and complexity of housing development. Policies that affect development through all the mechanisms described are adopted by local governments. If we want to understand and correct housing shortages, we need to look below the national level.
Land use regulation and local property taxes badly need a 21st century makeover: The U.S. is no longer a nation of pioneers building log cabins on the Western frontier. Nor is it a post-WWII nation of nuclear families buying tract homes in Levittown. We can’t indefinitely rely on new construction of low density, single-family housing to accommodate population growth. Far too many local governments still have zoning that prioritizes large-lot single family homes over townhouses, multifamily buildings, or mixed residential-commercial structures. For housing supply to grow, more localities need to update their zoning, building codes, and property taxes to allow and incentivize higher density housing, particularly near employment centers and transportation infrastructure. Suburbs could learn from their urban cousins on how to accommodate more housing growth through mechanisms beyond new construction.
Rahee Jung provided excellent research assistance for this blog.
Authors


The Brookings Institution is committed to quality, independence, and impact.
We are supported by a diverse array of funders. In line with our values and policies, each Brookings publication represents the sole views of its author(s).