
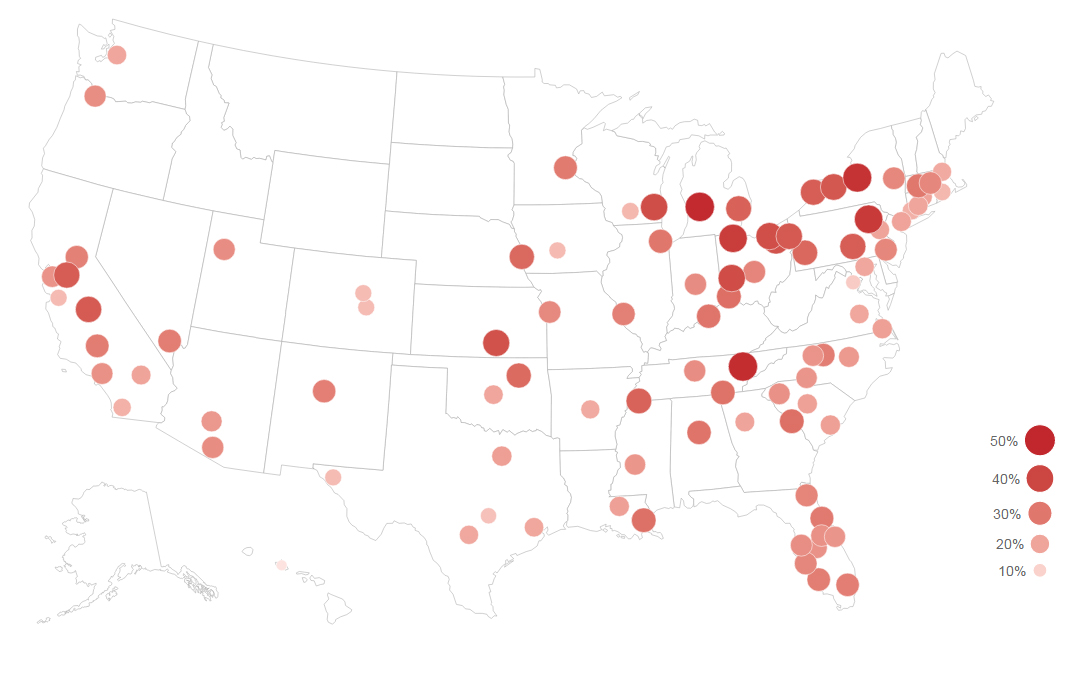
The highest rates of multidimensional poverty are found in Southern and Western metro areas like Memphis, Birmingham, and Miami, where more than 1 in 5 low-income adults live with multiple disadvantages. The McAllen region exhibits the highest rate of multidimensional poverty overall (41 percent), followed by metropolitan Fresno, where one-third of adults are at least doubly disadvantaged. In each of the regions mentioned, living in a poor area is the most likely additional disadvantage experienced by low-income residents. But in other metro areas with above-average multidimensional poverty rates, different disadvantages come to the fore, like limited education in Stockton, lack of health insurance in Deltona, and lack of employment in Lakeland (see the interactive bar charts below, or the full appendix tables).
In contrast, regions with lower rates of multidimensional disadvantage tend to be stronger markets that have lower shares of low-income adults to begin with, like metro Boston, San Jose, Seattle, and Washington, D.C., each of which has less than 10 percent of the adult population living with low incomes and at least one additional disadvantage.
In keeping with the national patterns explored in the previous paper, rates of multidimensional disadvantage in major metro areas run much higher for Hispanics and blacks than for whites. Overall, 28 percent of low-income Hispanics and 24 percent of low-income blacks in the top 100 metro areas live with at least one additional disadvantage, compared to just 9 percent of whites. Among individual metro areas, rates of multidimensional poverty for whites range from just 3 percent (Washington, D.C.) to 22 percent (McAllen). For African Americans, those shares range from 6 percent (Oxnard-Thousand Oaks-Ventura) to 45 percent (Grand Rapids), while the rates for Hispanics span from 7 percent (Honolulu) to 58 percent (Birmingham).
Regions that rank the highest for shares of low-income whites living with multiple disadvantages tend to fall in the South and West (e.g., Knoxville, Albuquerque, Birmingham), in keeping with the overall findings for major metro areas. In contrast, for blacks, the high-share regions are more likely to fall in the Midwest and Northeast (e.g., Grand Rapids, Milwaukee, Cleveland), while for Hispanics, the metro areas with the highest shares cover a diverse array of places (e.g., Winston-Salem; Springfield, Mass.; Indianapolis; Providence). Although some regions place highly for more than one group, only Fresno ranks in the top 20 overall and for all races and ethnicities.
Urban and rural low-income adults are the most likely to experience multidimensional disadvantage of any kind, but the specific disadvantages they face differ from each other.
The metropolitan findings demonstrate the wide variation that exists in the extent to which disadvantages cluster across places, but disparities exist within metropolitan areas as well, both in the share of residents facing multiple disadvantages and in the types of disadvantages most prevalent.
Within the nation’s largest metro areas, low-income adults in cities are twice as likely as low-income suburban residents to face multiple disadvantages (Table 1). Across the spectrum of geography types, ranging from the most urbanized to the least, residents at either end face the highest rates of multidimensional poverty. Roughly 1 in 5 residents in cities and in rural areas are at least doubly disadvantaged. But the types of disadvantages are somewhat different depending on the type of community.
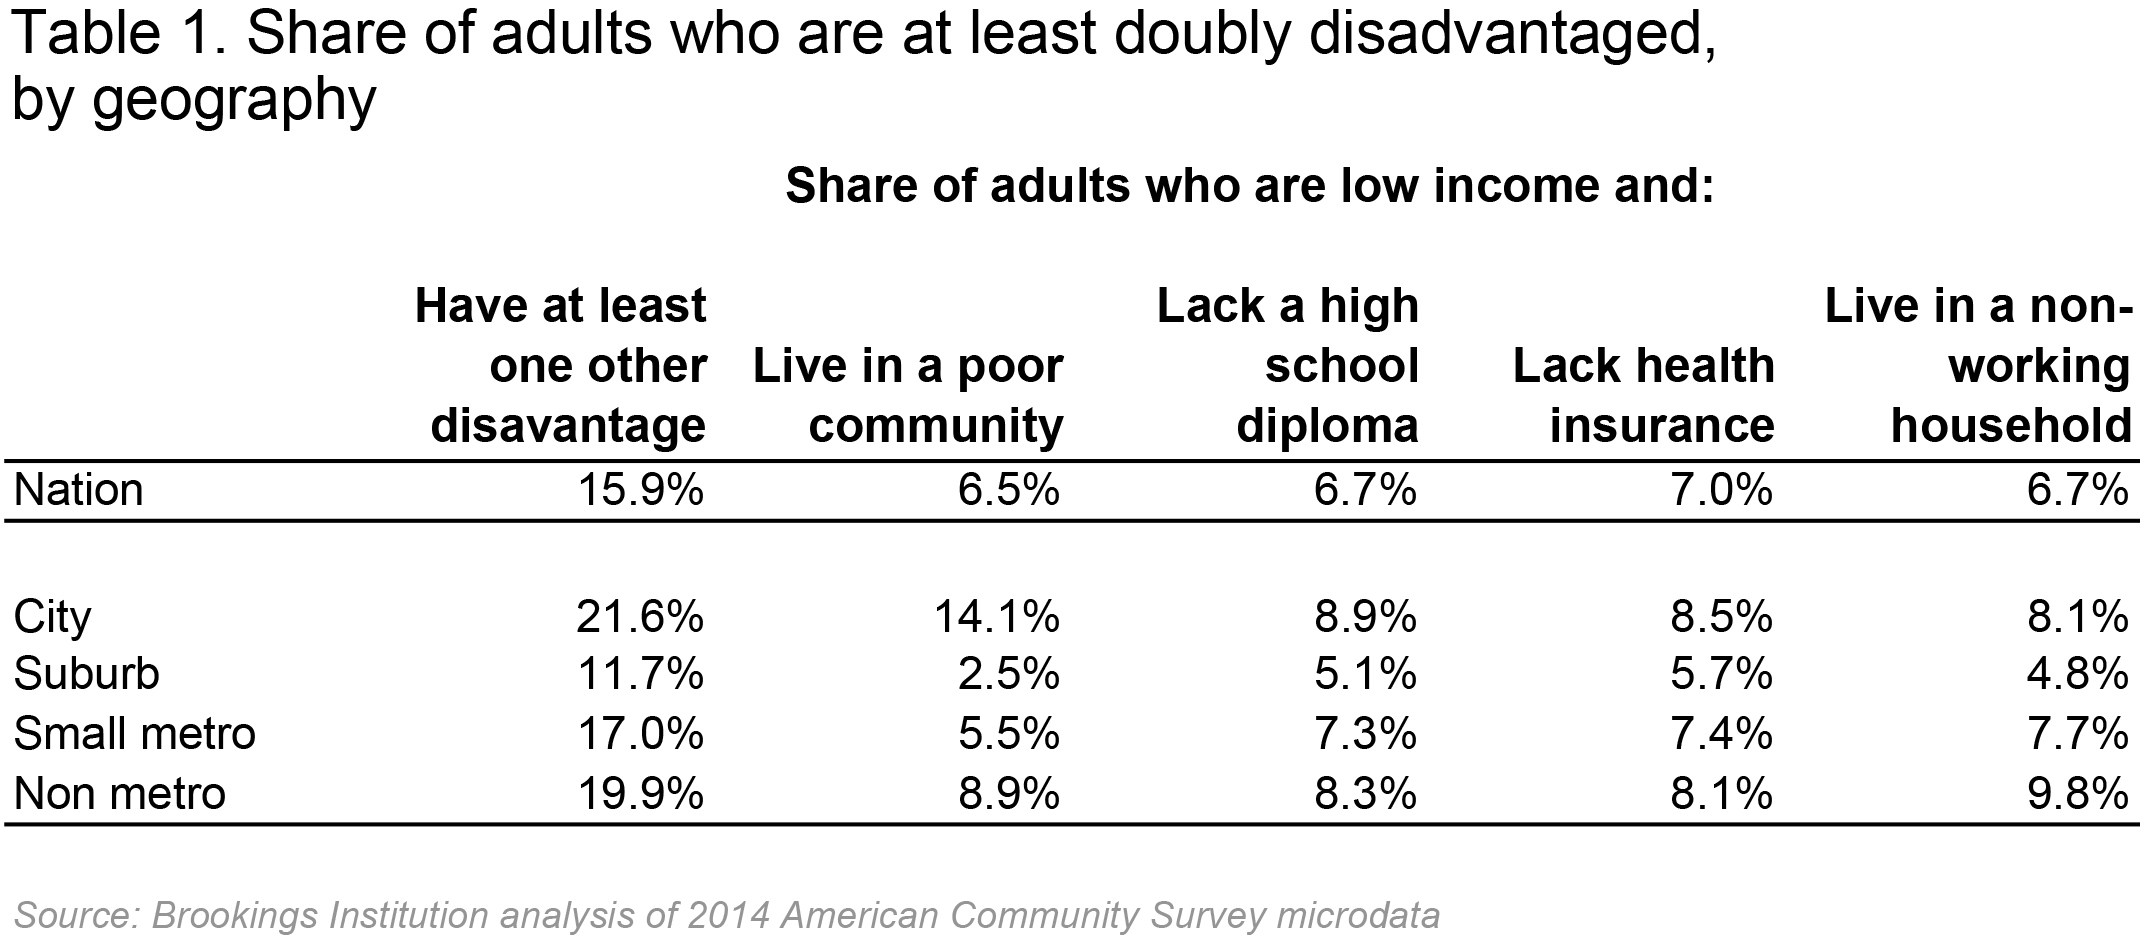
Low-income city residents are much more likely to be disadvantaged by living in a poor community. That’s the least likely disadvantage in suburbs and small metro areas (although recent evidence shows concentrated disadvantaged is a fast-growing challenge in those communities). Instead, low-income suburban residents are more likely to struggle with lack of health insurance. For low-income residents in small metro and rural areas, lack of employment is more likely to be the additional burden borne by those facing multiple disadvantages.
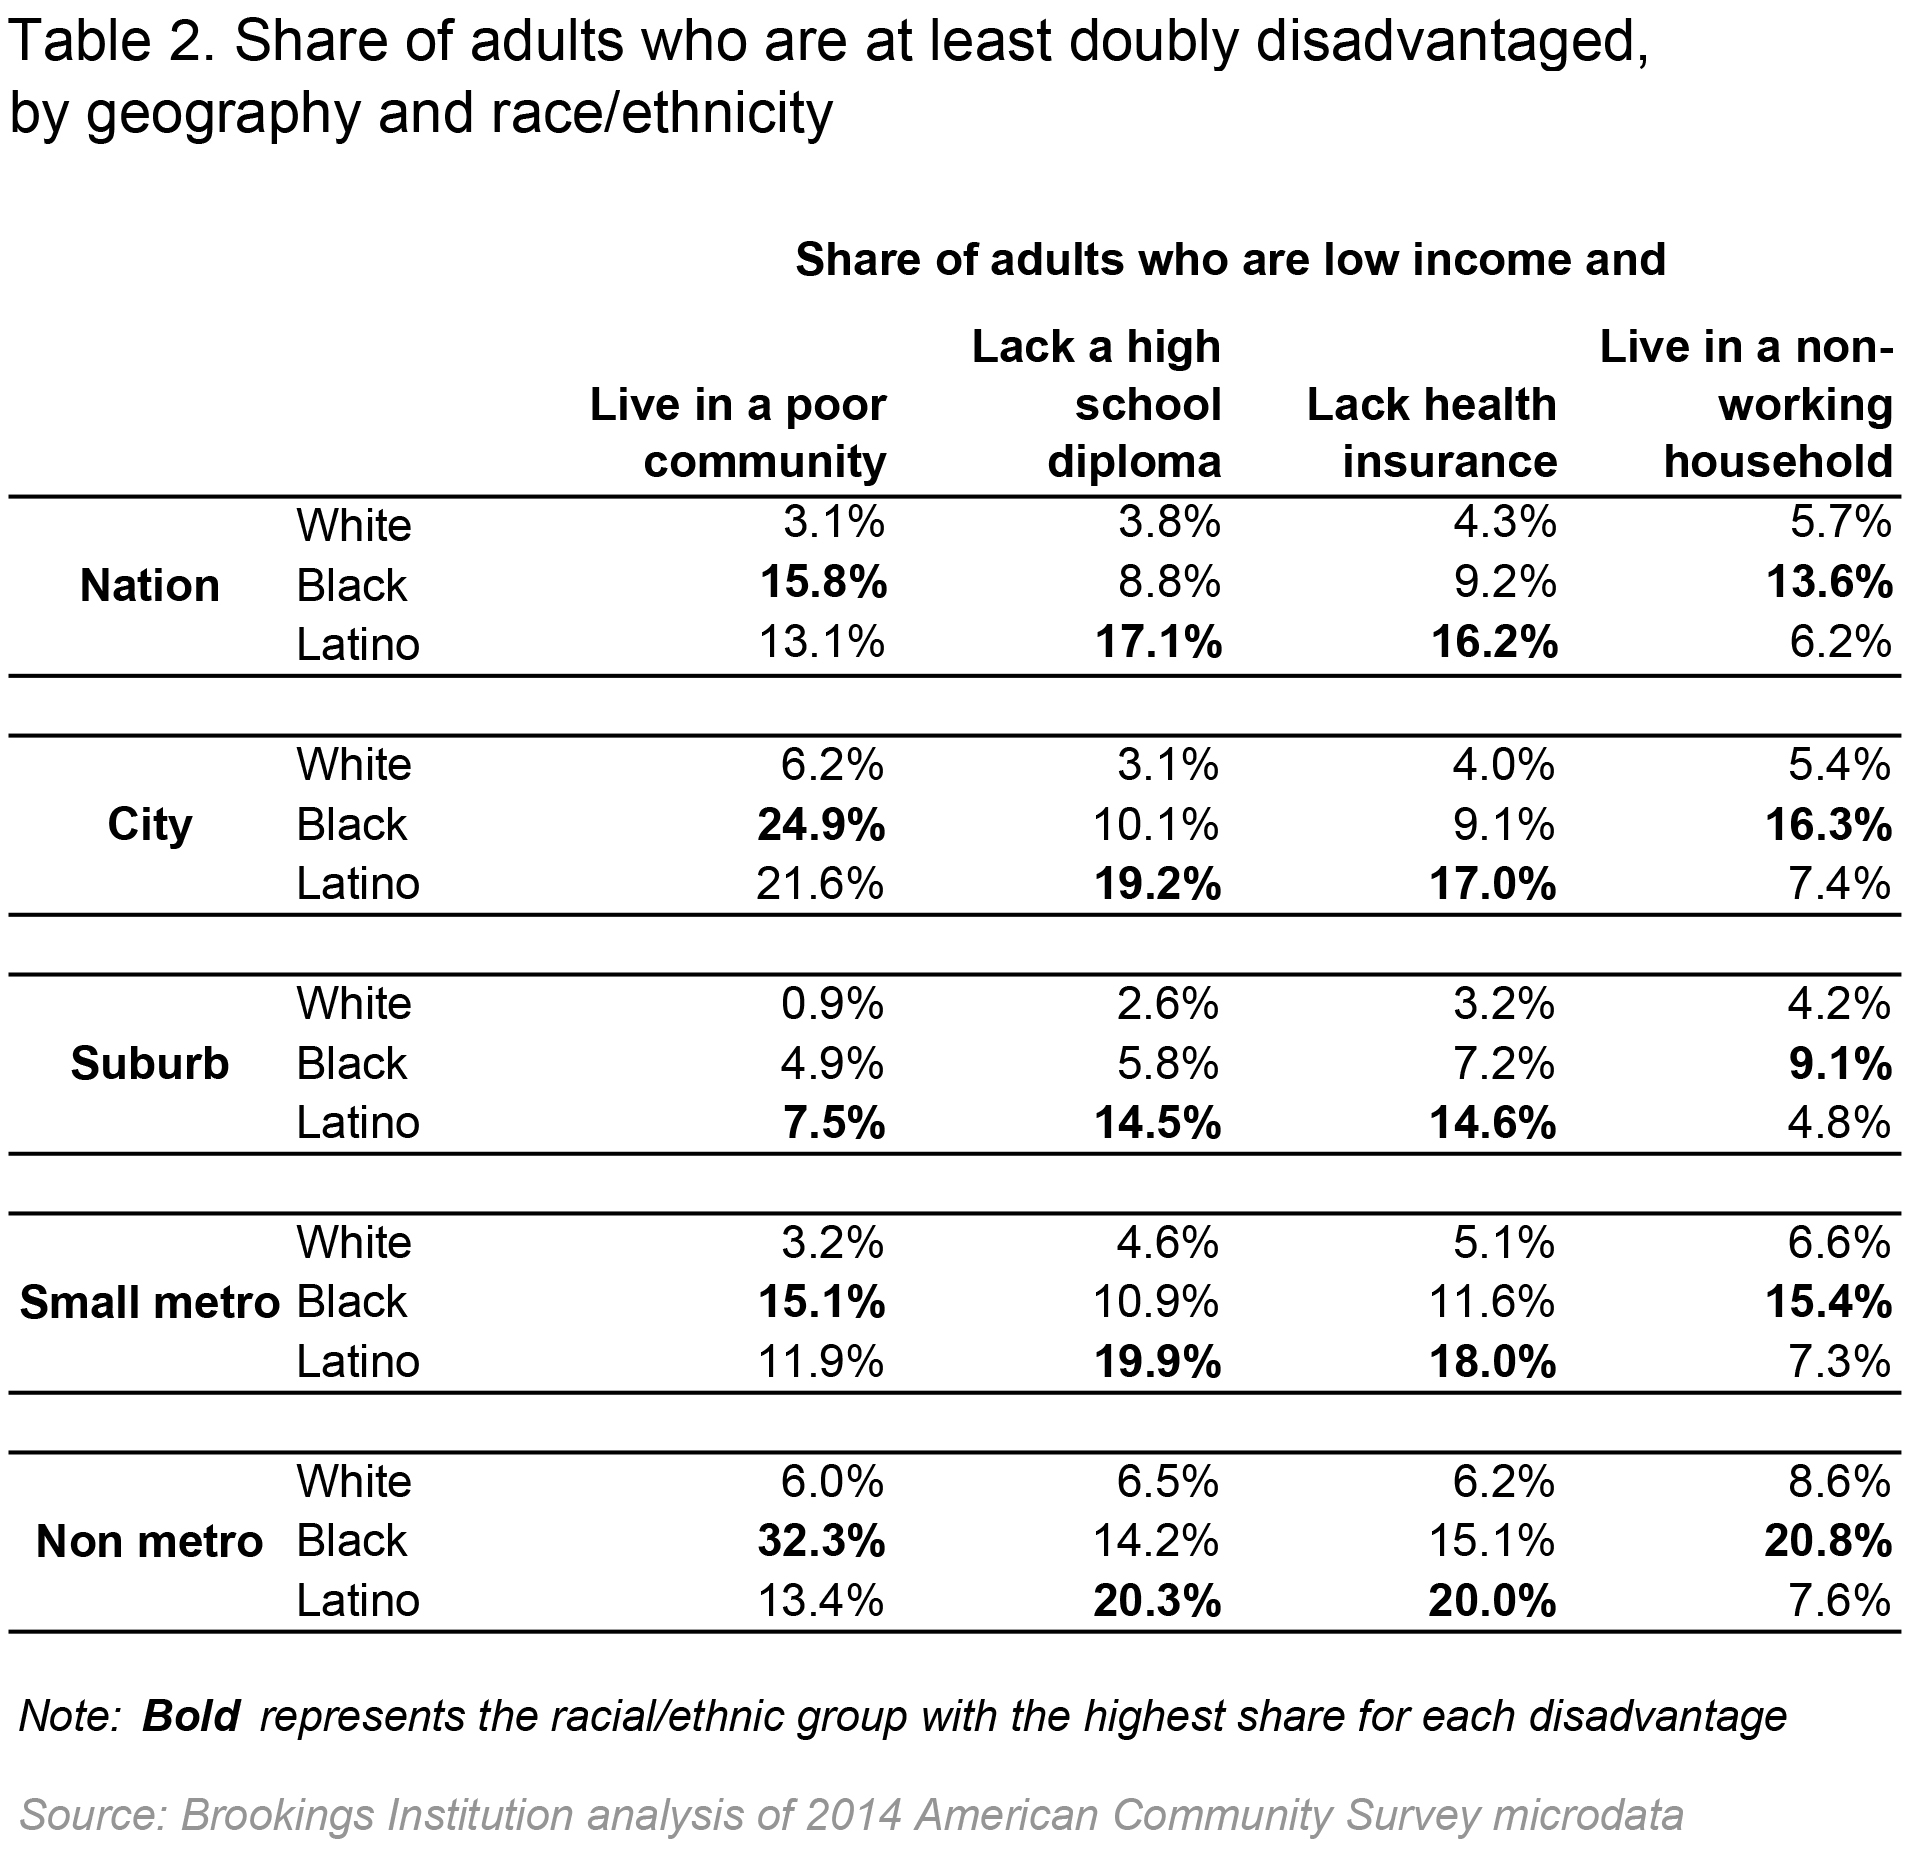
Greater variations emerge within places across races and ethnicities. City residents, regardless of race, are most likely to be additionally disadvantaged by living in a poor area, but the shares for blacks and Hispanics are roughly quadruple that for whites. Lack of employment is the leading disadvantage for low-income whites outside of big cities and for low-income blacks in suburbs and small metro areas. In rural communities, however, by far the biggest additional disadvantage experienced by low-income blacks is living in a poor community. For low-income Hispanics outside of big cities, limited education and lack of health insurance are the most prevalent additional challenges.
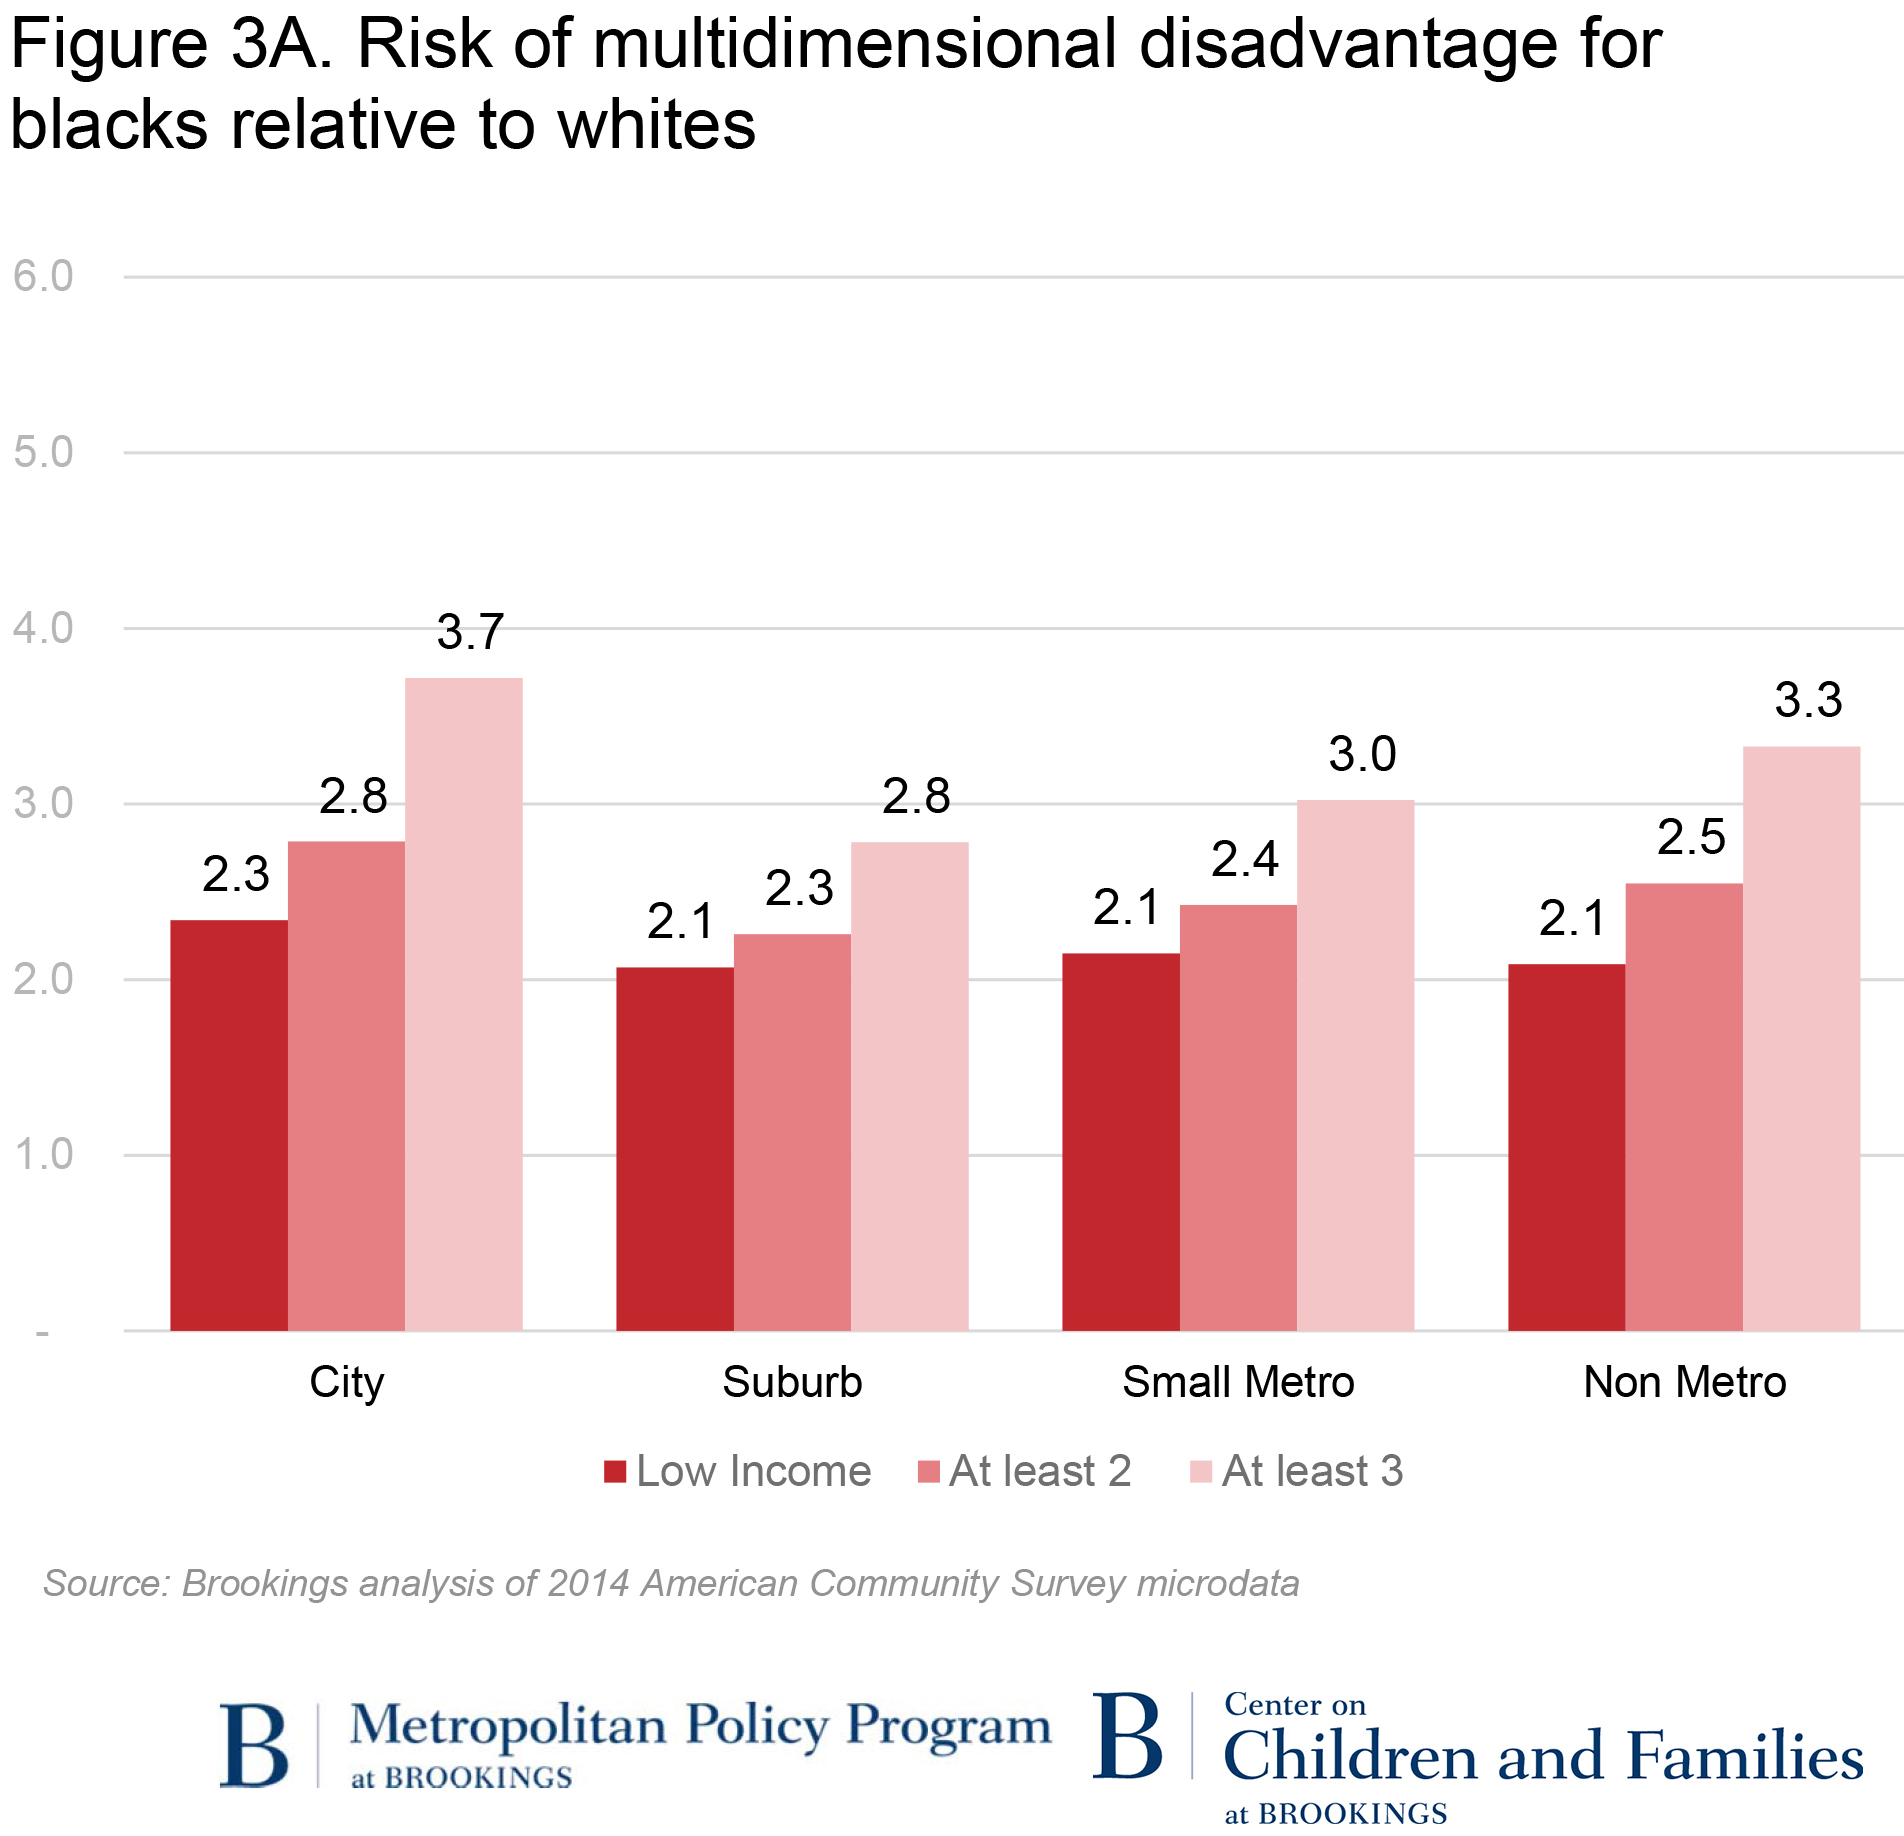
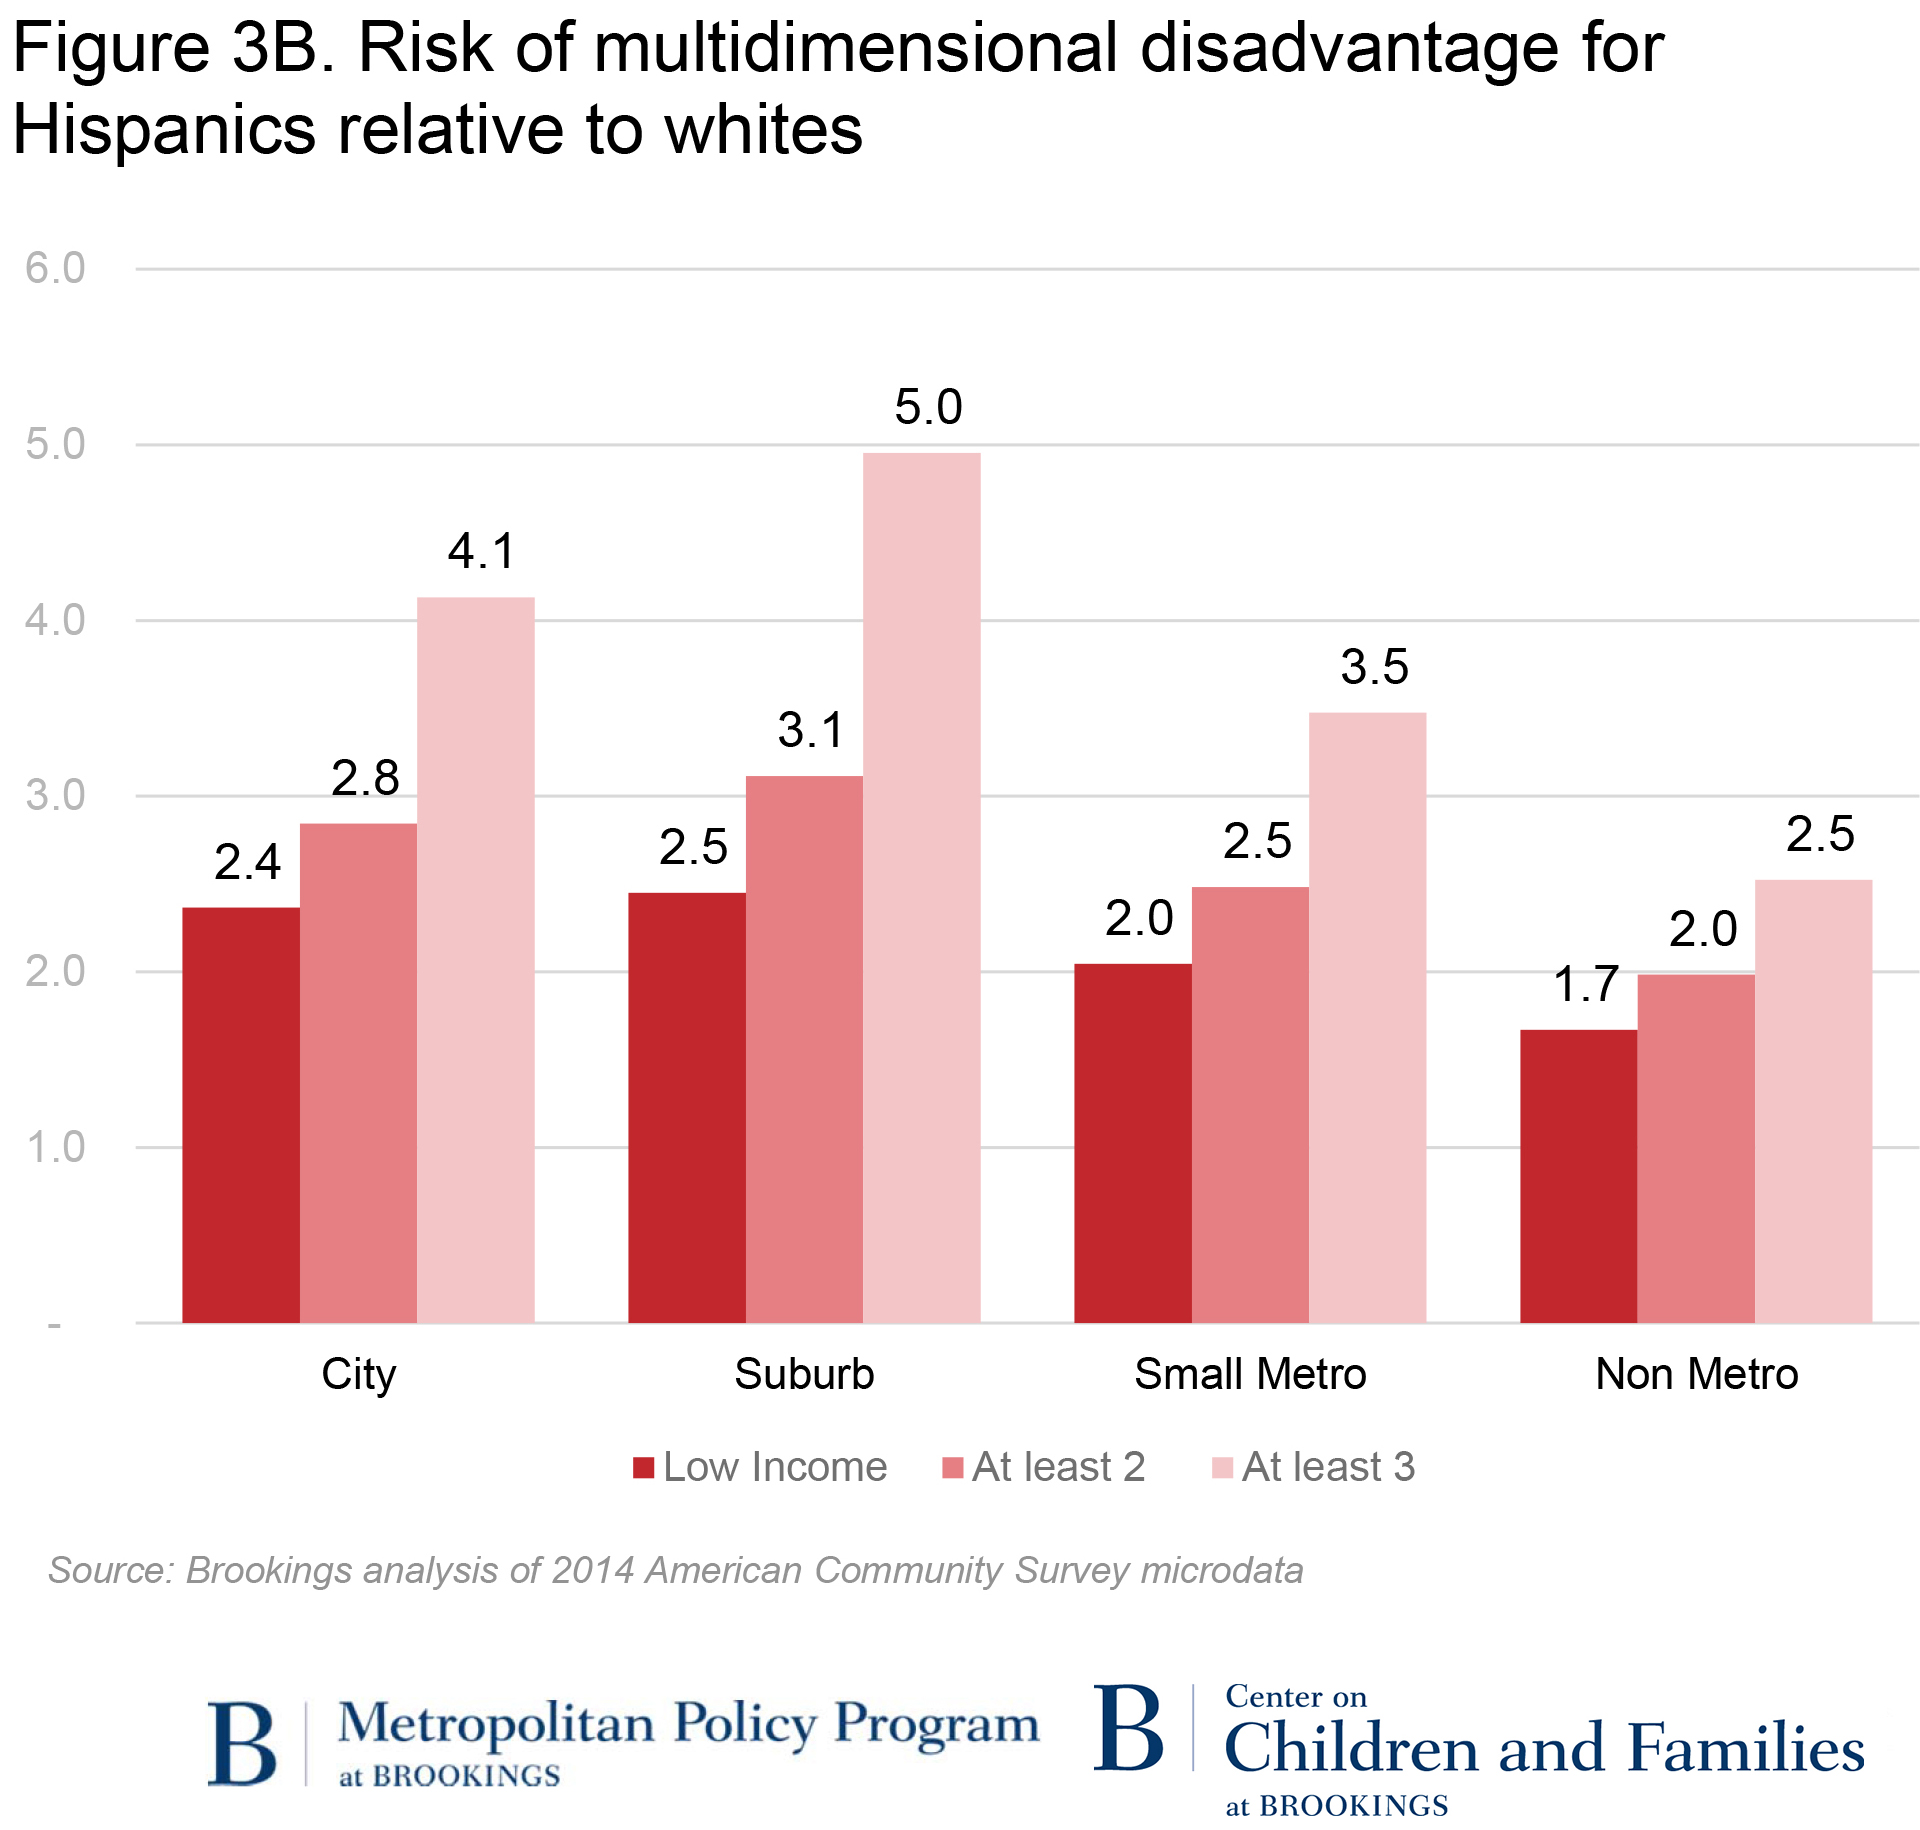
Once again, the risk of facing more than one disadvantage is much greater for blacks and Hispanics compared to whites, and the gap only grows as the number of disadvantages increases. However, the magnitude of that gap depends on the type of community. For African Americans, the deepest disparities exist in cities, where they are more than twice as likely as whites to be low-income and nearly four times as likely to face at least three disadvantages. But for Hispanics, the gaps are starkest in suburbs, where they are two-and-one-half times as likely as whites to be low-income and fully five times as likely to experience three or more disadvantages.
The makeup of the multidimensional poor population changes markedly from urban to rural communities.
While cities and rural areas exhibit the highest rates of multidimensional disadvantage, the largest number of adults who are at least doubly disadvantaged live in the nation’s suburbs. Of the more than 24 million people who are low income and face at least one other disadvantage, more than one-third (8.3 million) are suburban residents (Figure 4). The geographic balance shifts somewhat as additional disadvantages are layered on, with cities overtaking suburbs for the number of adults living with three or more disadvantages.
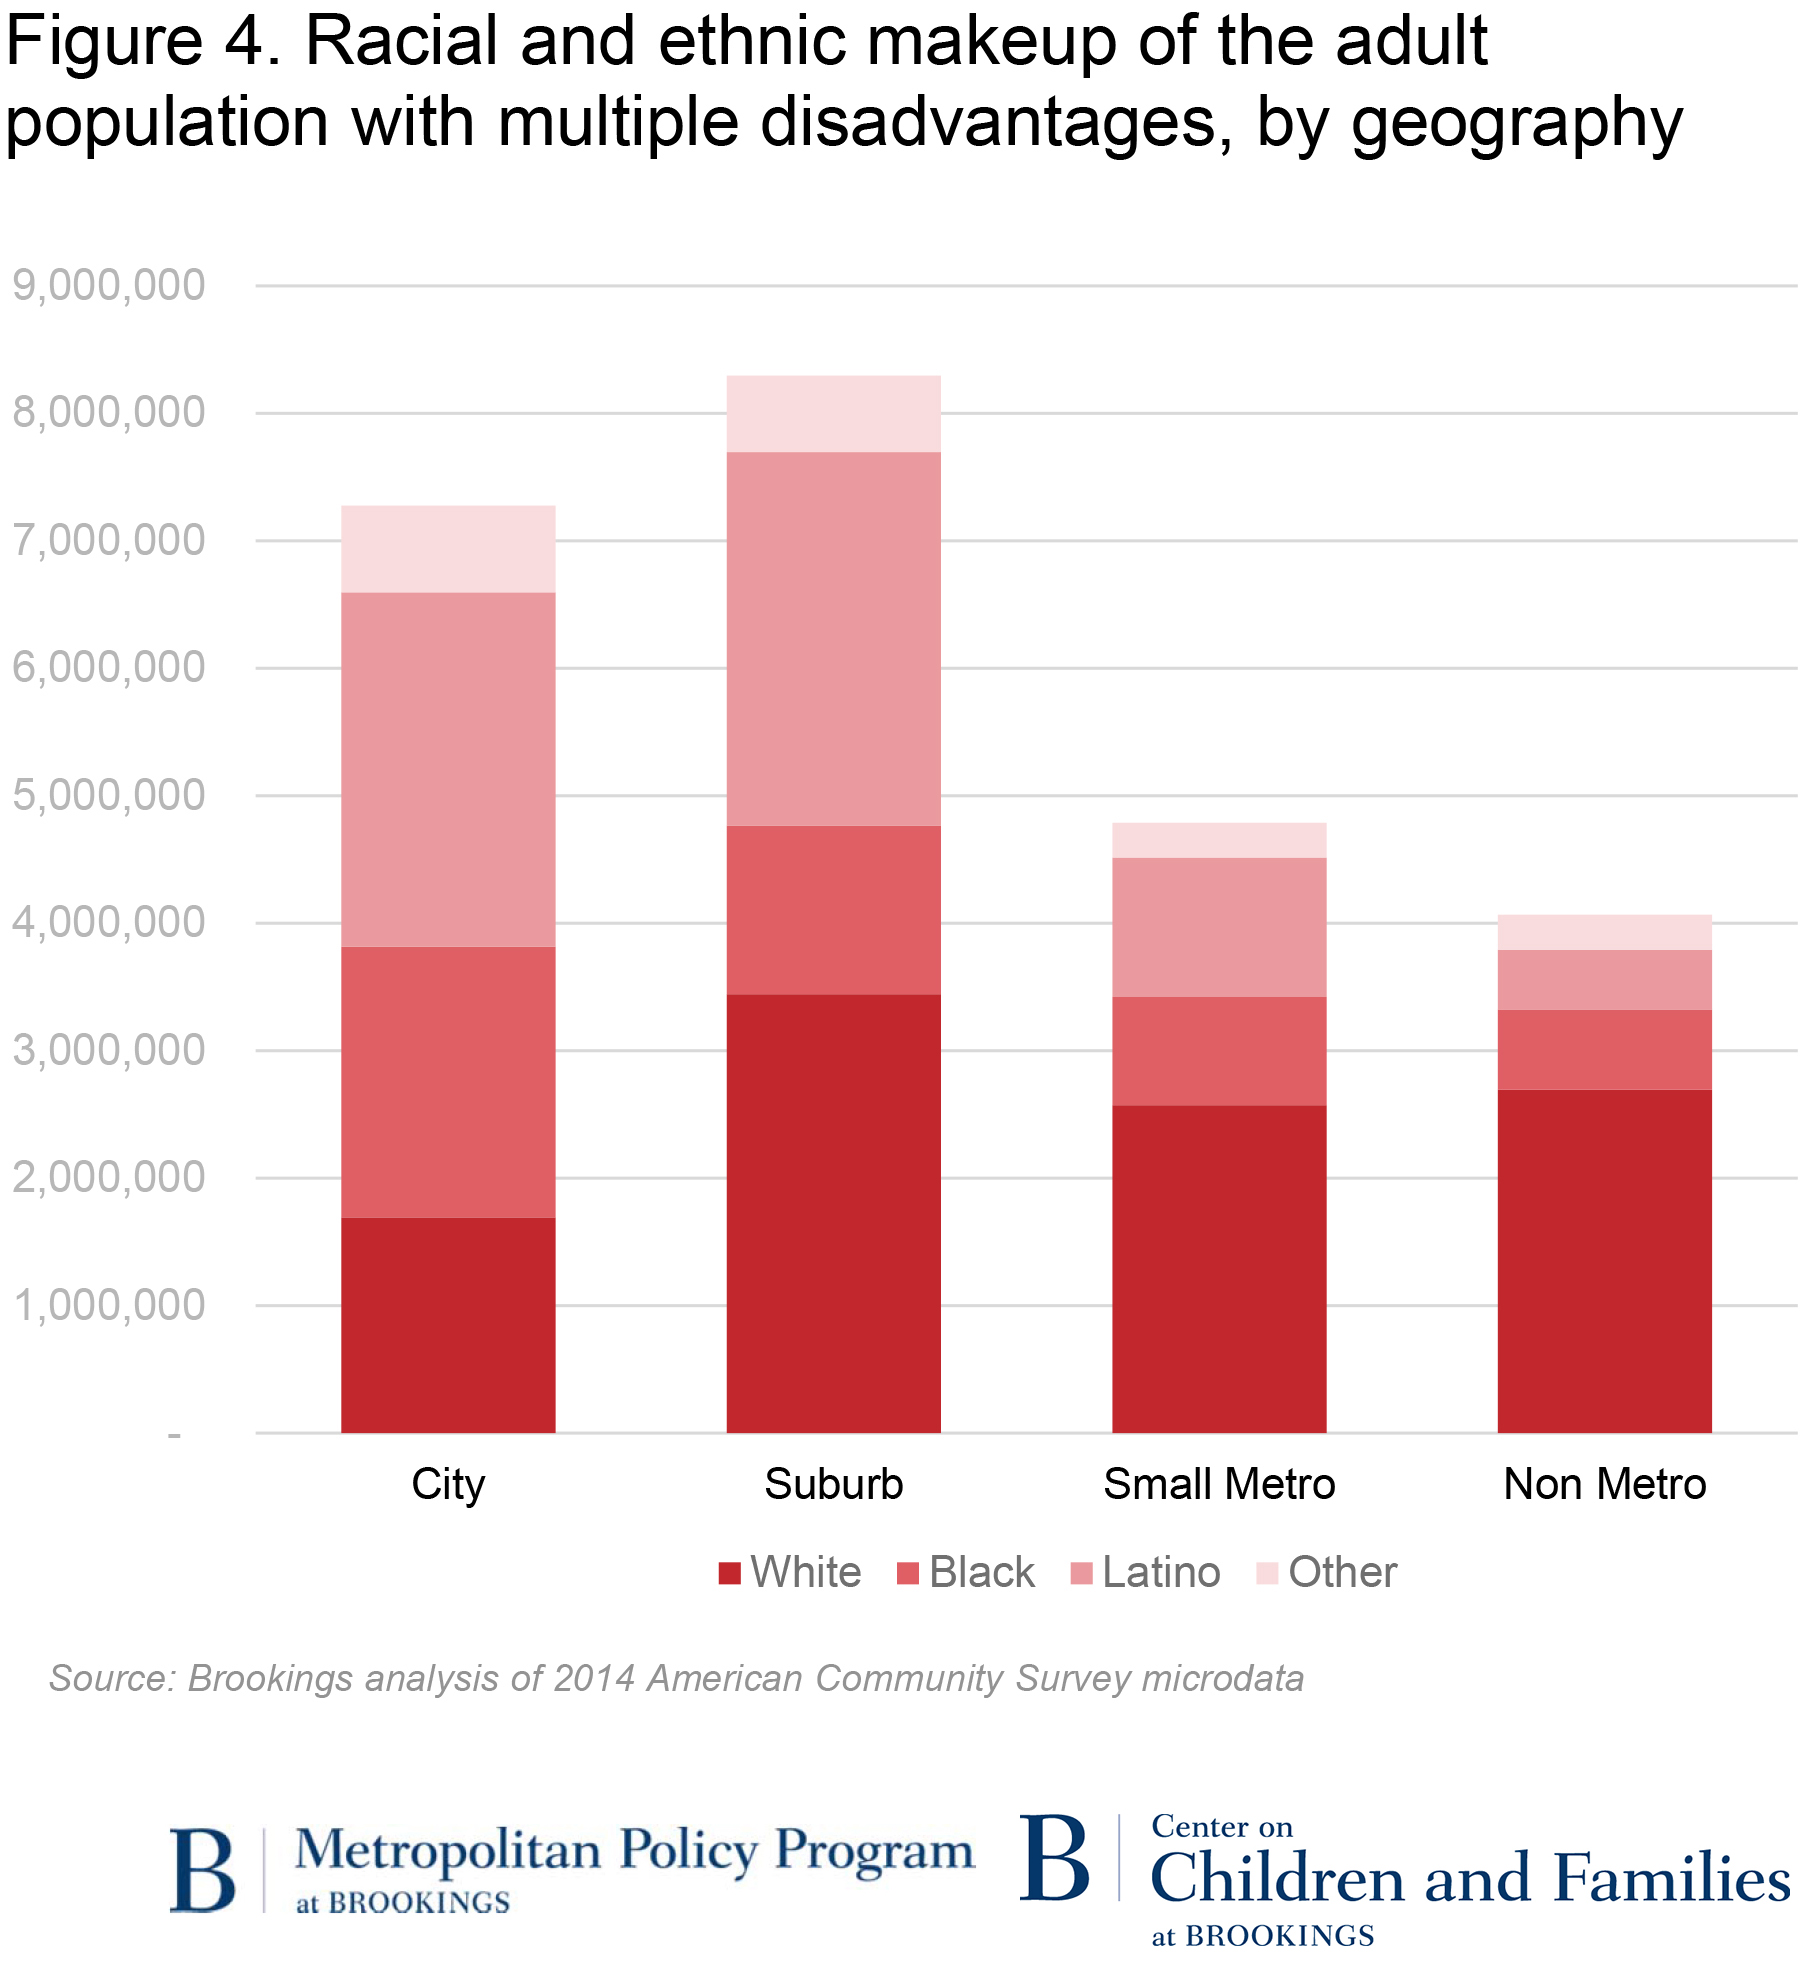
What is more, the makeup of the disadvantaged population varies considerably depending on the type of community. Nationally, half of the population who is at least doubly disadvantaged is white, 18 percent is black, and 23 percent is Hispanic. But looking beneath the national average reveals that the doubly-disadvantaged population skews whiter the less urbanized the place. In cities, the population that is at least doubly disadvantaged is only 23 percent white. That share ticks up to 41 percent in suburbs, 54 percent in small metro areas, and reaches two-thirds in rural areas.
Not surprisingly, the balance shifts in the other direction for disadvantaged minorities. Hispanics makeup just 12 percent of the population that is at least doubly disadvantaged in rural communities but 38 percent of that population in big cities. African Americans comprise 29 percent of the multidimensional poor in cities compared to just 15 percent in rural areas.
Given the much higher propensity of blacks and Hispanics to experience more than two, three, or four disadvantages, the share of the disadvantaged population that is white declines in all geography types as additional disadvantages are layered on, and minority shares increase. For the population experiencing four or more disadvantages, just 14 percent in urban areas are white. However, whites continue to makeup more than half (55 percent) of rural residents living with at least four disadvantages.
Conclusion
A simple answer to the question of how to move people out of poverty is to increase their incomes. But putting people on a path to earning more often means addressing any number of barriers that have to be overcome before they can realize that goal. For some, the biggest barrier lies in bridging an education or skills gap to be competitive for better jobs, while others may lack the networks and wraparound supports that can help them find and keep a good job. Some struggle with a lack of a health safety net that could help keep a medical emergency from turning into an economic crisis, while for others the most pressing challenge is to find a way out of distressed neighborhood conditions and the drag they exert on upward mobility. For too many, finding a path out of poverty means confronting more than one of these barriers at the same time.
By adopting a measure that extends beyond a simple income-based definition of poverty, “Five evils” demonstrated that some groups of working-age adults are more likely to see certain types of disadvantages pile on top of each other than others. This analysis goes further to make clear that these disadvantages do not cluster evenly or in the same ways across different regions or types of communities, nor does the population struggling with multiple disadvantages look the same from place to place. Just as the barriers that low-income residents need to overcome (or the disadvantages that need to be “de-clustered”) will be different in different places and for different groups of people, policy responses must also be flexible and integrated enough to adapt to the diverse geography of multidimensional poverty.
A number of local, regional, state, and federal policies and interventions already exist to address these various dimensions of disadvantage in different ways, including efforts to boost wages through local minimum wage campaigns and outreach strategies to connect low-income workers to tax policies like the Earned Income Tax Credit; cradle-to-career education initiatives to build skills; work support programs that help people find and keep stable employment; health initiatives to close gaps in health outcomes; and place-based efforts to deconcentrate poverty. But the presence of such efforts is patchier in some communities than others and the extent to which these kinds of strategies coordinate across programmatic or policy silos to work effectively together varies widely.
A more nuanced and multidimensional assessment of the geography of disadvantage, like the one offered here, can help to inform and focus anti-poverty strategies within and across places. This kind of tool can help policymakers and practitioners assess not only whether the right combination of strategies is in place to de-cluster disadvantage, but also whether those resources are being integrated and deployed in a way that meets the most pressing needs of the different types of residents and communities most affected by multidimensional poverty.
1. The working-age adult population is defined as those aged 25 to 61. Adults in households with incomes below 150 percent of the federal poverty line are considered low income. A poor area is defined as a Public Use Microdata Area (PUMA) with a poverty rate of 20 percent or more. For more information on the methods, see “Five Evils.”
2. In this analysis, we use detailed data on individuals and households from the 2014 American Community Survey microdata. These data are compiled and released at the Public Use Microdata Area (PUMA) level. PUMAs are statistical entities built based on census tracts and counties and contain populations of at least 100,000. We use 2013 metropolitan statistical areas (MSA) definitions determined by the U.S. Office of Management and Budget and the U.S. Census Bureau. We assign PUMAs to metropolitan areas if at least half of the PUMA population falls within a given metro area. PUMAs in the top 100 metro areas are assigned to cities if more than half of the population in the PUMA falls within a primary city’s borders. A primary city is the first named-city in the official MSA name and any other city in the MSA title with a population of 100,000 or more. PUMAs in the top 100 metro areas not assigned to a city are considered suburban.
3. As in the previous paper, the population experiencing all five disadvantages is small enough that we do not break them out here.
Authors

The Brookings Institution is committed to quality, independence, and impact.
We are supported by a diverse array of funders. In line with our values and policies, each Brookings publication represents the sole views of its author(s).