Strong Growth and Changing Composition
External financial flows to sub-Saharan Africa (defined as the sum of gross private capital flows, official development assistance (ODA), and remittances to the region) have not only grown rapidly since 1990, but their composition has also changed significantly. The volume of external flows to the region increased from $20 billion in 1990 to above $120 billion in 2012. Most of this increase in external flows to sub-Saharan Africa can be attributed to the increase in private capital flows and the growth of remittances, especially since 2005 (see Figure 1).
Figure 1. Sub-Saharan Africa: External Flows (1990-2012, in USD billions)
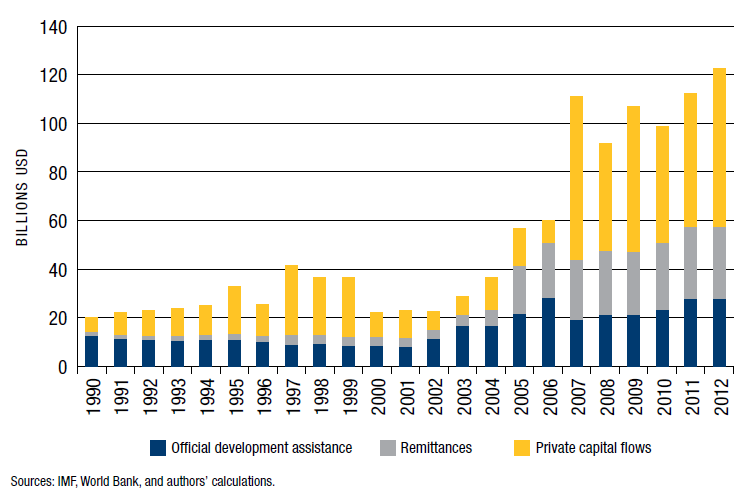
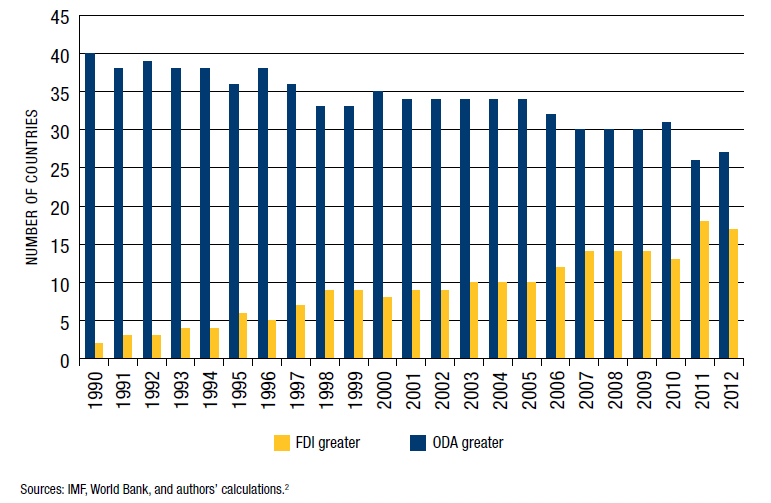
As also displayed in Figure 1, in 1990 the composition of external flows to sub-Saharan Africa was about 62 percent ODA, 31 percent gross inflows from the private sector, and about 7 percent remittances. However, by 2012, ODA accounted for about 22 percent of external flows to Africa, a share comparable to that of remittances (24 percent) and less than half the share of gross private capital flows (54 percent). Also notably, in 1990, FDI flows were greater than ODA flows in only two countries (Liberia and Nigeria) in sub-Saharan Africa excluding South Africa, but 22 years later, 17 countries received more FDI than ODA in 2012—suggesting that sub-Saharan African countries are increasingly becoming less aid dependent (see Figure 2).
Figure 2. Sub-Saharan Africa: Number of Countries Where FDI is Greater than ODA (1990-2012)
But to what extent have these changes in the scale and composition of external flows to sub-Saharan Africa equally benefited countries in the region? Did the rising tide lift all boats? Is aid really dying? Are all countries attracting private capital flows and benefiting from remittances to the same degree? Finally, how does external finance compare with domestic finance?
The False Demise of ODA
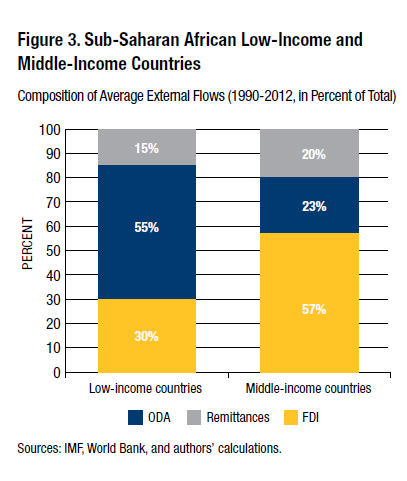
A closer look at the data indicates that, clearly, ODA is not dead, though its role is changing. For instance, middle-income countries (MICs) are experiencing the sharpest decline in ODA as a share of total external flows to the region, while aid flows account for more than half of external flows in fragile as well as low-income countries (LICs) and resource-poor landlocked countries (see Figure 3 and Appendix).
Authors