

Over the last few decades, family formation patterns have altered significantly in the U.S., with long-run rises in non-marital births, cohabitation, and single parenthood – although in recent years many of these trends have leveled out.
Importantly, there are increasing class gaps here. Marriage rates have diverged by education level (a good proxy for both social class and permanent income). People with at least a BA are now more likely to get married and stay married compared to those with lower educational attainment. Back in the 1960s, marriage and divorce rates among these groups were nearly identical. As our colleague Isabel Sawhill has written, “family formation is a new fault line in the American class structure.”
In this paper we describe marriage patterns by income rather than education, with a particular focus on the middle class. We use our standard definition of the middle class as the middle 60 percent of the family income distribution. (To allow for comparisons between families of different sizes, we adjust for family size using the square-root method: for more details see the Technical Appendix below).
We find that marriage rates among the middle class have declined significantly over the past 40 years and have now fallen below those in the top income quintile. Seventy-five percent of children in middle–class families lived with two married parents in 2018, down from 86 percent in 1979.
This paper represents one of the first attempts that we know of to measure marriage rates among the middle class defined by income. The Wall Street Journal recently conducted a similar analysis.
The middle class are no longer the marriage leaders
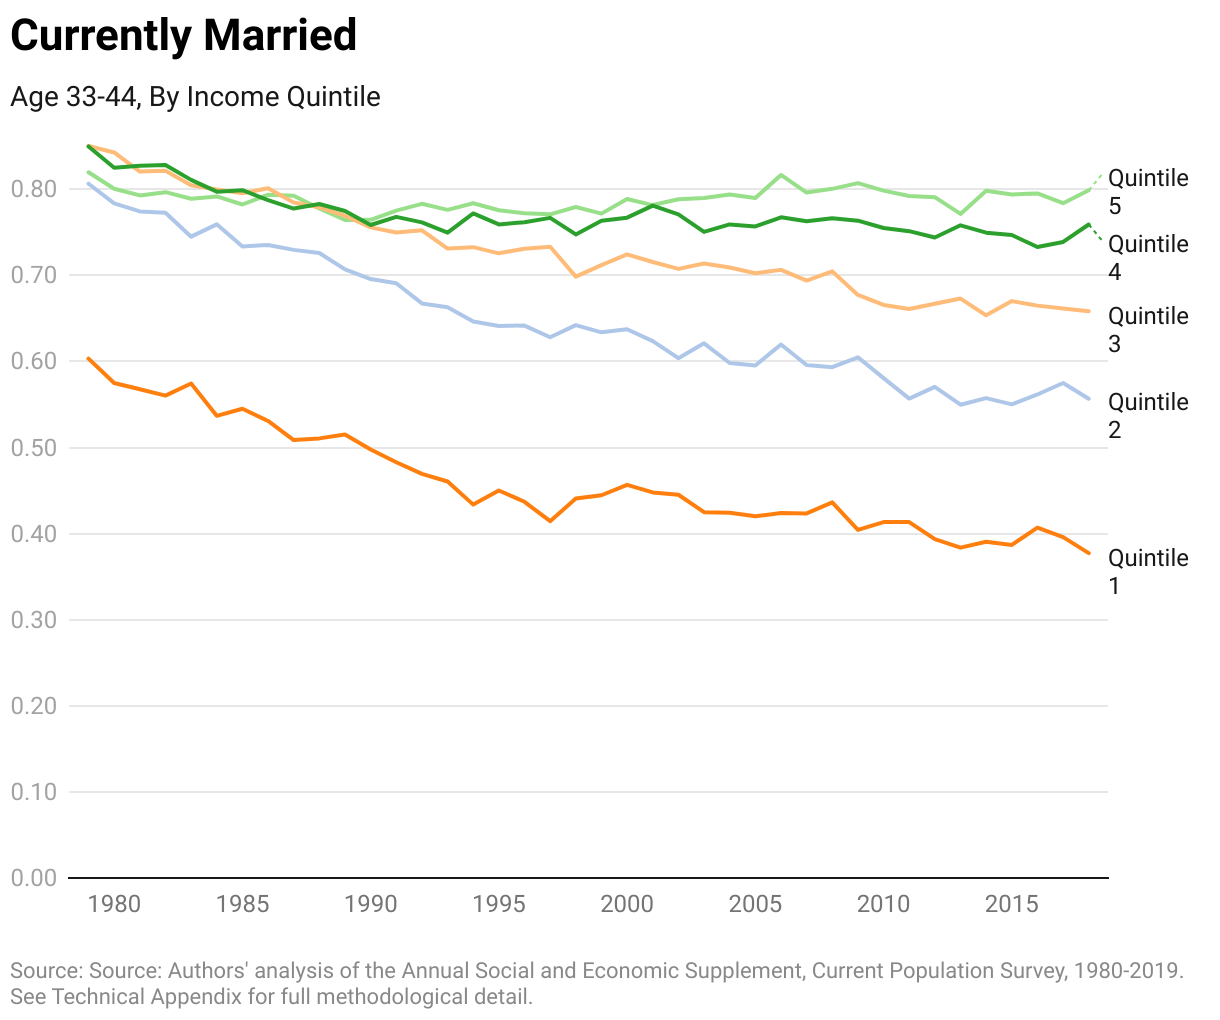
We focus first on adults between the ages of 33 and 44. (We have chosen this relatively high age range to lessen the risk that differences are being driven by differences in age at first marriage). How have marriage rates changed over time?
In 1979, the middle class and the “upper class,” here defined as the top quintile of income, had the highest proportion of currently-married individuals in this age bracket: 84 percent and 82 percent, respectively, followed by the “lower class”, the bottom income quintile, at 60 percent.
Since then, both the middle class and lower class have seen a steady decline in marriage, reaching 66 percent and 38 percent, respectively, by 2018. In contrast, marriage in the upper class has held relatively steady, dropping from 82 percent to 80 percent. The middle class, along with the affluent, used to have the highest marriage rates. Now, it is just the affluent.
This trend away from marriage in the middle class is primarily driven by the second- and third-income quintiles, as shown in the following figure. The currently-married rate in the second quintile, for example, has declined sharply from 81 percent to 56 percent:
This downward trend for the middle class holds within racial groups, though the magnitude changes. For example, among non-Hispanic whites, currently-married rates for the middle class show the same downward trend. In 1979, 85 percent were married; by 2018, that number dropped to just 72 percent. (Figures not shown).
Fewer middle-class children with married parents
Next, we take a child’s-eye view, calculating the odds that children in families with different incomes are currently living with married parents. The percentage of middle-class children currently living with two married parents has steadily declined over the past 40 years, from 86 percent to 75 percent:
Once again, this trend is primarily driven by the second and third quintiles. Three in five middle-class children in the second quintile currently live with married parents, down from 77 percent in 1979:
The rates for children in upper–class households by income are much more stable, and higher than for middle–class children. The rates for children on the lowest income rung are much lower: 35 percent in 2018.
Class gaps in cohabitation too, but smaller
It is hard to show that marriage itself impacts child well-being, because of potential selection effects. So we also report the percentage of middle-class children living with two parents, married or not. A similar but somewhat more muted trend presents itself. In 1979, 86 percent of middle-class children lived with two parents. By 2018, that number has dropped to 80 percent:
Here the widening of the gap is most marked for the second and third quintiles, which both show a downward trend. From 1979 to 2018, the percentage of children in the middle (third) income quintile living with two parents declined from 88 percent to 81 percent, for example:
Does marriage matter?
There are clear and uncontroversial reasons why two parents are better than one: time, money and energy, to name just three. And while there has been a decline in the chances of middle–class children having two parents in the household, the starker divide is in marriage rates.
Why might marriage matter, over and above cohabitation? One possibility is that marriage helps to maintain stability, which is correlated with family structure. On average, married–couple families experience the most stability, and for children, a stable family environment provides a solid foundation, while instability is linked to negative child outcomes, including problematic behavior, poorer social development, lower educational attainment, poorer cognitive development, and a wealth penalty in adulthood.
An increasing number of children, now 40 percent, are born to or later live with a cohabiting couple. Those born to a cohabiting couple, on average, will go through 1.4 family transitions by the age of 12. That’s almost triple the number of transitions children born to a married couple will go through by the same age (0.5). There are, however, huge differences between new parents who are cohabiting and those who are married, including age, education, employment, wages, and intendedness of the pregnancy – all of which are likely to weigh more heavily on outcomes than the fact of marriage itself.
This correlation between family instability and family structure is nonetheless important because there are growing socioeconomic divides in family formation. The decline of marriage among the poor, and more recently among the working class, has been well documented. For example, recent data show that marriage rates among the poor and working class are much lower compared to the middle and upper classes. But the decline is impacting middle–class families too, as our analysis shows. Stable families are no longer such a strong defining feature of the American middle class.
Why the growing marriage gap?
One potential explanation for the growing gap is that growing economic inequality and the decreased economic outlook for less-educated men has led to the retreat of marriage. Couples living in areas with greater income inequality are less likely to get married before having their first child. Declining male wages are associated with lower female marriage rates—suggesting some support for the hypothesis that there is a lack of “marriageable men.”
Others have argued that there is feedback mechanism between declining economic prospects for men and declining marriage. As labor demand decreases, men’s wages fall, thus making them less “marriageable.” Since they are less likely to get married, men decrease their labor supply, in part, because there is a lower chance that they will get married and need to support a family.
An alternative explanation, is that the growing class divide in family formation is driven by changing investments in children. Marriage, because it is costly to exit, serves as a commitment device for “high investment parents.”
And child investment varies by class. In theory, the rising returns to human capital should correspond to increased investment across the income distribution. But it appears that highly-educated parents are better equipped to ensure those investments pay-off. For example, mothers with at least a four-year college degree not only spend more time with their children, but also change their type of engagement to better suit the developmental needs of their child—creating not only a time gradient, but also a “developmental gradient.”
What can be done?
Changes in family structure and formation are driven by a host of economic and cultural shifts. Given the changes in social norms, a note of humility is needed among policymakers. When it comes to some of the most intimate decisions in a person’s life—how and when to form a family—it is important to be humble about the limits of public policy. Having said that, some policies can play a role to support family stability at the margin, including:
- access to long-acting reversible contraceptives (LARCs)
- skill attainment through investing in community colleges and apprenticeships
- availability of paid family leave
Progress on these fronts should help more people have children when they are ready, to accumulate the economic resources needed to form and maintain stable families, and to balance their paid work and caring responsibilities.
While middle-class marriage rates may never return to their previous levels, increasing the number of children who grow up in stable families could help to restore some of the ground lost in recent decades, by boosting mobility and well–being.
Technical Appendix
The data used for this paper is the Annual Social and Economic Supplement, more commonly referred to as the March Supplement, of the Current Population Survey, accessed through IPUMS at the University of Minnesota. Survey years (1980-2019) have been converted to calendar years (1979-2018).
IPUMS’ constructed family interrelationship variables are used to identify child-mother, child-father, and spousal links. We limit these pointer variables to the clearest direct links. This specification limits the possibility for false positives. The other familial links are coded as “no link.” The results are robust to using all pointer variables as coded by IPUMS.
Incomes are adjusted for inflation using the Personal Consumption Expenditures price index from the Bureau of Economic Analysis.
We rank by individuals. The income concept used is family income adjusted for family size using the square-root method—which divides family income by the square root of the number of family members in the household. Individuals who have negative personal income or their spouse/partner has negative personal income are dropped from the analysis. Children who have at least one parent in the household with negative personal income are also dropped from the analysis. Dropping observations with negative personal income is meant to avoid the issue of individuals claiming large business losses—people who may have low income temporarily but have high income normally or are asset-rich.
We also performed the analysis using a different income concept—the average personal income of the spouses/partners/parents. Results are similar across these two approaches, especially for the middle class, though sometimes higher for the bottom 20 percent and sometimes lower for the top 20 percent.
Quintiles are constructed based on the population in question in each year. For example, a graph showing currently married rates for 33- to 44-year-olds uses cross-sectional family income (adjusted for family size) quintiles among 33- to 44-year-olds for each year. Another example, a graph showing the percentage of children living with two married parents uses cross-sectional family income (adjusted for family size) quintiles among children for each year.
These quintile choices are used for clarity. With these specifications, there is an equal number of the population in question for each quintile—an equal number of 33- to 44-year-olds or an equal number of children, for example. Under the separate specification of using the overall population’s family income distribution to assign quintiles, one cannot immediately tell how many cases from the population in question are in each quintile. For example, when ranking by the overall population’s family income, it is not immediately known how many 33- to 44-year-olds or children are in each quintile, for example.
Related Content


Authors

The Brookings Institution is committed to quality, independence, and impact.
We are supported by a diverse array of funders. In line with our values and policies, each Brookings publication represents the sole views of its author(s).