


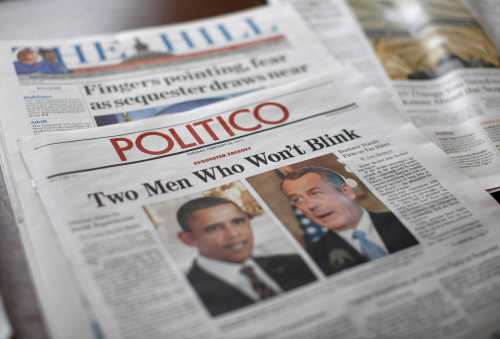
While political leaders remain tied up in discussions of government shutdowns and debt ceiling increases, we focus on the medium- and long-term budget outlook, where more serious challenges lie. With the passage of the American Taxpayer Relief Act, the imposition of the sequester, and changes in health care cost projections, some observers are claiming that fiscal issues have been resolved. The release of several new reports provides an opportunity to re-examine these issues. Our overarching conclusion is that, while the nation faces many other pressing economic and social issues, we are still far from attaining a sustainable fiscal policy.
I. Introduction
While political leaders remain tied up in discussions of government shutdowns and debt ceiling increases, this paper focuses on the medium- and long-term budget outlook, where more serious fiscal challenges lie. With the passage of the American Taxpayer Relief Act of 2012 (in early January, 2013), the imposition of the sequester, and changes in health care cost projections, some observers are claiming that fiscal issues have been, essentially, resolved and that the nation should move on to other issues. The release of several new reports – including the Congressional Budget Office’s Updated Budget Projections (May 2013), CBO’s long-term budget outlook (September 2013), long-term projections from the Trustees of Social Security and Medicare (May 2013) and BEA’s GDP revisions (July 2013) – provide an opportunity to re-examine these issues and to update our own estimates (most recently, Auerbach and Gale 2013) of the fiscal status of the country. Our overarching conclusion from this analysis is that, while the nation faces many other pressing economic and social issues – including boosting the strength and pace of the current recovery – we are still far from attaining a sustainable fiscal policy.
While we may not face an imminent budget crisis, the 10-year budget outlook remains tenuous. There is no “smoking gun” in the 10-year projections. Mainly, there is “just” an overall continuing imbalance between spending and taxes. Under current policy projections, revenue is not projected to collapse, as it did in 2009-12, but rather to grow to higher-than-historical-average levels. Likewise, spending isn’t spiraling out of control—it is projected at about the same share of GDP in 2023 as it was in 2013, as large cuts in discretionary spending are offset by increases in mandatory spending and net interest rising to historically high levels. Nevertheless, the budget situation is hardly optimal.
Even if seemingly everything goes right – with respect to keeping the fiscal house in order – we still face the prospect of a high and rising debt-GDP ratio by the end of the next decade. For example, under the current policy baseline, even if:
- Revenues average 17.9 percent of GDP as projected from 2015 through 2023 and revenues from the personal income tax rise steadily to 9.4 percent of GDP in 2023 (a figured exceeded only once in U.S. history);
- There are no new wars; defense spending falls to its lowest share of the economy since before WWII;
- There are no new spending programs; non-defense discretionary spending falls to its lowest share of the economy since before separate records were kept starting in 1962;
- Significant reductions in projected health care cost growth occur as projected; and
- The economy returns to full employment in 2017 as projected and remains there without recession through 2023;
Nevertheless, the implications of those favorable trends (under the current policy baseline) would be that:
- Net interest payments will rise from 1.3 percent of GDP in 2013 to 3.1 percent in 2023, which is close to the highest ratio of interest to GDP in history (3.2 percent in 1991) and a sign of approaching fiscal unsustainability;
- The full-employment deficit would reach 3.5 percent of GDP in 2022 and 3.4 percent of GDP in 2023; (other than in the 2009-12 period, these would be the largest full-employment deficits except for four of the past 50 years);
- The debt/GDP ratio would be 72 percent by 2023. The ratio would be more than 20 percentage points higher in every year during the next decade than it was for any year between 1957 and 2007, and it would be double the 36 percent level it averaged during the 1957-2007 period and the 35 percent level it attained in 2007.
And, of course, the fiscal problems worsen after the following 10 years. Under current policy, and under the most optimistic of the health care spending scenarios we employ, the debt/GDP ratio will rise to 100 percent in 2034, continue to rise to 200 percent by 2057 and then continue to increase after that. All told, to keep the 2040 debt-GDP ratio at just over 70 percent, its current value, would require immediate and permanent policy adjustments – reductions in spending or increases in taxes – of 1.5-1.8 percent of GDP. To keep the ratio at its current level through 2089 would require adjustments of 3.0-4.6 percent of GDP. If policy makers wanted to return the debt/GDP ratio to its historical average of about 36 percent, the required policy adjustments would be even larger.
Related Content

Related Books
The Brookings Institution is committed to quality, independence, and impact.
We are supported by a diverse array of funders. In line with our values and policies, each Brookings publication represents the sole views of its author(s).