After negative and slow growth in the late 1980s and early 1990s, South Africa’s triumphant transition to a democratic and more inclusive society in 1994 saw the economy once again begin to grow steadily. This renewed growth was supported by strong macroeconomic management and effective institutions. Since then, the South African economy has grown at an annual real average of 3.19 percent. Accompanying this growth performance were significant welfare gains seen in the rise of access to social services, housing, and basic infrastructure, as well as a moderate reduction in extreme poverty (Bhorat et al. 2015b). One of the factors preventing greater development and welfare improvements is that economic growth has come with considerable variation, evident in Figure 1.
Figure 1: Real GDP and annual GDP growth (1990-2013)
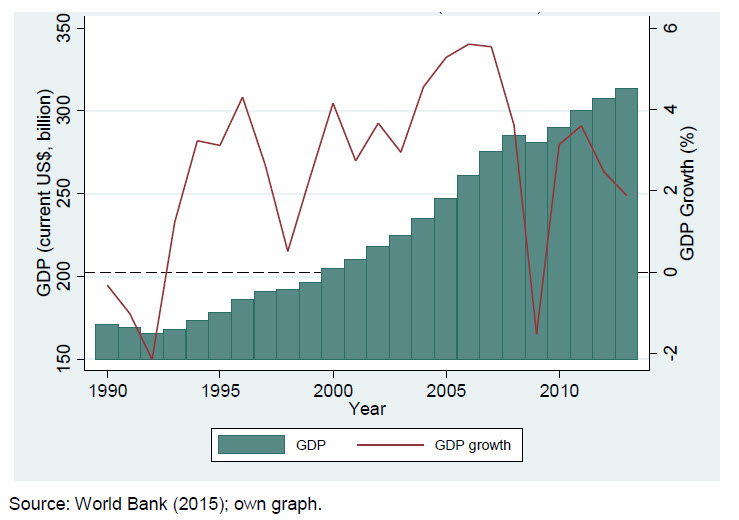
In the five years immediately after democracy, growth averaged 2.76 percent, rising to 3.17 percent in the following five years (Table 1). The period of fastest economic growth was between 2004 and 2008, where real GDP expanded at an annualized average rate of almost 5 percent. This period of relatively fast growth was then abruptly interrupted by the global financial crisis, which caused the South African economy to enter a brief recession in 2009.
Table 1: Real GDP and GDP per capita annual average growth rates (percent)
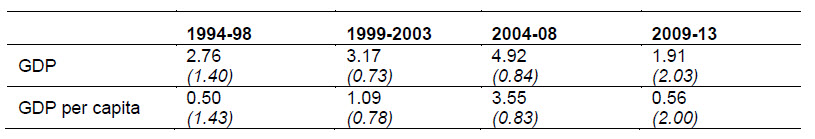
Notes: Standard deviations shown in parenthesis.
Source: World Bank (2015); own calculations.
National output subsequently rose to just over 3 percent in 2010, but has since weakened. Over the last five years therefore, GDP per capita has grown at an annual average of merely 0.56 percent. This weakening of the South African economy can ultimately be attributed to a combination of factors including slow global growth, industrial disputes, electricity shortages and concomitant price hikes, a lack of international competitiveness in manufacturing, and declining gold, platinum, and coal prices since 2012.
A brief analysis of the sectoral composition (Figure 2) at two points in time show that four sectors are expanding relatively faster than overall GDP: transport, storage, and communication; financial and business services; construction; and wholesale and retail trade. Transport, storage, and communication is now one and a half times the size it was in 1994, financial and business services have expanded by 42 percent over the period, and construction by 47 percent. The remaining five sectors have all declined in their share of GDP.
Figure 2: Sectoral composition of GDP[1] (1994, 2014)
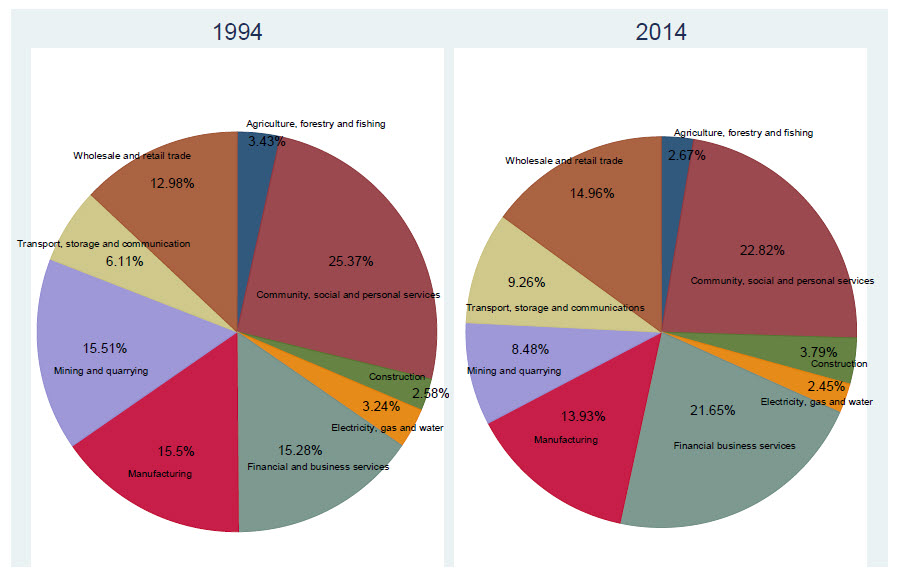
Source: South African Reserve Bank (2015); own graph.
The most marked change is that of the mining sector: from constituting up to 15.5 percent of GDP in 2014, it is now almost half that proportion at 8.5 percent. In addition, agriculture and manufacturing have also declined considerably in their shares of GDP, by 22 percent and 10 percent respectively. While the country has effectively transitioned away from its earlier reliance on the mining sector, mining remains an important contributor to economic activity. Most importantly, the sector generates more than half of the country’s foreign exchange revenue and its firms account for a quarter of the national stock exchange market capitalization (Chamber of Mines 2015). Thus, exports are heavily concentrated in natural resources, where gold and other mining products make up 44 percent of exports, a similar proportion to that of manufacturing (IDC 2013).
Based on the sectoral composition of GDP then, it is evident that South Africa has become a service-driven economy since 1994. The share of output contributed by wholesale and retail trade, transport, and communication—and most visibly—financial and business services, show increases over the first two decades of democracy in South Africa. The economy, it is fair to argue, has slip streamed onto an economic development trajectory, which is increasingly intensive in the provision of services. What is most starkly evident in this deepening output from services however, is the stagnation in manufacturing. Hence, we find that the manufacturing sector’s share of GDP has declined marginally since 1994 in South Africa. Since trade became more liberalized in the early 1990s, South Africa’s manufacturing sector has failed to compete in global manufacturing export markets. Increased import competition, and the level and volatility of the real exchange rate have been shown to be important drivers of South Africa’s manufacturing decline (Rodrik 2006). No country, to date, has managed to transition out of a middle-income to a high-income country status, without the dynamism of a vibrant, labour-intensive manufacturing industry. In the lexicon of post-apartheid South Africa, however, this notion of labour-intensive manufacturing as a driver of growth and jobs in the country is strikingly absent.
South Africa is classified as an upper-middle income country, with real GDP per capita currently at $5,916, up from $4,652 in 2000. The uneven and at times sluggish growth in average income levels, however, has meant a moderate decline in poverty, from 40 percent of the population in 1995, to 26 percent in 2013 using the World Bank’s 2 Dollar a day poverty line (Figure 3). With a current population of almost 53 million, this equates to about 13.7 million people living in poverty in South Africa. At perhaps the more appropriate national poverty line,[2] the poverty headcount ratio has increased from 31 percent in 1995 to a current level of 53.8 percent. This headcount ratio is calculated using the upper bound level of a newly rebased national poverty line, but even at the national lower bound headcount poverty rate of 37 percent, poverty has undoubtedly remained high.
Figure 3: Poverty headcount ratios over time (1995-2011)
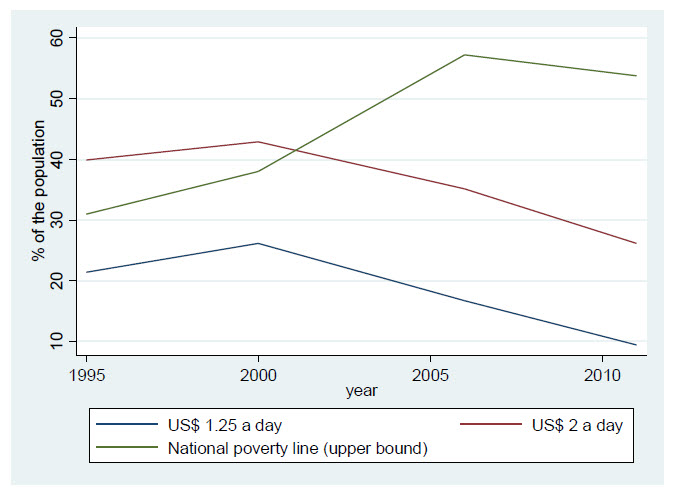
Note: 1. All poverty lines are measured on a PPP basis.
2. The South African National Poverty Line is measured at the lower bound at $3.50 a day and at the upper bound at $5.43 a day (StatsSA 2015). These poverty lines were recently rebased by StatsSA so that they are reflective of a current average basket of food and non-food consumption items. The 2011 poverty headcount rate at the lower bound is 37%.
Source: World Bank (2015); own graph.
Thus, while extreme poverty has declined, the trends on the national poverty line are more worrying. South Africa’s inability to translate growth into reducing poverty is not surprising given the extremely unequal nature of the society. With a Gini coefficient of 0.59, the exceptionally high level of income inequality is arguably the most important factor hindering the poverty reducing power of economic growth. [3] The exclusivity of South Africa’s growth path is only further emphasized by an unemployment rate of 25 percent, and one that has averaged 23.7 percent over the last two decades, with its lowest level at 17 percent in 1995.[4] South Africa is clearly in a labor market crisis, which in a low growth environment, serves only to reinforce further the unsustainably high level of income inequality.
Therefore, despite the optimistic outlook for the South African economy as the country transitioned to democracy in 1994, economic growth over the last two decades has been moderate. In addition, while the comprehensive social welfare system has succeeded in reducing inequalities in access to public services and housing, poverty has remained stagnant and inequality has remained exceptionally high—underpinned by one of the world’s consistently highest unemployment rates. Given this all too brief background to the economy’s growth record and the structure of this growth trajectory, the remainder of this paper focuses on demographic and labor market trends during the period, in order to understand better some of the factor market underpinnings of South Africa’s economic performance.
[1] In this figure and the rest of the paper, we use shortened names for the sectors. The sectors’ full names are as follows: agriculture, hunting, forestry, and fishing; mining and quarrying; manufacturing; electricity, gas, and water supply; construction; wholesale and retail trade; transport, storage, and communication; financial intermediation, insurance, real estate, and business services; community, social, and personal services; and private households, exterritorial organizations, representatives of foreign governments, and other activities not adequately defined.
[2] The national lower bound poverty line is equivalent to $3.50 (PPP) a day (StatsSA 2015). The national poverty line was updated in 2011 to make it more relevant to the current average basket of consumption goods.
[3] There is a rich literature on the linkages between growth, poverty, and inequality which includes Kanbur 2005; Kanbur and Squire 1999; Kakwani 1993; Datt and Ravallion 1992; Ravallion 1997, 2001. Whilst this is an important area in the macroeconomics of growth and development, it is not the focus of this paper.
Authors

The Brookings Institution is committed to quality, independence, and impact.
We are supported by a diverse array of funders. In line with our values and policies, each Brookings publication represents the sole views of its author(s).