


Executive Summary
The federal government released earnings data on U.S. colleges and universities for the first time last month. The new College Scorecard adds an important new dimension to previous government data collections on colleges and universities, which focused on inputs such as number of faculty and student characteristics and the immediate outcomes of retention and graduation rather than longer term outcomes including earnings in the labor market.
We examine the extent to which the Scorecard provides reliable and valid data, discuss whether it should be used by students and the general public to identify schools that provide the biggest bang for the buck, and identify actions that this or a future administration could take to improve the functions that Scorecard is intended to serve.
We identify five important limitations of the new Scorecard. First, the salary data are based only on students receiving federal student aid, and thus they potentially produce biased earnings averages by excluding significant numbers of students. Second, the salary data are credited to any institution a student attended with federal student aid, regardless of whether it was for a full degree program or only a single semester. Third, the salary data are not provided at the level of program of preparation, which is likely a much more important driver of salaries than the overall institution. Fourth, the salary data are strongly correlated with students’ background upon admission but this is not taken into account in the Scorecard. This is likely to lead users to believe that the association between a college and the salaries of those who attended is the valued added by that institution (bang for the buck) whereas it really reflects to a significant degree the academic preparation and family background of the students admitted. And finally, the lack of plans for stewardship of the Scorecard effort presents the risk that it will be a one-time effort.
We propose a simple path forward that solves the first three of these problems: adding two boxes to the 1098T form that the Internal Revenue System already collects from colleges and universities on all of their students who pay tuition, regardless of whether they receive federal aid. By collecting information on graduation status and major field of study on the 1098T, the federal government could easily produce earnings data for all students by program of study, and report that separately for graduates and non-completers. Importantly this could be accomplished without linking individually identifiable education data across agencies, which is crucial because creating a new data system of linked records might be construed as violating a Congressional ban on the executive branch creating a unit-record system of individually identifiable education records.
The 1098T with information on major and graduation status does not directly solve the challenges of identifying which programs provide the most bang for the buck. But with the 1098T-based data in hand, the federal government or other entities building college search sites using federal data could expand their current offerings of information by providing prospective students with comparisons of costs and outcomes among similar programs of preparation for students with backgrounds like theirs (e.g., using the rich set of economic characteristics in the tax data to create predictions).
The new College Scorecard is a wonderful idea. Relatively minor tweaks in current data collections and the pathways the information takes as it makes its way to the federal government can make the Scorecard truly useful.
Background
A month ago, President Obama announced to much fanfare the revised College Scorecard.
White House, September 12, 2015 — In this week’s address, the President announced the launch of a new College Scorecard, meant to help students and parents identify which schools provide the biggest bang for your buck. Designed with input from those who will use it most, the Scorecard offers reliable data on factors important to prospective students, such as how much graduates earn, and how much debt they have when they graduate.
The new Scorecard, accessible through the U.S. Department of Education’s main websitei, is a portal to the attainment and earnings records, aggregated to the institutional level, of college students receiving direct federal financial aid through individual grants and loansii. The most notable new feature in the Scorecard is a link between individual postsecondary institutions and the median income 10 years after entry of people who enrolled in the institution and received federal financial aid. Heightened earnings are not the only reason people seek college degrees; consumer satisfaction before and after graduation depends on more than just money. But earnings are an important outcome, especially as students and their families pay and borrow more for higher education.
There is no doubt that the Scorecard is a leap forward from previous government data collections on colleges and universities, which focused on inputs such as number of faculty and student characteristics and the immediate outcomes of retention and graduation rather than longer term outcomes including earnings in the labor market. But should advocates of transparency in higher education declare victory? To what extent does the Scorecard provide reliable and valid data? Should it be used by students and the general public to identify schools that provide the biggest bang for the buck? What actions might this or a future administration take to improve the functions that Scorecard is intended to serve?
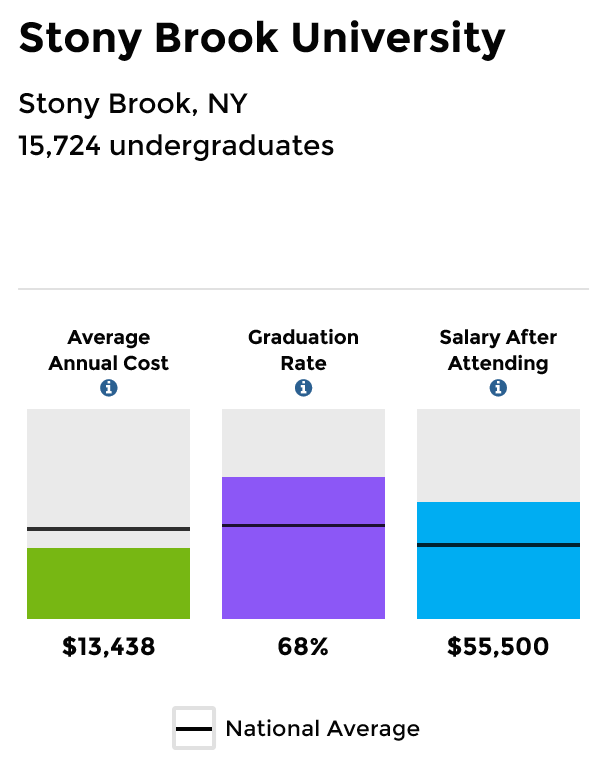
The example in the graphic, below, is the Scorecard page for Stony Brook University, where one of us (Whitehurst) was a member of the faculty for many years. In addition to that distinction, it shares many characteristics with other flagship-level public universities that in the aggregate serve a large segment of the college going population. Let’s look under the hood of the Scorecard using the information presented on Stony Brook as a case study.
Average Annual Cost in the figure is the tuition, fees, books, supplies, room, and board for in-state students at Stony Brook who receive federal financial aid, net of federal, state, and institutional grant aid to those students. In other words, the family of a typical student receiving federal financial aid at Stony Brook must come up with $13,438 out of their own resources each year, including loans, to attend.
Graduation Rate is the proportion of students who enrolled full time at Stony Brook in 2008 as first-time college students pursuing a bachelor’s degree who received their degree from Stony Brook within the next six years.
Salary After Attending is the median earned income of students who received federal aid at Stony Brook 10 years after entering Stony Brook.
The Average Annual Cost and Graduation Rate data for the Scorecard are pulled from an annual submission that colleges admitting students with federal aid are required to make to the National Center for Education Statistics (NCES) through the Integrated Postsecondary Education Data System (IPEDS). IPEDS does not collect data on individual students. Rather, institutions calculate Graduation Rate and Average Annual Cost from their own data using rules promulgated by NCES. Lacking data on individual students, IPEDS is unable to provide information on labor market outcomes for students. Nor can it address issues that often emerge with non-traditional postsecondary students, for instance those who attend several institutions before they graduate. Thus the IPEDS data with respect to Average Annual Cost and Graduation Rate are limited to first-time full-time students at a given institution, e.g., students who started at Stony Brook as first-time college students and succeeded or not at obtaining a degree from Stony Brook within six years.
The Scorecard data on Salary After Attending is derived from entirely different sources and managed by different offices in the U.S. Department of Education. It is obtained by linking three sources of data: information that prospective students provide when they complete the Department of Education’s FAFSA (Free Application for Federal Student Aid), including their social security number; information provided by institutions to the National Student Loan Data System (NSLDS), including the social security numbers of students receiving federal loans and grants who are enrolled; and earned income pulled from IRS tax records using the social security numbers that are obtained originally through FAFSA.
Scorecard flaws
The FAFSA and the NSLDS were designed to qualify students for grants and loans, in the case of the former, and to carry out monitoring and compliance functions with respect to federal student loans, in the case of the latter. These systems were not designed with the prospect that they would be used to track individual students into the labor market and tie their success to the institutions that prepared them. The system, which has been put together to meet the administration’s goal of helping students and parents identify schools provide the biggest bang for the buck, is a valiant effort but nonetheless a kludge with many data quality issues. Principal among them are:
-
- Salary data based only on students receiving federal student aid
In the 2013-2014 academic year, 60% of Stony Brook’s degree-seeking undergraduates had held a loan while at Stony Brook that would appear in the NSLDSiii. Pell grants were held by 32% of undergraduatesiv. There is substantial overlap between students who hold federal loans and those who hold Pell grants, although that information is not obtainable from publicly available reports. The National Postsecondary Student Aid Study estimates that 10% of undergraduates at 4-year public institutions hold a Pell grant but no other form of federal aid. Adding that percentage to the 60% who hold loans at Stony Brook results in an estimate that 70% of the student body is in the federal data systems used to produce the estimate of Earnings After Attending by virtue of having held a federal loan or a Pell grant. That means that 30% of Stony Brook undergraduates are invisible to the Scorecard. These students almost certainly come from higher-income families and likely earned more after leaving college than their classmates who used federal aid.
Students that receive federal grants and loans are surely different from those who do not, in both observable and unobservable ways. And the extent to which students are left out of the Scorecard data varies widely across institutions. For example, Adelphi University, a private college that competes with Stony Brook for students by virtue of its geographical proximity, has only about half the proportion of first-time full-time students receiving federal aid as Stony Brook. Thus it serves a more economically advantaged population, which isn’t surprising given that Adelphi’s tuition is roughly three times that of Stony Brook. Yet Adelphi’s Earnings After Attending estimate is about $5,000 less than Stony Brook’s. Could that be because about two-thirds of Adelphi’s students aren’t represented in the Scorecard, and these are the very students who are likely to be doing best in the postsecondary careers by virtue of their relatively affluent family backgrounds? Possibly. At the very least this means that families and students who intend to use the Scorecard to shop for a college based on how much students earn should be wary of the validity of the earnings estimates, particularly for students from families with the resources to send a student to a college without federal aid.
-
- Salary data credited to any institution a student attended with federal student aid
Traditional college students who begin and finish a baccalaureate degree at a single institution with more-or-less continuous enrollment are now a distinct minority of postsecondary students. For instance, in 2011-2012 51% of undergraduates were living independent of parental support and 41% attended exclusively part timev. Only about 60% of students entering public 4-year institutions receive a degree from the institution they entered within six yearsvi. Some students simply do not complete a degree whereas others transfer to another institution prior to graduating.
The salary entry for Stony Brook in the Scorecard includes every student in the cohorts being followed who had federal aid and touched Stony Brook as a student, even if only in passing. Stony Brook has a 21% transfer-out rate, i.e., students enrolled as first-time, full-time students who transferred to another school. Stony Brook gets the salary credit for these former students (as do the institutions that received them). Of the admitted class of 2013-2014, 37% transferred invii. Stony Brook gets the salary credit for these students (as do the institutions that sent them). Stony Brook has a six-year graduation rate for first-time, full-time undergraduates of 69%. It gets the salary credit for these graduates, as well as for the 31% who did not graduate, including the 11%viii. who did not make it past their freshman year.
There is more than one way to think about how to allocate credit to institutions for outcomes after graduation when students attend multiple institutions. But we think that the parents and students shopping for a college would want to have information on the salaries of those who graduated from a college reported separately from the salaries of those who attended the institution at some point but did not graduate from it. This is particularly important as potential students compare colleges with graduation and transfer rates that vary widely.
-
- Salary data not provided at the level of program of preparation
Salaries after graduation vary dramatically within institutions by major or program of preparation. For example, one estimate of the median mid-career salary for someone with an undergraduate degree in electrical engineering is $108,000, compared to $39,600 for someone with a degree in child and family studiesix. Stony Brook offers degrees in both fields. Of what value is it to students and parents shopping for schools that provide the biggest bang for the buck to learn from the Scorecard that the median salary 10 years after entering Stony Brook is $55,500? Within a broad swath of similar postsecondary institutions that particular parents and students might be considering, the choice of major will be far more important than the choice of institution. For instance, parents and prospective students thinking about attending Stony Brook might also be considering the other three research universities in the SUNY system (Albany, Buffalo, and Binghamton) because each offers low in-state tuition and the advantages thought by many to accrue to attendance at a doctoral-level institution. The Scorecard salary for Stony Brook differs by no more than about $5,000 from any one of these competitors, hardly enough to justify a choice among them for many potential students. It is also worth noting that institutions that don’t look particularly attractive based on the salaries of typical graduates may include particular programs of preparation that are associated with strong earnings after graduation. The bottom line is that the institutional-level salary reports in the Scorecard are going to be either unhelpful or misleading for large numbers of families and students.
-
- Salary data strongly correlated with family background
Implicit in the White House narrative about parents and students using the Scorecard to identify which schools provide the biggest bang for the buck is the assumption that the outputs, in this case salary after graduation, are independent of the inputs, e.g., family background, quality of the entering student’s academic preparation, traits and characteristics of entering students including intelligence, persistence, and so forth. A joke among those who think about these issues is that we know that Princeton is a great university, but is that because of the faculty or the admissions office? To the extent that salaries after attending (or other student outcomes associated with Princeton or any other institution) are due to selection of the student body, they cannot be used straightforwardly to index bang for the buck.
Considering only those students receiving federal grants and loans, there is a negative correlation of .56 between Salary After Attending as reported by the Scorecard for individual institutions and the proportion of students receiving federal aid at those institutions who ever had a Pell grant (calculation by the authors from the downloadable Scorecard data file). Pell grants are given to students with the lowest levels of financial resources and thus the proportion of Pell students is an index of the extent to which a college’s student body is financially poor.
The association is illustrated in the following graph. The higher the proportion of students with Pell grants an institution serves, the lower the Salary After Attending for that institution is likely to be.
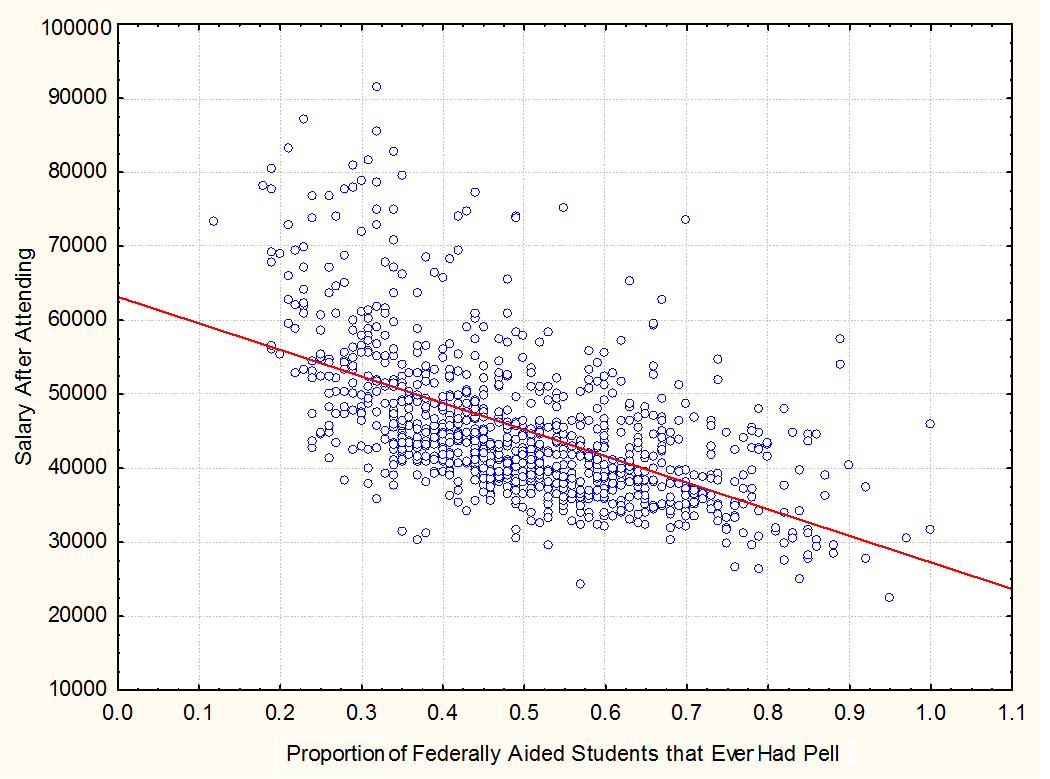
Institutions that fall towards the right end of the horizontal access are not necessarily providing less bang for the buck. But they are surely serving more disadvantaged students who have lower salaries later in life. Further, it is the vertical spread at any particular area on the horizontal axis that begins to get at bang for the buck. For example, two institutions in which about 0.9 of federally-aided students receive Pell grants, one with Earnings After Attending of $30,000 and the other with $55,000, are quite possibly different in the value each adds to the career prospects of their students. “Quite possibly” would move towards “Very probably” if the comparison were being made at the level of program of preparation.
For users of the Scorecard to think of the salary data as bang for the buck is to confuse correlation with causation in a dangerous way. At a minimum, a student and that student’s parents need tools for comparing outcomes for institutions and programs of preparation for students similar to that student. What were the results in terms of graduation and later salary for previous students at college X vs. college Y who were like me in terms of academic, family, and cultural background, and who majored in what I want to major in? Tools that would allow prospective students to answer such questions would also allow colleges to be meaningfully compared in terms of the value they add to the equation.
-
- The lack of plans for stewardship of the Scorecard runs the risk that it will be a one-time effort.
The new Scorecard is the result of collaboration between the White House, Department of Education, and Department of the Treasury. The need for collaboration across parts of the executive branch with leadership provided by the White House at the outset of such an effort is obvious given that education and tax records had not been linked before. But the start-up administrative arrangements for the Scorecard are unlikely to be a successful long-term strategy for the continuation of the effort, especially over the transition to a new administration in 2017.
By definition, outcomes data on higher education are backward looking, so it is important that they are continually updated as program quality changes and new cohorts of graduates succeed or flounder in the labor market. Much of the effort that went into creating the new Scorecard will have been for naught if the September 2015 release is the end of the road rather than the beginning. NCES within the Institute of Education Sciences in the Department of Education is the obvious entity to take charge of the Scorecard data and to integrate it with the more full-featured college search tool it already offers, College Navigator. Putting NCES, a federal statistical agency, in charge would also lead to the imposition of an array of data quality standards that should reduce in the future the sort of data errors that have been well documented in the present Scorecard releasex.
A way forward
The College Scorecard is a valiant by problematic effort to fill the void in the federal postsecondary data system that is due to the inability to follow individual students through the education system into the labor market and later life. The holy grail to fill this need is the so-called unit record system in which each student in the nation has a numerical identifier that is linked to that student’s education and labor market records, with the resulting administrative database at the federal level available to researchers under conditions that protect individually identifiable information; and, at the aggregate level, to the general public and policymakers through portals such as the Scorecard.
Such a unit record system was prohibited in the 2008 reauthorization by Congress of the Higher Education Act. Elimination of the prohibition is not politically obtainable in the foreseeable future, first because of concerns that privacy will be breeched through hacks and mistakes or through legislative or executive branch actions intended to enhance national security or law enforcement, and second because of resistance by segments of the postsecondary industry whose interests would not be served by public disclosure of valid and reliable data on institutional performance.
The question is whether there is a better kludge than the administration has been able to put forward with the Scorecard. We believe we have one:
Information on retention, graduation, costs, and salaries after graduation could be substantially improved if it were based on a slightly modified form that postsecondary institutions are presently required to submit annually to the IRS for every student who pays tuition or receives a scholarship or grant. This is Form 1098T, reproduced below. A brief inspection of the form should be enough to demonstrate that the federal government already knows which institutions enrolled which students in a given year, how much each of those students paid in tuition, whether the student was more than half-time, whether a graduate or undergraduate, and the amount the student received in scholarships and grants.
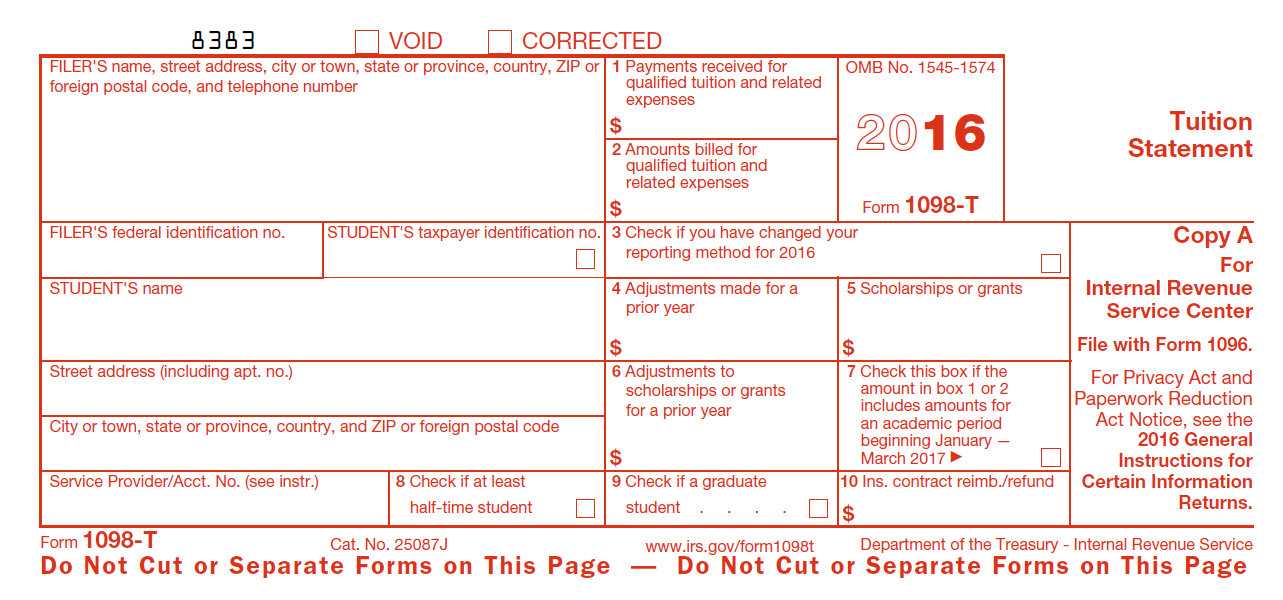
There are two data elements missing in the 1098T that would be necessary to provide a much-improved Scorecard that covers all students, not just those who applied for federal aid. The first is whether the student graduated. The federal student loan database has this information for recipients of federal financial aid, but the Department of Education deemed the NSLDS-based completion measures too unreliable to be included on the Scorecard websitexi.
The second critical missing piece in the 1098T is information on a student’s major or program of preparation. Without such information the glaring flaw in the current Scorecard of the lack of outcomes at the level of major cannot be fixed.
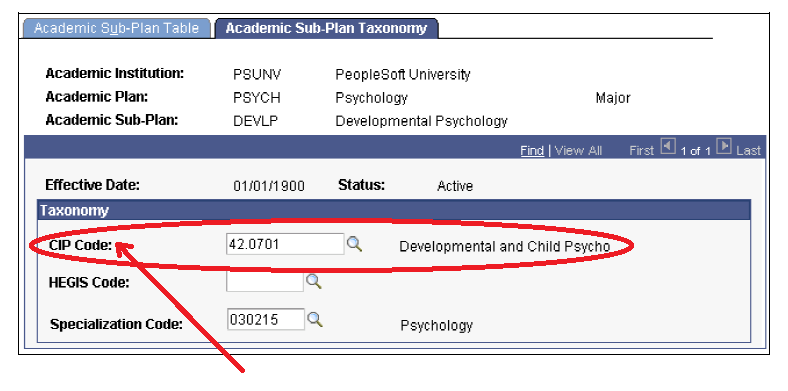
The Department of Education already requires institutions to report which of their aid-eligible students graduate. Last year, the Department began requiring for the first time that institutions also report the field of study of each recipient of a federal loan, along with the previously collected information on enrollment status that is used for the purposes of monitoring and collection of student loans. The figure below displays a data entry form from the PeopleSoft Campus Solutionsxii. system used by many colleges and universities to manage their student and human resource information. Other businesses provide similar solutions. The circled cell that asks for a CIP code is where the action is. CIP stands for Classification of Instructional Programs, a taxonomic scheme developed by NCES that supports the accurate tracking and reporting of fields of study and program completions activityxiii. In this case the CIP code refers to a student pursing a program of study in Developmental and Child Psychology.
The fix we propose is simple: add graduation status and CIP Code cells to the IRS Form 1098T. Institutions already have this information and are set up to report it to the U.S. Department of Education for all their students receiving federal aid. It is a small step involving minimal burden to have them report it on the 1098T, which they already have to submit to the IRS for everyone.
Three of the four data issues we raised with respect to the College Scorecard can be addressed entirely or in large part with what we propose. Salary outcomes would be available for all students, not just those receiving federal grants and loans. Salary and other outcomes, including retention and graduation, would be available at the level of program of preparation, not just at the aggregate level for the institution as a whole. Salary outcomes could be attributed to the institution from which the student graduated using the new information added to the 1098T.
The 1098T with information on major/program of preparation and graduation status does not directly provide an answer to a measure of the value-added by the institution over and above the characteristics of the students it admits. But it helps substantially with the addition of information on salary outcomes by program of preparation. With that data in hand, the federal government or other entities building college search sites using aggregate federal data could provide parents and prospective students with an individualized comparison of costs and outcomes among nominally identical programs of preparation. Students willing to anonymously input information about their family background would have the benefit of having those outcomes displayed for graduates of the program like them.
A 1098T-based Scorecard also has the important feature of not requiring a new data system and not requiring the linkage of data on individuals across agencies. With the addition to the 1098T of the two data elements we have recommended, the federal government could generate for consumers aggregate reports on salary outcomes at the level of individual programs of preparation, sliced and diced demographically, without individual data ever leaving an IRS server.
We believe this approach does not run afoul of the unit-record ban put in place by Congress in the 2008 reauthorization of the Higher Education Act because it does not require the development or maintenance of a Federal database of personally identifiable information on students attending higher education institutions. Rather, it requires only that the IRS produce annual research reports for public use that include no individual data and that are based on data the IRS already holds in tax databases that have nothing in particular to do with higher education.
Finally, we believe the sustainability of this effort will turn on the current administration putting in place a long-term stewardship plan for the Scorecard. A natural solution is to house the effort in NCES, which would integrate the aggregate data from the IRS with existing efforts such as the College Navigator (we can think of no reason why the Navigator and the Scorecard should both continue to exist), and ensure that the Scorecard continues to be updated as new and improved data become available. NCES is much more likely to carry this torch successfully through 2017 and beyond than political appointees in the White House and Department of Education.
The new Scorecard gets us closer to what the nation needs to provide an informed marketplace for consumers of higher education services and higher education leaders and policymakers, and its creators are clearly aware of the problems that remain on issues such as program-level and student-personalized dataxiv. We can get there with minor tweaks in current data collections and the pathways the information takes as it makes its way to the federal government. The College Scorecard is a wonderful idea. Let’s make it truly useful.
i.https://collegescorecard.ed.gov/.
ii. Parent Plus loans, which are made to parents rather than students, do not count and are not considered in Scorecard data.
iii. http://www.stonybrook.edu/commcms/irpe/data/cds/CDS_2013-2014.pdf
iv. https://nces.ed.gov/collegenavigator/?q=stony+brook+university&s=all&id=196097#finaid
v. http://nces.ed.gov/pubs2015/2015025.pdf
vi. http://nces.ed.gov/programs/coe/indicator_cva.asp
vii. http://www.stonybrook.edu/commcms/irpe/data/cds/CDS_2013-2014.pdf
viii. https://nces.ed.gov/collegenavigator/?q=stony+brook&s=all&id=196097#retgrad
ix. http://www.payscale.com/college-salary-report/majors-that-pay-you-back/bachelors?page=22
x. http://www.usnews.com/news/articles/2015/10/08/obamas-college-scorecard-shows-pell-grant-data-problem
xi.pp. 14-15 of https://collegescorecard.ed.gov/assets/FullDataDocumentation.pdf
xii. http://docs.oracle.com/cd/E17137_01/psft/acrobat/cs9lsfn-b0310.pdf
xiii. https://nces.ed.gov/ipeds/cipcode/Default.aspx?y=55
xiv. p. 28 of https://collegescorecard.ed.gov/assets/BetterInformationForBetterCollegeChoiceAndInstitutionalPerformance.pdf
The Brookings Institution is committed to quality, independence, and impact.
We are supported by a diverse array of funders. In line with our values and policies, each Brookings publication represents the sole views of its author(s).