Watch the video recording of the event discussing middle class housing challenges.
Over the past decade, housing costs in the U.S. have risen faster than average incomes. While housing affordability has long been a problem for low-income families, middle-income families are increasingly facing affordability challenges, especially in urban areas with strong labor markets. When housing costs rise, households can respond by adjusting their consumption; for instance, living in smaller spaces or moving farther from city centers. In this paper, I examine middle-class housing stress along four dimensions: affordability, inadequate space, commute times, and homeownership. Using household-level data from the Census Bureau’s Individual Public Use Microdata Sample (IPUMS), I explore how housing stresses vary by income, household type, race, and geography. Results show that, on average, middle-income families are doing well on all four dimensions. However, distinct population groups show stress on several metrics, including affordability, crowding, long commute times, and access to homeownership.
1. Housing can enhance well-being or create distress through several channels.
Having a stable, decent home in a safe, healthy community is critical to overall well-being. Housing is the largest single expenditure in most family budgets, more than double the amount spent on either transportation or food. Residential stability provides the foundation for participating in other economic and social activities. Where families live has wide-ranging consequences for their well-being. Location affects access to jobs, transportation, and social networks, as well as the quality of local services such as schools and public safety. Public health researchers have tracked the increasing correlation of location with a variety of health outcomes. Home equity is by far the largest financial asset for most middle-income households.
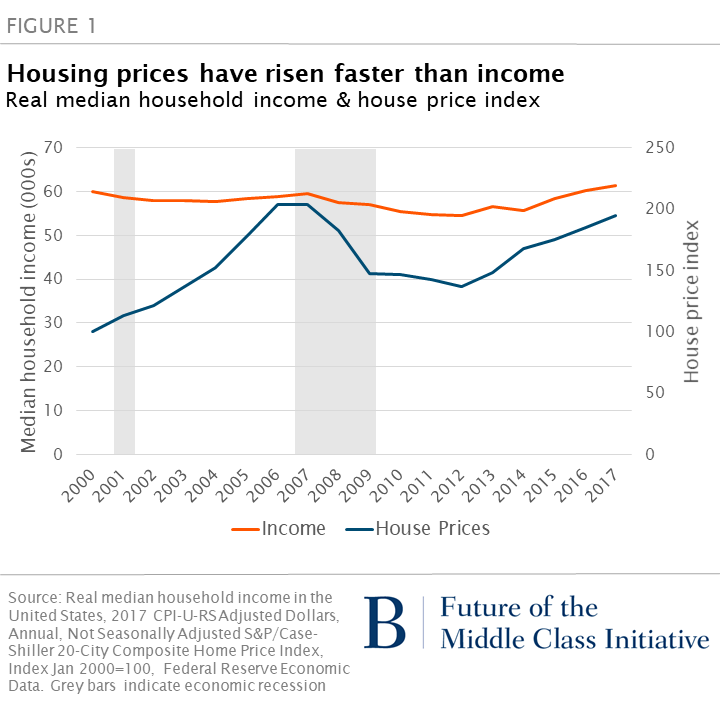
Over the past five years, housing costs have risen faster than incomes (Figure 1). Housing affordability has long been a problem for low-income families. Roughly 80 percent of renters and 63 percent of owners making under $30,000 per year spend more than 30 percent of their income on rent. Middle-income families are increasingly facing affordability challenges in urban areas with strong labor markets, especially along the Northeast and West coasts.
Each household makes multiple complex choices when picking a home: how much of its monthly budget to spend on housing compared to other goods and services, the size and quality of the home, proximity to work, and other neighborhood characteristics. Compromise on one dimension does not necessarily raise concerns: for instance, some households strongly value having a larger home, and are willing to commute longer distances to afford extra space. For policymakers, understanding housing choices made by groups of similar households can provide insight into how well local housing markets are working.
In this paper, I examine whether middle-income households are experiencing housing stress through four different dimensions: housing expenditures, adequate space, commuting times, and homeownership. All of these dimensions essentially reflect financial constraints, but we might expect different types of households to accommodate budgets constraints through different housing adjustments. Therefore I measure average outcomes on these four dimensions across all households, and test whether housing stress differs systematically by income, household type, race, or geography.
Housing can create direct financial stress if housing expenses take up too much of a household’s resources, crowding out other necessities. A commonly used benchmark for affordability is HUD’s standard: households spending above 30 percent are “cost burdened” and those above 50 percent as “severely burdened”. More generally, households who devote a larger share of income to rent or mortgage payments will have less available to spend on food, transportation, health care, and other necessities.
One way that households adjust to high housing costs is to downsize to smaller housing units or “double-up” with other households. This creates the potential for housing stress along another dimension: crowding. HUD defines households with more than two persons per bedroom as overcrowded. Crowding can harm children’s academic achievement, physical and mental health. I measure crowding stress as the average number of people per bedroom and the share of households with more than two people per bedroom.[1]
Households can also reduce their housing expenses – or more easily afford larger, better quality homes – by moving farther away from city centers and enduring longer commutes.[2] Historically in the U.S., high-income households have chosen to occupy large homes in the suburbs, while lower-income – and especially minority – households live in center cities where public transportation infrastructure is better. Few people enjoy commuting; longer commutes are unpleasant both for individuals and for society because of the environmental impacts. The U.S. average commute is around 27 minutes each way. Commuting stress is defined as commute times more than one hour.
The first three housing metrics all have clear ordinal direction: all else equal, households are better off if they have more disposable income remaining after housing costs, have adequate space per person, and spend less time commuting. Homeownership is not obviously better than renting: there are pros and cons to both tenures, especially at different life stages. Nonetheless, homeownership is an important metric for two reasons. First, during periods of rising housing values, homeownership provides insurance against housing expenses rising faster than income. Most U.S. homeowners have 30 year fixed rate mortgages, so their monthly housing costs remain relatively fixed over a very long term. By contrast, renters face the possibility of increased housing costs when their current leases expire. Second, U.S. tax policy heavily favors wealth-building through homeownership, so renters face large financial disadvantages in accumulating wealth relative to homeowners. Homeowners can deduct the value of mortgage interest paid from their federal income taxes, on mortgages up to $750,000. Capital gains on owner-occupied housing are subject to lower taxes than on non-housing assets, such as stocks and bonds. Understanding systematic gaps in homeownership across population groups has important policy implications, particularly around residential stability and wealth building.
Among middle-income households, housing stresses may vary by income, household type and race. Households in the third and fourth income quintiles (with fifth quintile being the highest income) will have a wider range of housing and location choices than households in the second quintile, and are expected to consume larger, better quality homes. Family type and size, especially the presence of children, is strongly correlated with housing tenure, location choice, and housing type. In particular, the transition from renting to owning often accompanies major life decisions such as getting married and having a child. Younger childless households are more likely to rent rather than own to maintain job flexibility and accommodate changes in family status.
U.S. housing markets have a long history of racial discrimination, which affects household location and tenure, especially for black families. Local zoning laws that restrict development of apartments in wealthy neighborhoods continue to reinforce high levels of racial segregation. Black and Latino families generally have to pay higher rents or prices, conditional on housing quality, to gain access to mostly white neighborhoods. Redlining and discriminatory mortgage lending have resulted in African-Americans and Latinos having lower homeownership rates than whites and Asians, even conditional on income and other observable characteristics.
A key area of interest is observing whether middle income households in different metropolitan areas are making systematically different housing decisions. Housing prices vary widely across regions of the U.S., so households of equivalent income may not have access to similar housing or neighborhood quality. To examine geographic diversity, I focus on four metropolitan areas chosen from the four Census regions: Atlanta, Cleveland, Philadelphia, and San Francisco. San Francisco has some of the highest housing costs in the nation while Cleveland has some of the lowest costs. Atlanta is representative of Sunbelt metros with relatively newer housing stock and a large footprint with lower population density. These metros also vary in the degree of employment centralization and transportation infrastructure.
The analysis uses household-level data from the American Community Survey Individual Public Use Microdata Sample. I define middle-income households as those in the middle three quintiles of their metropolitan area’s income distribution; because housing costs vary greatly across geographic areas, using the metro area income to assign quintiles better captures households’ purchasing power. The analysis focuses on households with at least one adult (ages 18 to 65) who is in the labor force. Retired or non-working households are excluded because they are less likely to make location decisions based on proximity to work.
The U.S. does not face a nationwide affordability crisis for middle-income households. On average, middle-income households also fare well on measures of crowding and commute times. However, some groups of middle-income households face higher levels of housing stress along specific dimensions. Lower-middle income households spend more than 30 percent of the income on housing in all metro areas. Families with children living in expensive metro areas have relatively high rates of crowding. Hour-long commutes are most common in high-cost metros, especially in California and the Northeast. Among middle-income households, substantial homeownership gaps exist by age and race. The types of housing stress experienced by middle-income households have implications for national, state, and local policy.
2. Lower-middle-income households are stretching to afford housing.
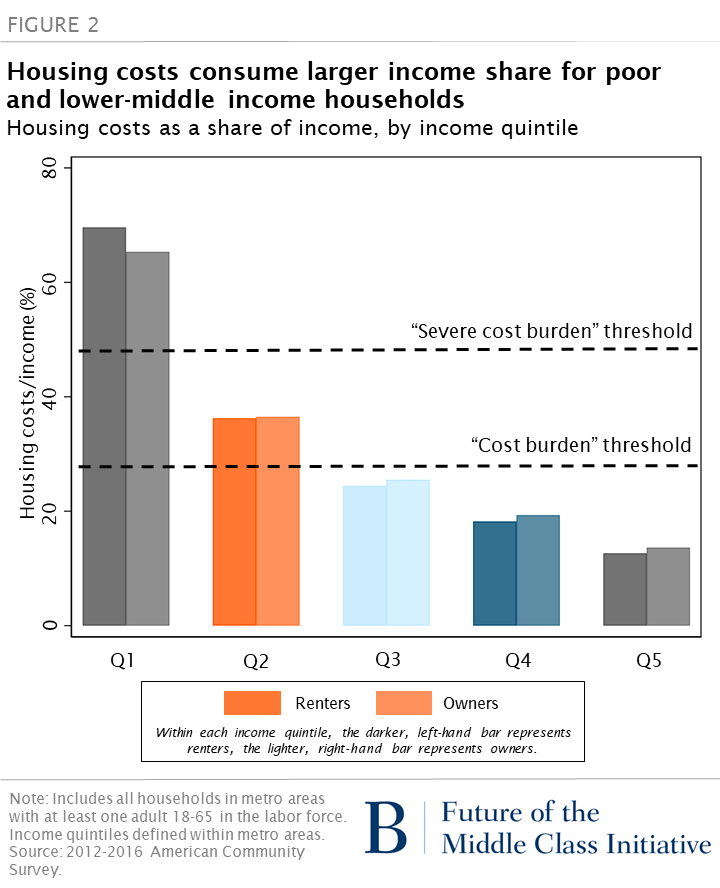
If we group households in all three middle income quintiles together, renter households spend just under 30 percent of their income on housing costs. Middle-income homeowners spend 25 percent.[3] These numbers vary considerably across income quintiles, as shown in Figure 2, and to a smaller degree by household type, race, and geography.
Housing costs take up a larger share of income for poor and lower-middle-income households than for more affluent households (Figure 2). Most households in the third income quintile spend under 30 percent on income on housing, while households in the fourth quintile spend less than 20 percent. But lower-middle income households (second quintile) spend nearly 40 percent of income on housing, while the poorest households spend on average more than 60 percent. Within income quintiles, housing accounts for similar income shares for both homeowners and renters.
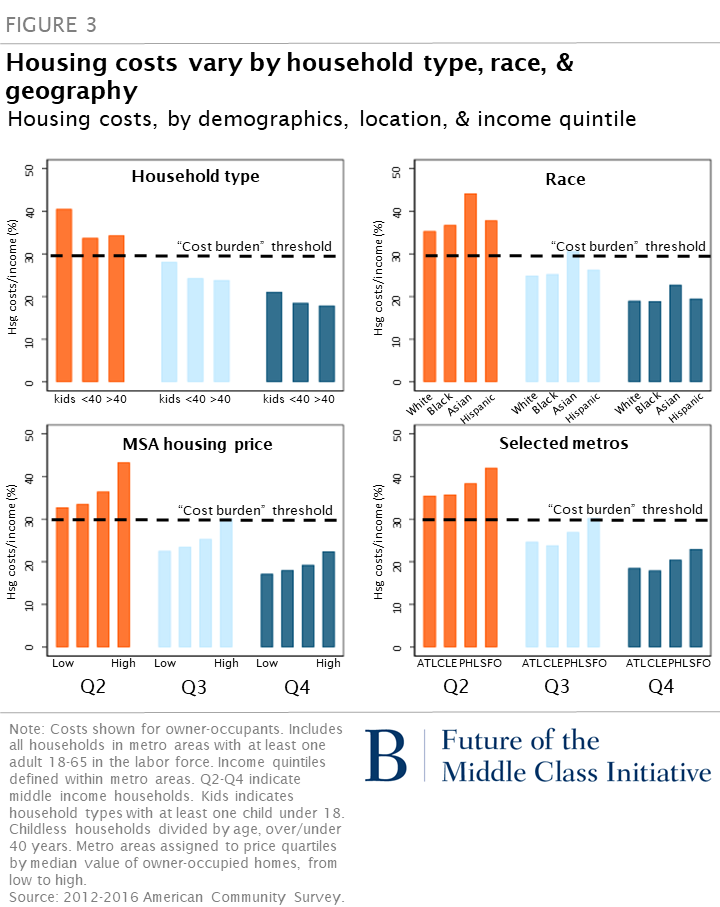
While income is the main factor that affects how much households spend on housing, there is some variation by household type, race, and geography (Figure 3). Within each income quintile, families with children spend more of their income on housing than households without children.[4] Asian households have higher housing expenses than white, black, or Hispanic households.[5] Nearly 70 percent of Asian households live in the highest-priced housing markets, compared to forty percent of non-Asian households. Housing costs make up a larger share of income in more expensive metros for all income quintiles. For instance, households in San Francisco spend more on housing than in the other three metros.
3. Middle-income households occupy plenty of space – with one important exception.
Middle-income households occupy homes with an average of one person per bedroom – half the threshold for crowding. The average number of people per bedroom varies somewhat across income quintiles, but more by house price levels in the metropolitan area. Of course, the number of bedrooms is not a perfect measure of space: square footage of housing units with the same bedroom count can vary widely across neighborhoods and cities. The top panel of Figure 4 shows persons per bedroom, with metros divided into quartiles by housing values (1 is the least expensive, 4 is the most expensive). Households of all incomes living in the lowest cost metros have about one person per bedroom. For households living in the most expensive metros, all three income quintiles have slightly more than one person per bedroom.
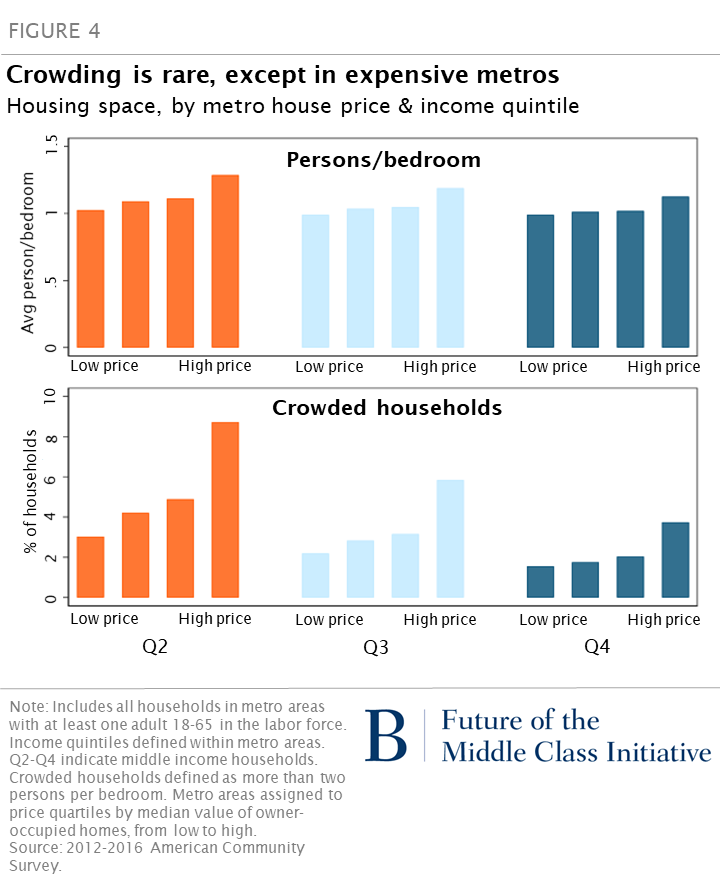
The pattern is even more notable when we look at the share of crowded households (more than two people per bedroom). The lower panel of Figure 4 shows the share of households with more than two persons per bedroom, by metro price tier and income quintile. About three percent of all middle-income households across the U.S. are crowded, but nearly six percent of households in the most expensive metros are crowded. Almost nine percent of lower-middle income households in the most expensive metros are crowded.
The amount of space consumed per person is mostly a function of household type: crowding is most acute for families with children. The top panel of Figure 5 shows the frequency of crowding by household type and metro housing prices. Five percent of families with children in the cheapest metros are crowded, rising to about 14 percent of families in the most expensive metros. Crowding is extremely rare among childless households both under and over age 40.
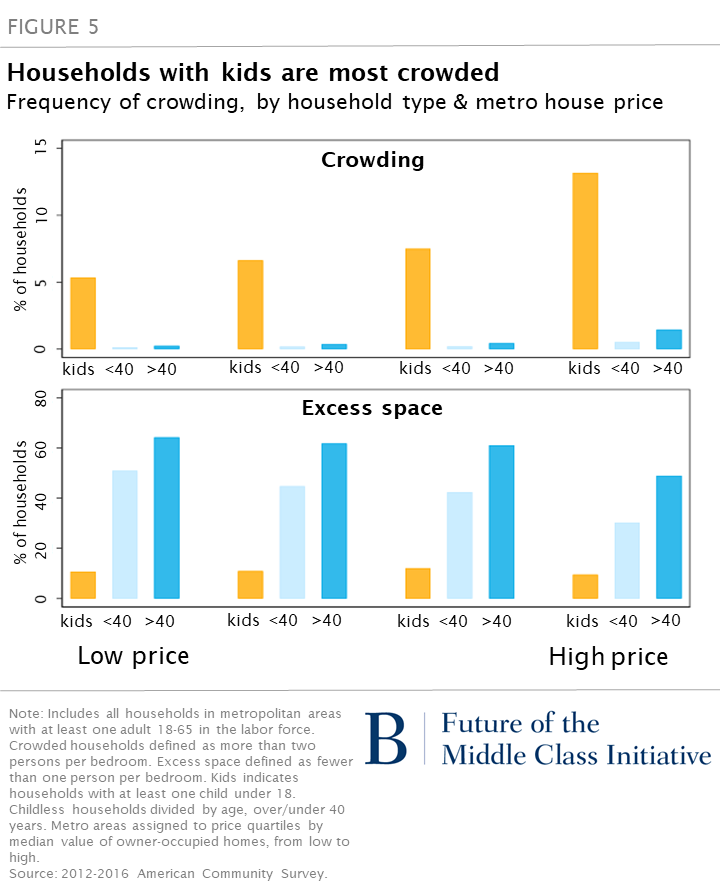
One possible explanation is that the size of most housing units is too small to accommodate families. To examine this hypothesis, the lower panel of Figure 5 shows the frequency of “excess” space, defined as households who have fewer than one person per bedroom (e.g. a married couple living in a house with three or more bedrooms). Excess space is much more common than crowding in all price tiers and for most household types. Nationally, more than one in three households has excess space, even in high-priced metros. Childless households over age 40 are the most likely to have excess space; many of these households may be empty nesters who have not downsized after their children left home.
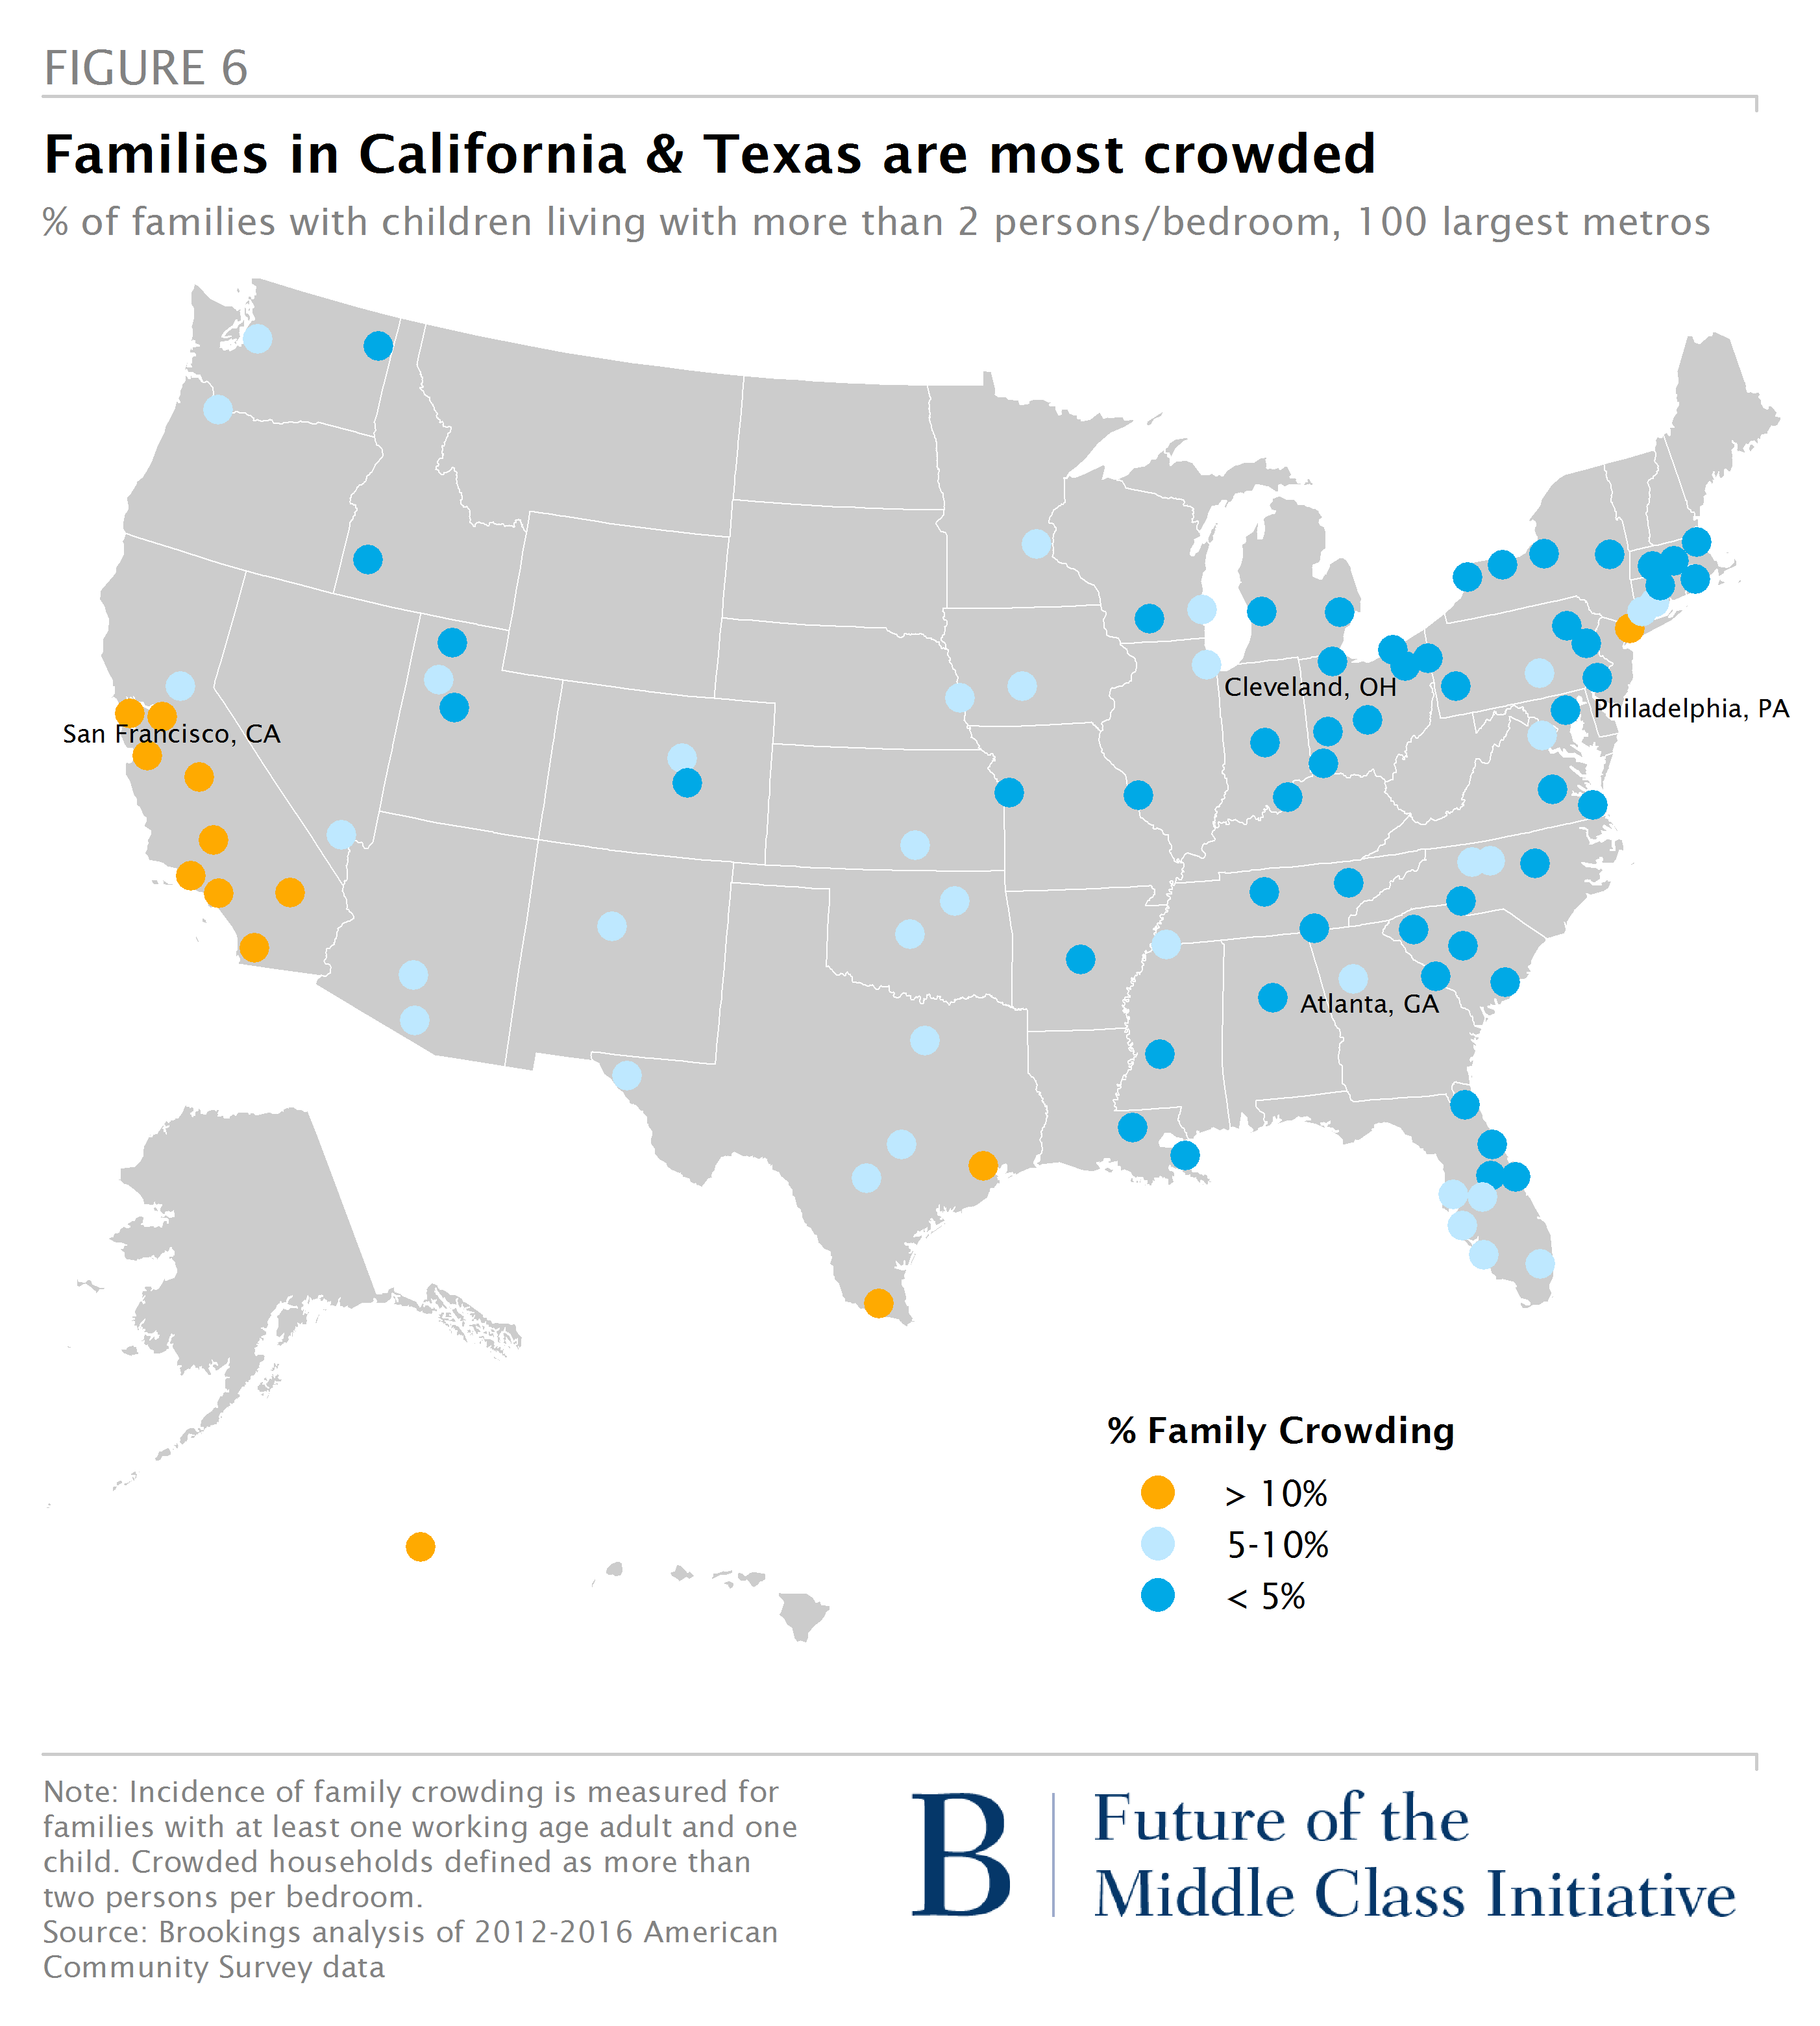
For a broader picture of how common crowding is among families with children across the U.S., we can map the relative frequency for the largest 100 metro areas (Figure 6). Crowding is most common among metros in California and Texas. The metros along California’s coast – San Francisco, Los Angeles, San Diego, and Santa Barbara – have some of the highest housing values nationwide, as do other outliers like New York. But the highly crowded metros also include relatively inexpensive markets with high poverty rates, such as McAllen, TX, and Fresno, CA.
4. Long commutes are more common in expensive housing markets
Most middle-income households have commute times close to the national average of 27 minutes. Average commute times vary relatively little by income or household type. Commute times – and especially the frequency of very long commutes – vary substantially by metropolitan area housing prices (Figure 7). Households of all incomes have on average 8 minute longer commutes in the most expensive metros compared to the least expensive metros (top panel of Figure 7).[6]
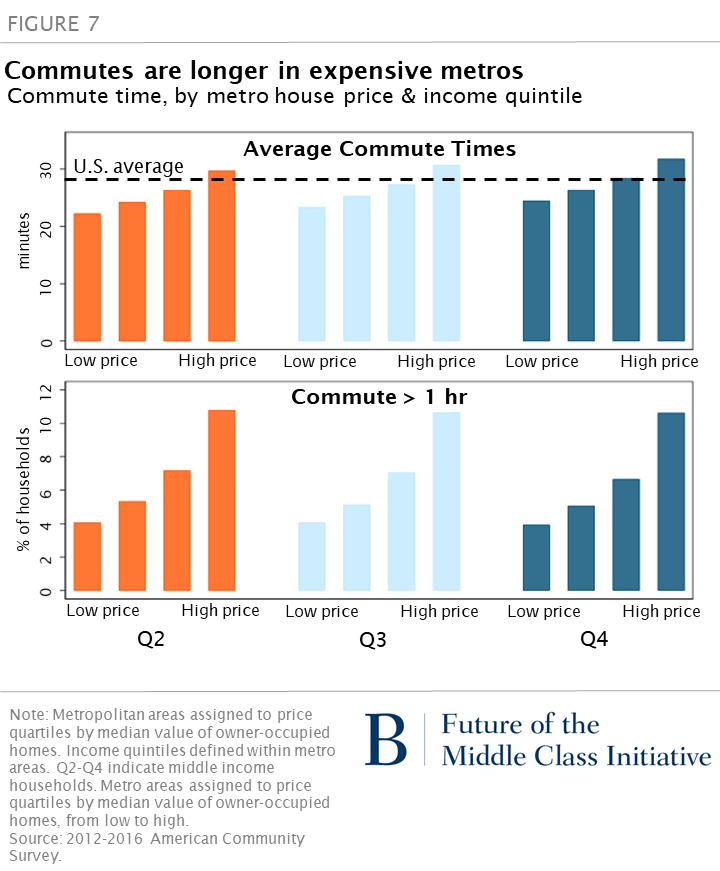
Very long commutes (more than one hour each way) are also more common in expensive metros (lower panel of Figure 7).[7] Only four percent of households in the cheapest metros have hour-long commutes, while more than 10 percent of households in expensive metros commute that long. Differences across metros are much larger than within-metro differences by income or household characteristics.[8]
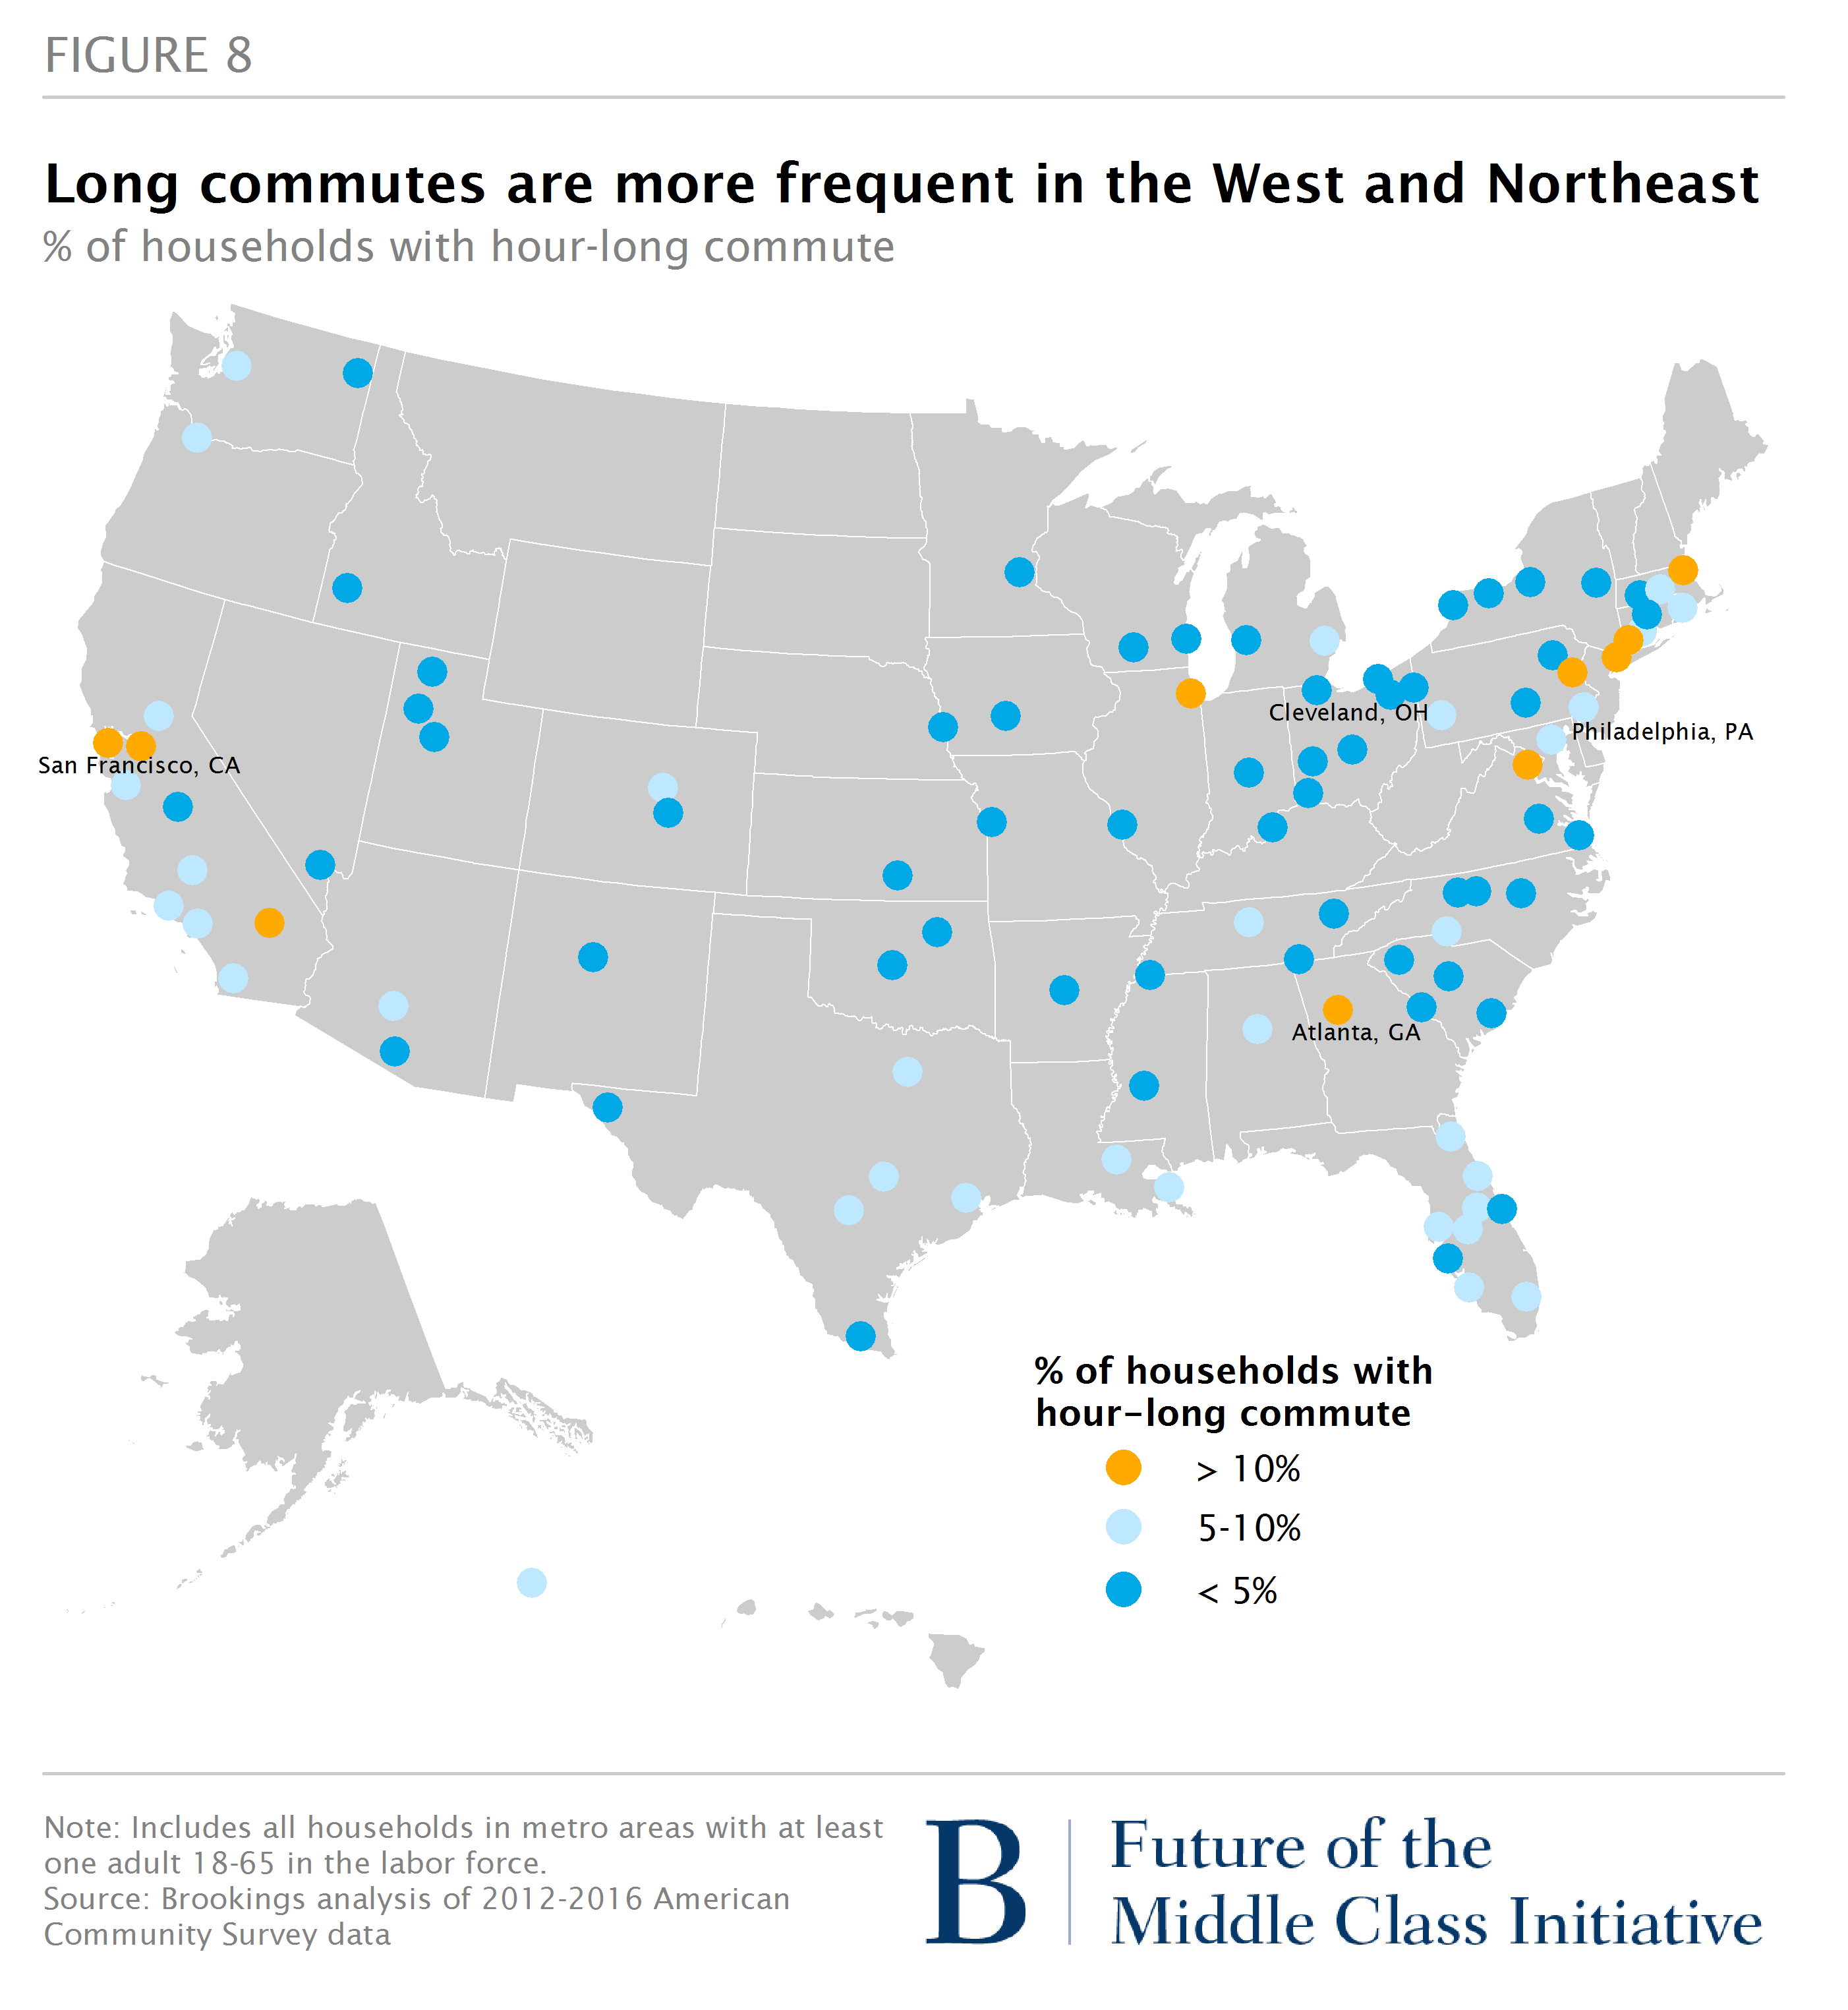
To see geographic patterns in the frequency of hour-long commutes, I mapped the share of households with long commutes across the 100 largest metros (Figure 8). Long commutes are especially prevalent along the Northeast corridor from Washington DC to Boston and in California. Chicago and Atlanta also have very high shares of households with long commutes. There is some overlap between metros with high crowding and long commutes; the correlation between the two metrics is about 0.45.
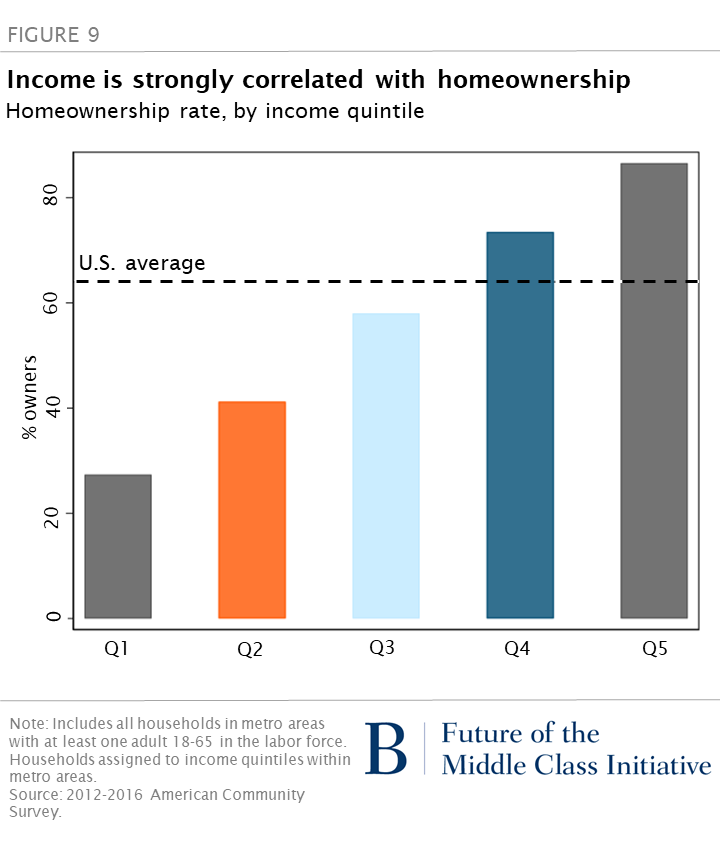
5. Income, age, and race limit access to homeownership.
Consistent with prior research, the probability of owning one’s home increases with income (Figure 9). More than 70 percent of households in the 4th income quintile are homeowners, compared to 40 percent of lower-middle-income households.
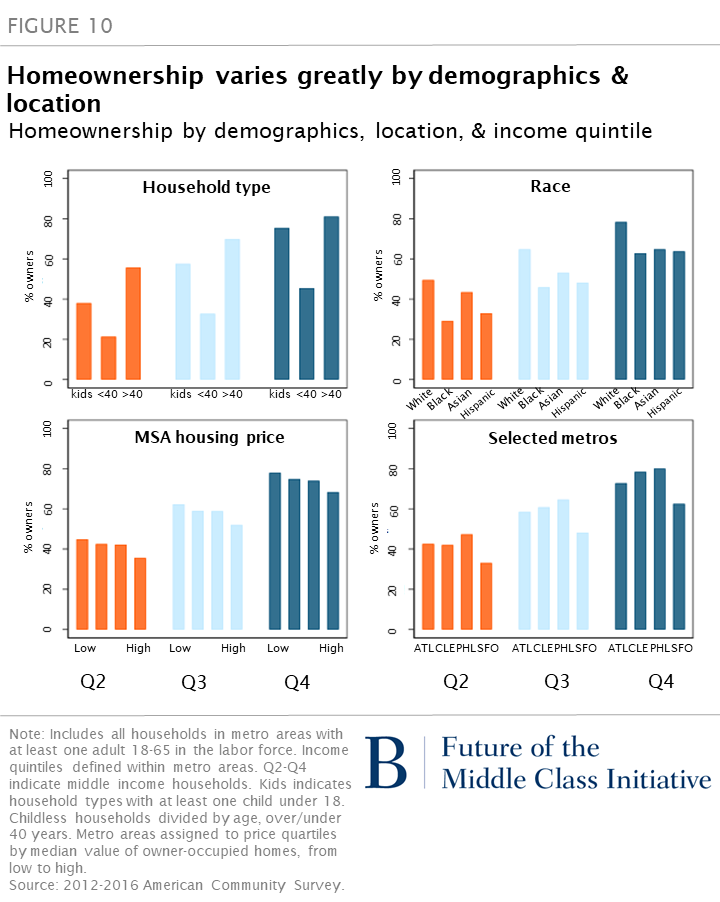
Within income quintiles, homeownership rates vary substantially by household type (Figure 10, upper left). Childless households over 40 are the most likely to own their homes, with childless households under 40 the least likely. Families with children are about equally distributed by age, and are more likely to be homeowners than equivalent age households without children.
Homeownership rates also vary by race and geography. Black and Hispanic households are least likely to own their homes, with largest gaps in the second income quintile. Black households in the middle income quintile are in fact slightly less likely to own their home than white households in the income quintile below. Homeownership rates for all income quintiles are lower in the most expensive metro areas, like San Francisco; high housing prices make downpayments a substantially larger hurdles in expensive metros. Households in the fourth income quintile in San Francisco are about as likely to own their homes as third quintile households in the other three metros – even though absolute incomes are much higher in San Francisco.
6. Discussion and policy implications
Analyzing housing stress along several dimensions produces a mixed picture of how well off middle-income households are. The average middle-income household’s housing expenditures are well within HUD’s affordability guidelines. Most households consume adequate space per person, and commuting times are near national averages. But there are less rosy outcomes for distinct groups, by income, household type, race, and geography.
Some housing challenges do affect middle-income households across the nation. Affordability is a problem for lower-middle income households everywhere – both low- and high-cost metros show similar strains. Access to homeownership lags for younger & non-white households across the country. Other housing challenges are mostly local or regional problems. In expensive metros, families with children are more likely to face crowding, the incidence of very long commutes is higher, and homeownership rates lag for all middle-income households. This implies that, although some national policy responses may be appropriate, any federal policies should take into account regional and local variation.
Nationally, there are several mechanisms for reducing financial stress on lower-middle income households (affordability is an even more acute problem for the poorest 20 percent of families nationwide). One approach would be to increase incomes through expanding the EITC or wage supplements. Given that HUD currently serves about one in five poor households who are eligible for assistance, the likelihood of increased federal support for housing assistance to moderate income families seems dim. For lower-middle income households in inexpensive metropolitan areas, the median affordability gap (the difference between housing expenses and HUD’s 30 percent threshold) is about $100 per month. Providing financial relief for these households would be feasible through modest decreases in housing costs, such as improving the energy efficiency of existing homes to reduce utility bills.
If we are agnostic about the inherent benefits of owning versus renting, variation in tenure alone does not call for policy intervention. However, renters are missing out on subsidies that are tied to homeownership (like deductions for mortgage interest and property taxes), and do not have an equivalent “forced savings” mechanism. Persistent differences in homeownership by race suggests a continued federal role in enforcing fair housing and fair lending laws. Moreover, developing incentives for wealth-building that is not tied to homeownership – including forced savings mechanisms and tax incentives – would benefit both renters and owners in accumulating emergency savings.
Because housing stress for the middle class is greatest in expensive metros, it is also imperative that state and local governments address the persistent housing supply gap that has led to these high prices. Any long-term solution must involve increasing housing supply, especially near jobs and transit infrastructure (which would directly help reduce long commutes). High cost cities and states – notably California – have struggled with policy changes to expand housing supply, encountering political resistance from long-term homeowners who enjoy their large houses and have built substantial wealth over the past decades. Federal policies like wealth taxes or state reforms to Prop 13 could also discourage space hoarding among long-time owners.
Housing matters for the quality of life of the American middle class, in terms of quality, cost and location. There are wide variations in the kind of housing challenges faced by middle class families – by metro area, race, income level and family type. Policies to reduce housing stress are available, but will have to be carefully designed and implemented.
Related Content
2019
Author

The Brookings Institution is committed to quality, independence, and impact.
We are supported by a diverse array of funders. In line with our values and policies, each Brookings publication represents the sole views of its author(s).