Despite the headwinds created by the Delta COVID-19 variant, the economy is recovering. Economic growth during the pandemic has generally surpassed consensus expectations while households and businesses have maintained a surprising amount of activity and spending while social distancing.
The strength in economic output was, in part, a result of the enormous legislative response to both the pandemic and to the human hardship it caused. This includes laws passed in 2020 and 2021 by Congress, chief among them the Coronavirus Aid, Relief, and Economic Security Act (CARES Act), the Consolidated Appropriations Act, and the American Rescue Plan Act. Successive rounds of substantial fiscal support have boosted economic activity since March 2020 and are projected to continue to do so through 2023. To give a sense of the potential impact of federal action on the economy, Edelberg and Sheiner (2021a) estimated that a package of similar magnitude to the American Rescue Plan would boost economic output by 4 percent in 2021 and 2 percent in 2022.
These 11 facts on the economic recovery from the COVID‑19 pandemic build on much of The Hamilton Project’s work over the past year and a half.
- Since the onset of the pandemic, The Hamilton Project has provided guidance to policymakers on the fiscal policy response writ large (Edelberg and Sheiner 2020, 2021a, 2021b; Shambaugh 2020a, 2020b, 2020c, 2020d, 2020e).
- In the summer and fall of 2020, The Hamilton Project published essays from leading economic thinkers projecting how COVID-19 would change the economy (Autor and Reynolds 2020; Edelberg and Shambaugh 2020; Hardy and Logan 2020; Rose 2020; Stevenson 2020), provided interim evidence on the state of the economy (Bauer, Broady, et al. 2020), and published rapid evaluations and policy proposals on nutrition assistance (Bauer, Pitts, et al. 2020) and small business (Hamilton 2020).
- The Hamilton Project has focused on the disparate impact of the pandemic and its economic consequences on women (Bauer 2021; Bauer, Buckner, et al. 2021; Bauer, Estep, and Yee 2021), communities of color (Aaronson, Barnes, and Edelberg 2021; Broady et al. 2021; Grooms, Ortega, and Rubalcaba 2020), and frontline essential workers (Nunn, O’Donnell, and Shambaugh 2020; O’Donnell 2020).
- The Hamilton Project has focused on providing research regarding critical policy areas, including food insecurity (Bauer 2020a, 2020b; Bauer and Schanzenbach 2020), housing insecurity (Broady, Edelberg, and Moss 2020; Edelberg et al. 2021), and labor market distress (Aaronson and Edelberg 2020; Bauer, Dube, et al. 2021; Bauer, Edelberg, and Parsons 2020; Gilarsky, Nunn, and Parsons 2020; Nunn 2020; Nunn and O’Donnell 2020; Nunn, Parsons, and Shambaugh 2020).
- The Hamilton Project has commissioned policy proposals to rethink the social insurance system (Barnes et al. 2021), including unemployment insurance (Dube 2021), paid leave (Byker and Patel 2021), housing (Collinson, Ellen, and Keys 2021), child care (Davis and Sojourner 2021), workforce development (Holzer 2021), and postsecondary education (Arum and Stevens 2020).
Based on this body of work and the facts in this paper, we draw the following conclusions at this point in the economic recovery. First, the initial rapid economic recovery and expected slowing creates risks that policymakers should heed. Second, fiscal support has been essential to accelerating the recovery. Third, greater federal investment in infrastructure, both physical and human, is key to improving the country’s longer-term economic prospects.
The Economic Recovery
With the ongoing effects of fiscal support, pent-up demand from consumers for face-to-face services, and the strength in labor markets and asset prices, economic growth is poised to be strong for the remainder of 2021. Indeed, the Congressional Budget Office (CBO) projects that real GDP will grow 7.4 percent from the fourth quarter of 2020 to the fourth quarter of 2021 (CBO 2021c). Moreover, CBO predicts that, by the middle of 2022, real GDP will exceed its sustainable level by 2.5 percent. The sustainable level of GDP, also known as potential output, is not a ceiling. Instead, it is the estimated level of output, given current laws and underlying structural factors, that the economy can achieve without putting upward pressure on inflation. As the factors boosting growth in the short term begin to wane, real GDP growth is expected to slow significantly.
CBO’s projection is subject to a great deal of uncertainty. In particular, the resurgence in the pandemic stemming from the Delta variant, vaccine hesitancy, and the slowness in vaccinating children ages 12 and younger appear to have dampened the growth of consumer demand and employment. Recent data suggest that the latest COVID-19 wave might be waning. However, if the Delta variant—or others that take its place—continue to affect consumer behavior and supply chains, the economic recovery will be notably slower.
In addition, although consensus projections are for a soft landing, including a couple of quarters with GDP roughly moving sideways, the slowdown could be more abrupt and painful than those projections suggest. There are actions that Congress could take to help avoid a painful slowdown in activity—both by fine-tuning the timing of spending and by focusing resources on policies that boost potential output. For example, changes in policy that repurpose fiscal support from boosting current aggregate demand to policies that would boost the economy’s potential (such as federal investment in infrastructure that would increase labor supply and human capital) would increase the chances of a soft landing, in part by raising the landing area to a higher level.
The Uneven Nature of the COVID-19 Pandemic and Economic Recovery
As of September 26, 2021, more than 687,000 people in the United States have died from COVID-19; and more than 4.7 million have died worldwide (Johns Hopkins 2021). At the onset of COVID-19, the virus displayed clear geographic trends, beginning in densely populated coastal cities then spreading to more rural parts of the country (Desjardins 2020). With the pandemic first hitting the Northeast, in April of 2020 New York and New Jersey accounted for more than 60 percent of deaths and more than 40 percent of hospitalizations from COVID-19. The Delta variant and vaccine hesitancy have changed the geographic patterns: as shown in figure A-1, since mid-July 2021 patients hospitalized with COVID-19 in the South have risen to account for nearly two‑thirds of the US total, with half of those patients in Florida and Texas (broken out from the rest of the region in the figure).
The economic downturn caused by the pandemic has created widely different experiences across sectors and demographic groups. In the spring of 2020, spending on consumer services sharply contracted and has yet to fully recover. Indeed, of the 22 million total jobs lost in March 2020, nearly 19 million were in service-providing businesses, including a decline of 8 million in leisure and hospitality. Leisure and hospitality has added back more than 6.5 million jobs so far; as a result, it is still 10 percent short of returning to its pre-pandemic level, and even farther below its expected level in the absence of the pandemic. Other industries, such as financial services, that experienced shallower dips in employment during the onset of the pandemic, have also been the quickest to recover as their workforces were better able to shift to remote work.
Those sector dynamics disproportionately hurt women, non-white workers, lower-wage earners, and those with less education (Stevenson 2020). Because workers among those groups were more likely to be employed in the services sector, and in particular in the leisure and hospitality sector, they experienced job losses at much higher rates. For example, the gap in the rates of unemployment between Black and white men jumped from 3 percentage points to 6 percentage points during the initial downturn. By July, that gap had partially fallen back and was 4 percentage points.
The uneven recovery is also evident when we focus on consumer spending at retail establishments. Between February and April 2020, overall retail sales sank 22 percent before quickly recovering to their pre-pandemic level just a few months later. As people began social distancing, spending shifted to at-home consumption, benefiting businesses like online retailers, grocery stores, and suppliers of building and garden materials. Indeed, spending on total retail sales has averaged 16 percent higher than its pre-pandemic level so far this year. At the same time, some categories of retail sales were severely depressed until showing signs of recovery in March of this year; those include in-person dining and spending on clothes, electronics, and appliances.
Overall, the pandemic continues to weigh on aggregate demand for goods and services. In addition, bottlenecks and supply shortages have created challenges for businesses to meet consumer demand for some products, particularly as consumer demand has shifted wildly. Also, the pace of hiring has not kept up with the pace of labor demand, as job matching has been held back by a number of factors described below.
Those developments have led to a notable increase in inflation. Because prices fell in 2020, one-year changes from August 2020 to August 2021 overstate the increase in inflation since the pandemic began. Instead, focusing on the annualized rate of inflation since February 2020 shows that inflation through August 2021 (as measured by the core consumer price index) was 3.1 percent, substantially lower than the one-year trend but still higher than any annual increase since the early 1990s.
There are two primary reasons why the rise in inflation is unlikely to persist. First, the significant shifts in demand and bottlenecks are a function of the recent, temporary pace of economic activity. For example, demand for automobiles recovered quickly during the pandemic to high levels even as production was curtailed, in part due to disruptions in the supply chain for critical semiconductors. The result has been a sharp increase in prices for new and used vehicles. Second, as production is increased (with normalization of global supply chains) and growth in demand abates, inflation should slow overall.
Nonetheless, certain factors will continue to create inflationary pressure; even with the slowdown, economic activity over the next year or so will continue to exceed the sustainable level. We might also see price spikes in certain services as demand shifts. For example, from March 2021 through July sales at restaurants were up 14 percent while sales at building materials and garden stores were down 11 percent. Such changes could lead to price surges at restaurants that more than offset softer prices at stores selling building materials and garden supplies. In addition, the rapid rise we have seen in home prices will likely translate into significantly higher rental costs across the country.

Fact 1: In the second quarter of 2021, GDP returned to its pre-pandemic level.
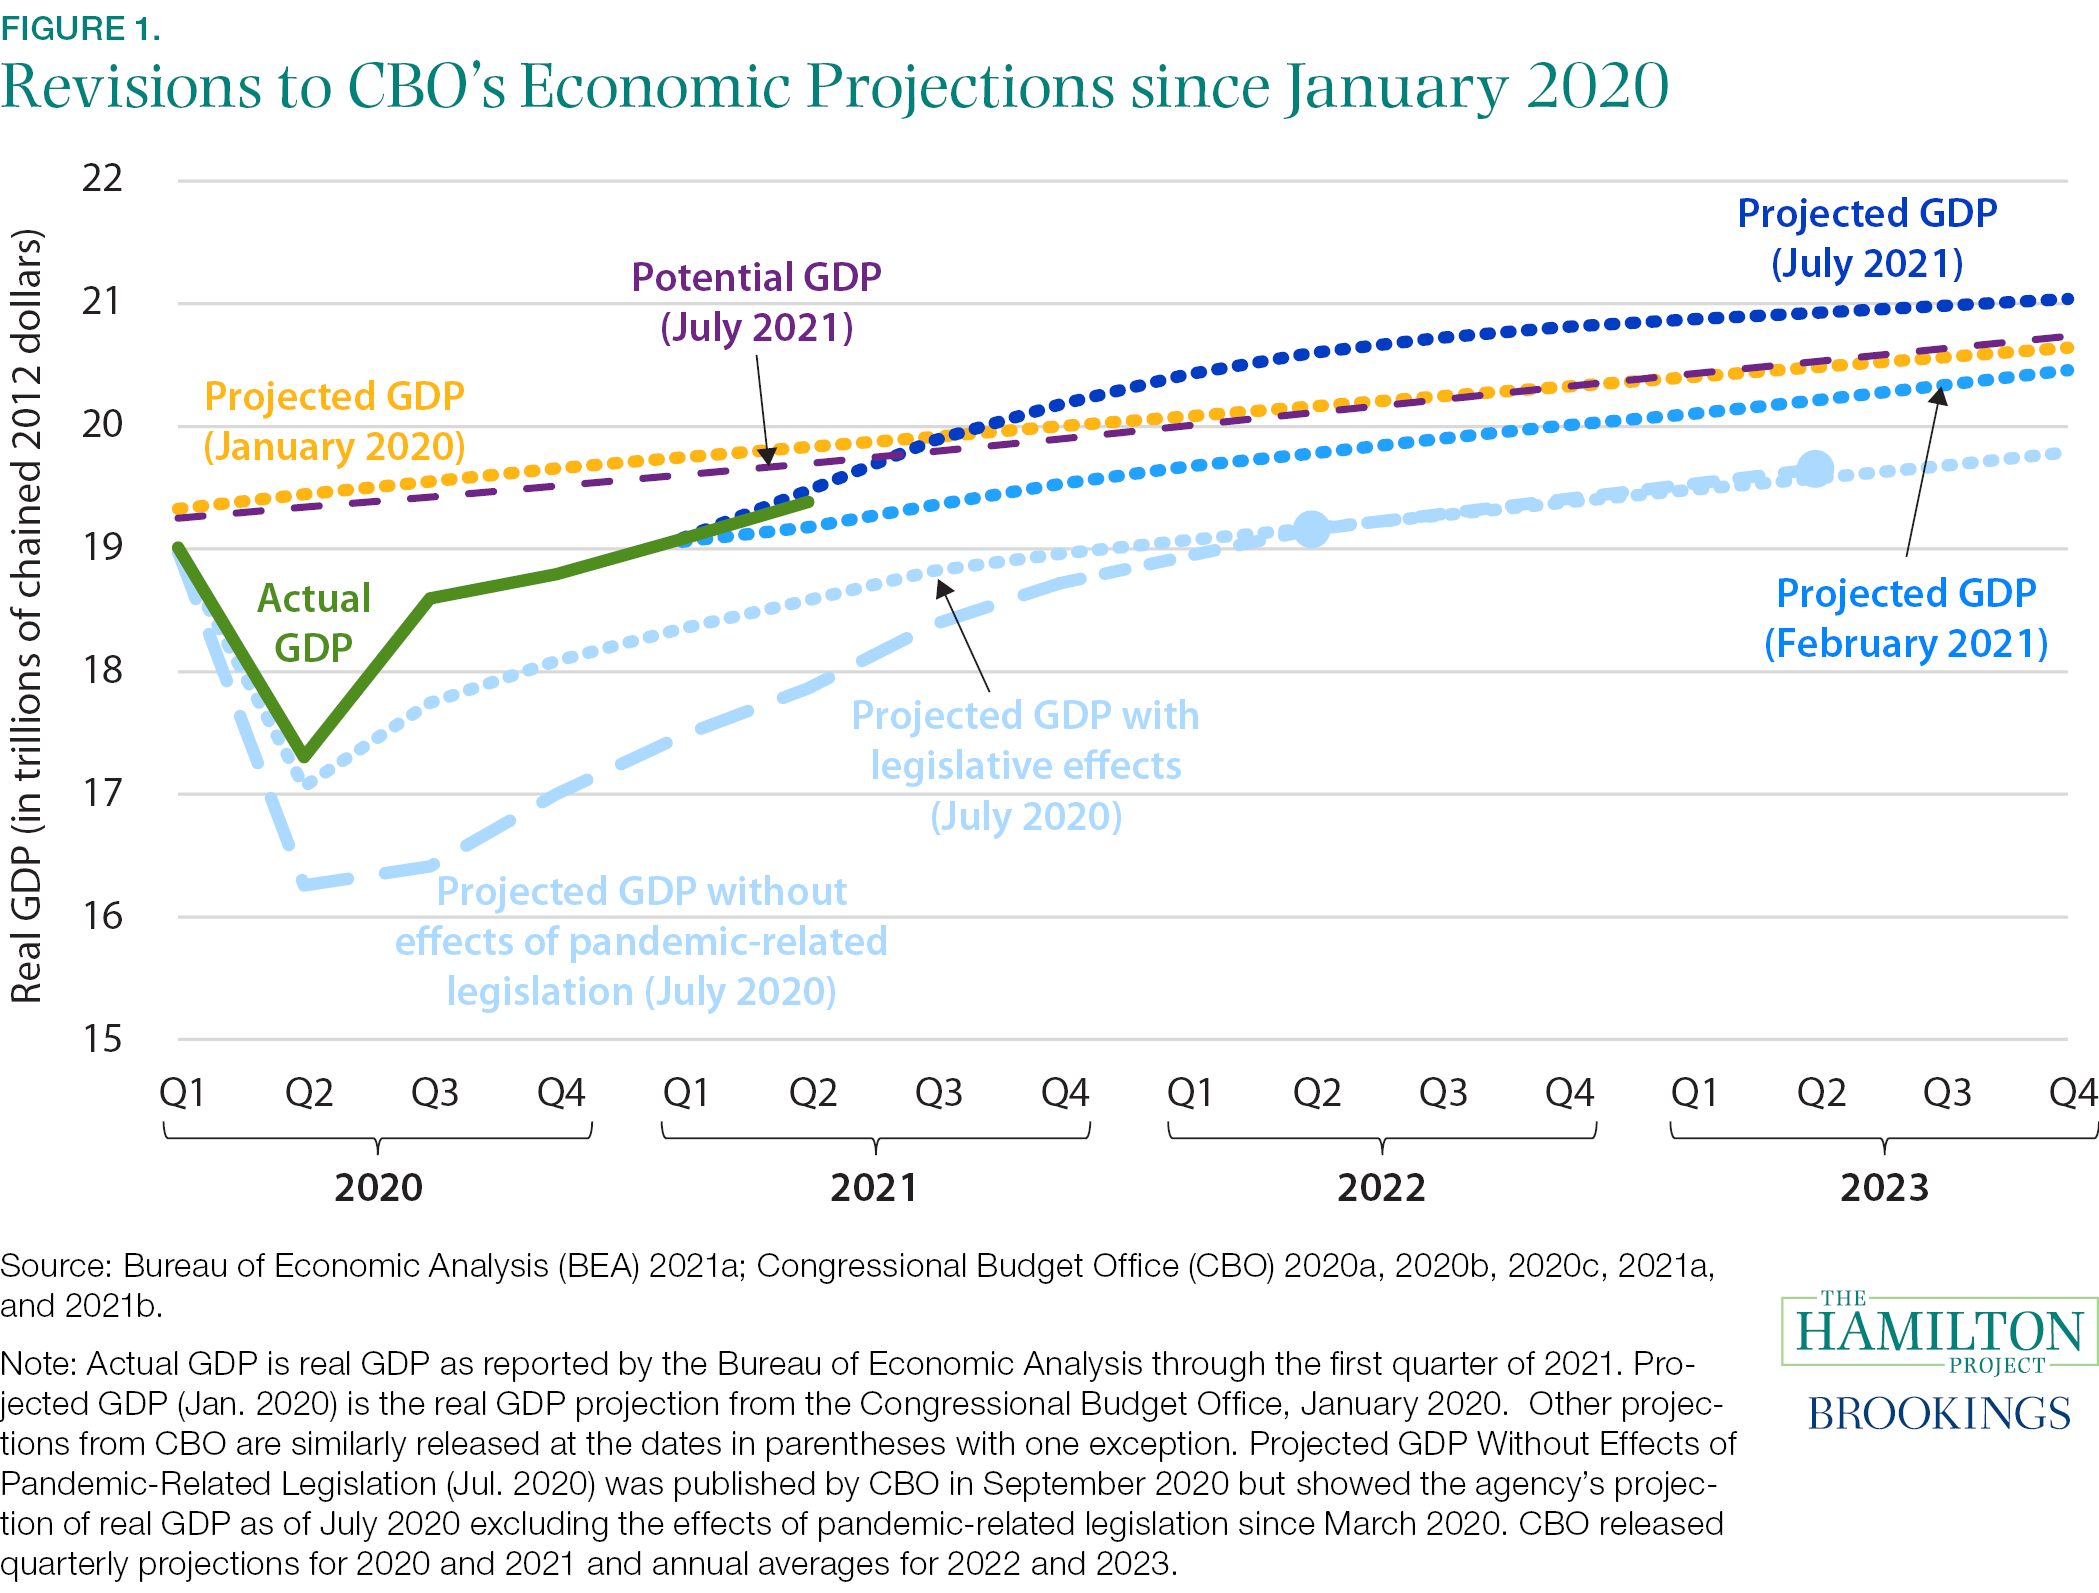
Since the economy hit bottom in the second quarter of 2020, economic growth has surpassed consensus expectations formed at the beginning of the pandemic. As a result, in the second quarter of 2021 real GDP exceeded its pre-pandemic level. With economic growth boosted by the ongoing effects of the fiscal support enacted by Congress in 2020 and 2021, pent-up demand from consumers for face-to-face services, and the strength in labor markets and asset prices, real GDP appears on track to grow at the rapid pace of roughly 6 percent in 2021. To be sure, the Delta variant threatens that projection. However, even in the initial stages of the pandemic, when people had far less information and fewer mitigation resources, consumer spending and overall economic activity was remarkably resilient.
The surprising strength in GDP and the improvements in expectations are evident from CBO’s upward revisions to its projections (shown in figure 1). In the third quarter of 2020 the level of GDP was 4.8 percent above the projection that CBO published at the beginning of that quarter. Moreover, since July 2020 CBO has revised up projected GDP for 2023 by nearly 7 percent, where the projected level of GDP at the end of 2023 is now 2 percent above CBO’s pre-pandemic forecast. Nonetheless, through 2023 the cumulative shortfall in real output relative to a pre-pandemic projection is expected to total about $400 billion in 2012 dollars (CBO 2020a, 2021c). Note that CBO’s projections show a soft landing, with real GDP showing only modest growth by late 2022. The slowdown could be more abrupt and painful than those projections suggest.
Fact 2: The sharp decline in employment in spring 2020, which was largely concentrated in the services sector, has only partially reversed.
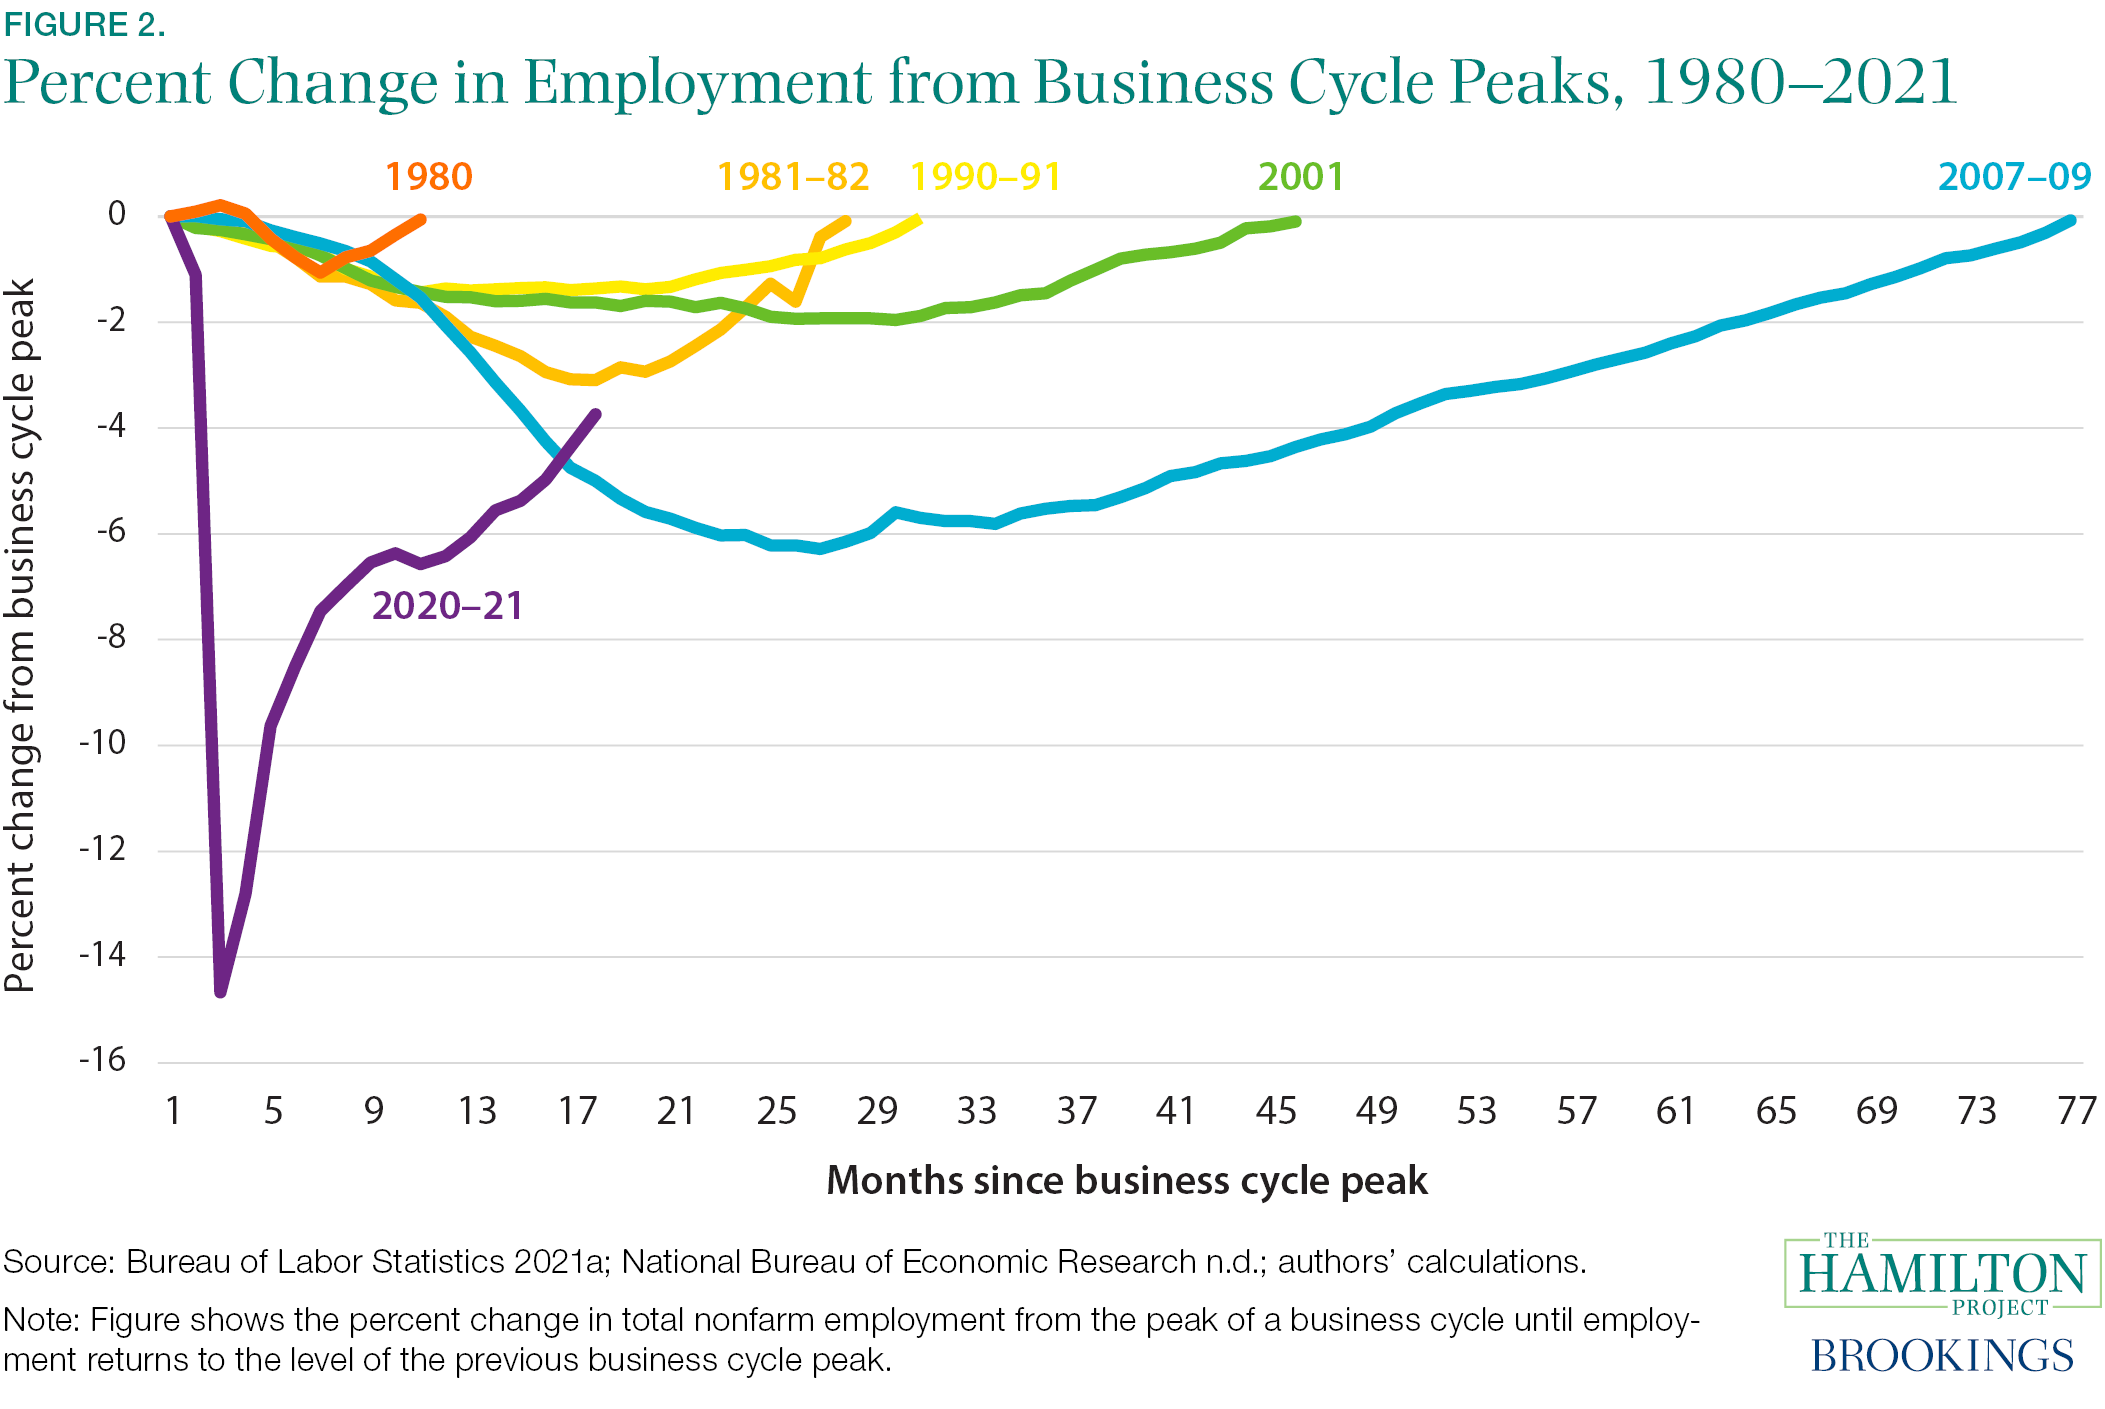
Figure 2 shows the percent difference in overall employment from the peak month prior to recent economic downturns through the month where employment recovered to its previous business cycle peak. Across the labor market, employment is still down 5.3 million from February 2020 and down about 9 million from where trends in employment were headed to prior to the pandemic.
From February to April of 2020, employment declines in the leisure and hospitality sector accounted for about 40 percent of the total 22 million jobs that were lost. Conversely, a partial recovery in that sector has fueled employment growth since then. Overall, from February through July of this year, monthly employment rose by more than 700,000 on average. In August that pace slowed significantly, however. The resurgence of the pandemic likely held back the recovery in the leisure and hospitality sector, which saw no net gain in employment in August. In that sector, employment is still down 1.7 million jobs from February 2020.
In comparison to previous recessions, the COVID-19 recession has been worse for the services sector relative to the goods sector. Consider the average outcomes across the four recessions from 1981 to 2019, 18 months from when the different recessions began: employment in the service sector was 1 percent below its pre-recession peak and employment in the goods sector was 10 percent below its peak. In contrast, as of August 2021 employment in the service sector was still 4 percent below its February 2020 level and employment in the goods sector was 3 percent below.
Fact 3: Millions of workers are no longer eligible for Unemployment Insurance.
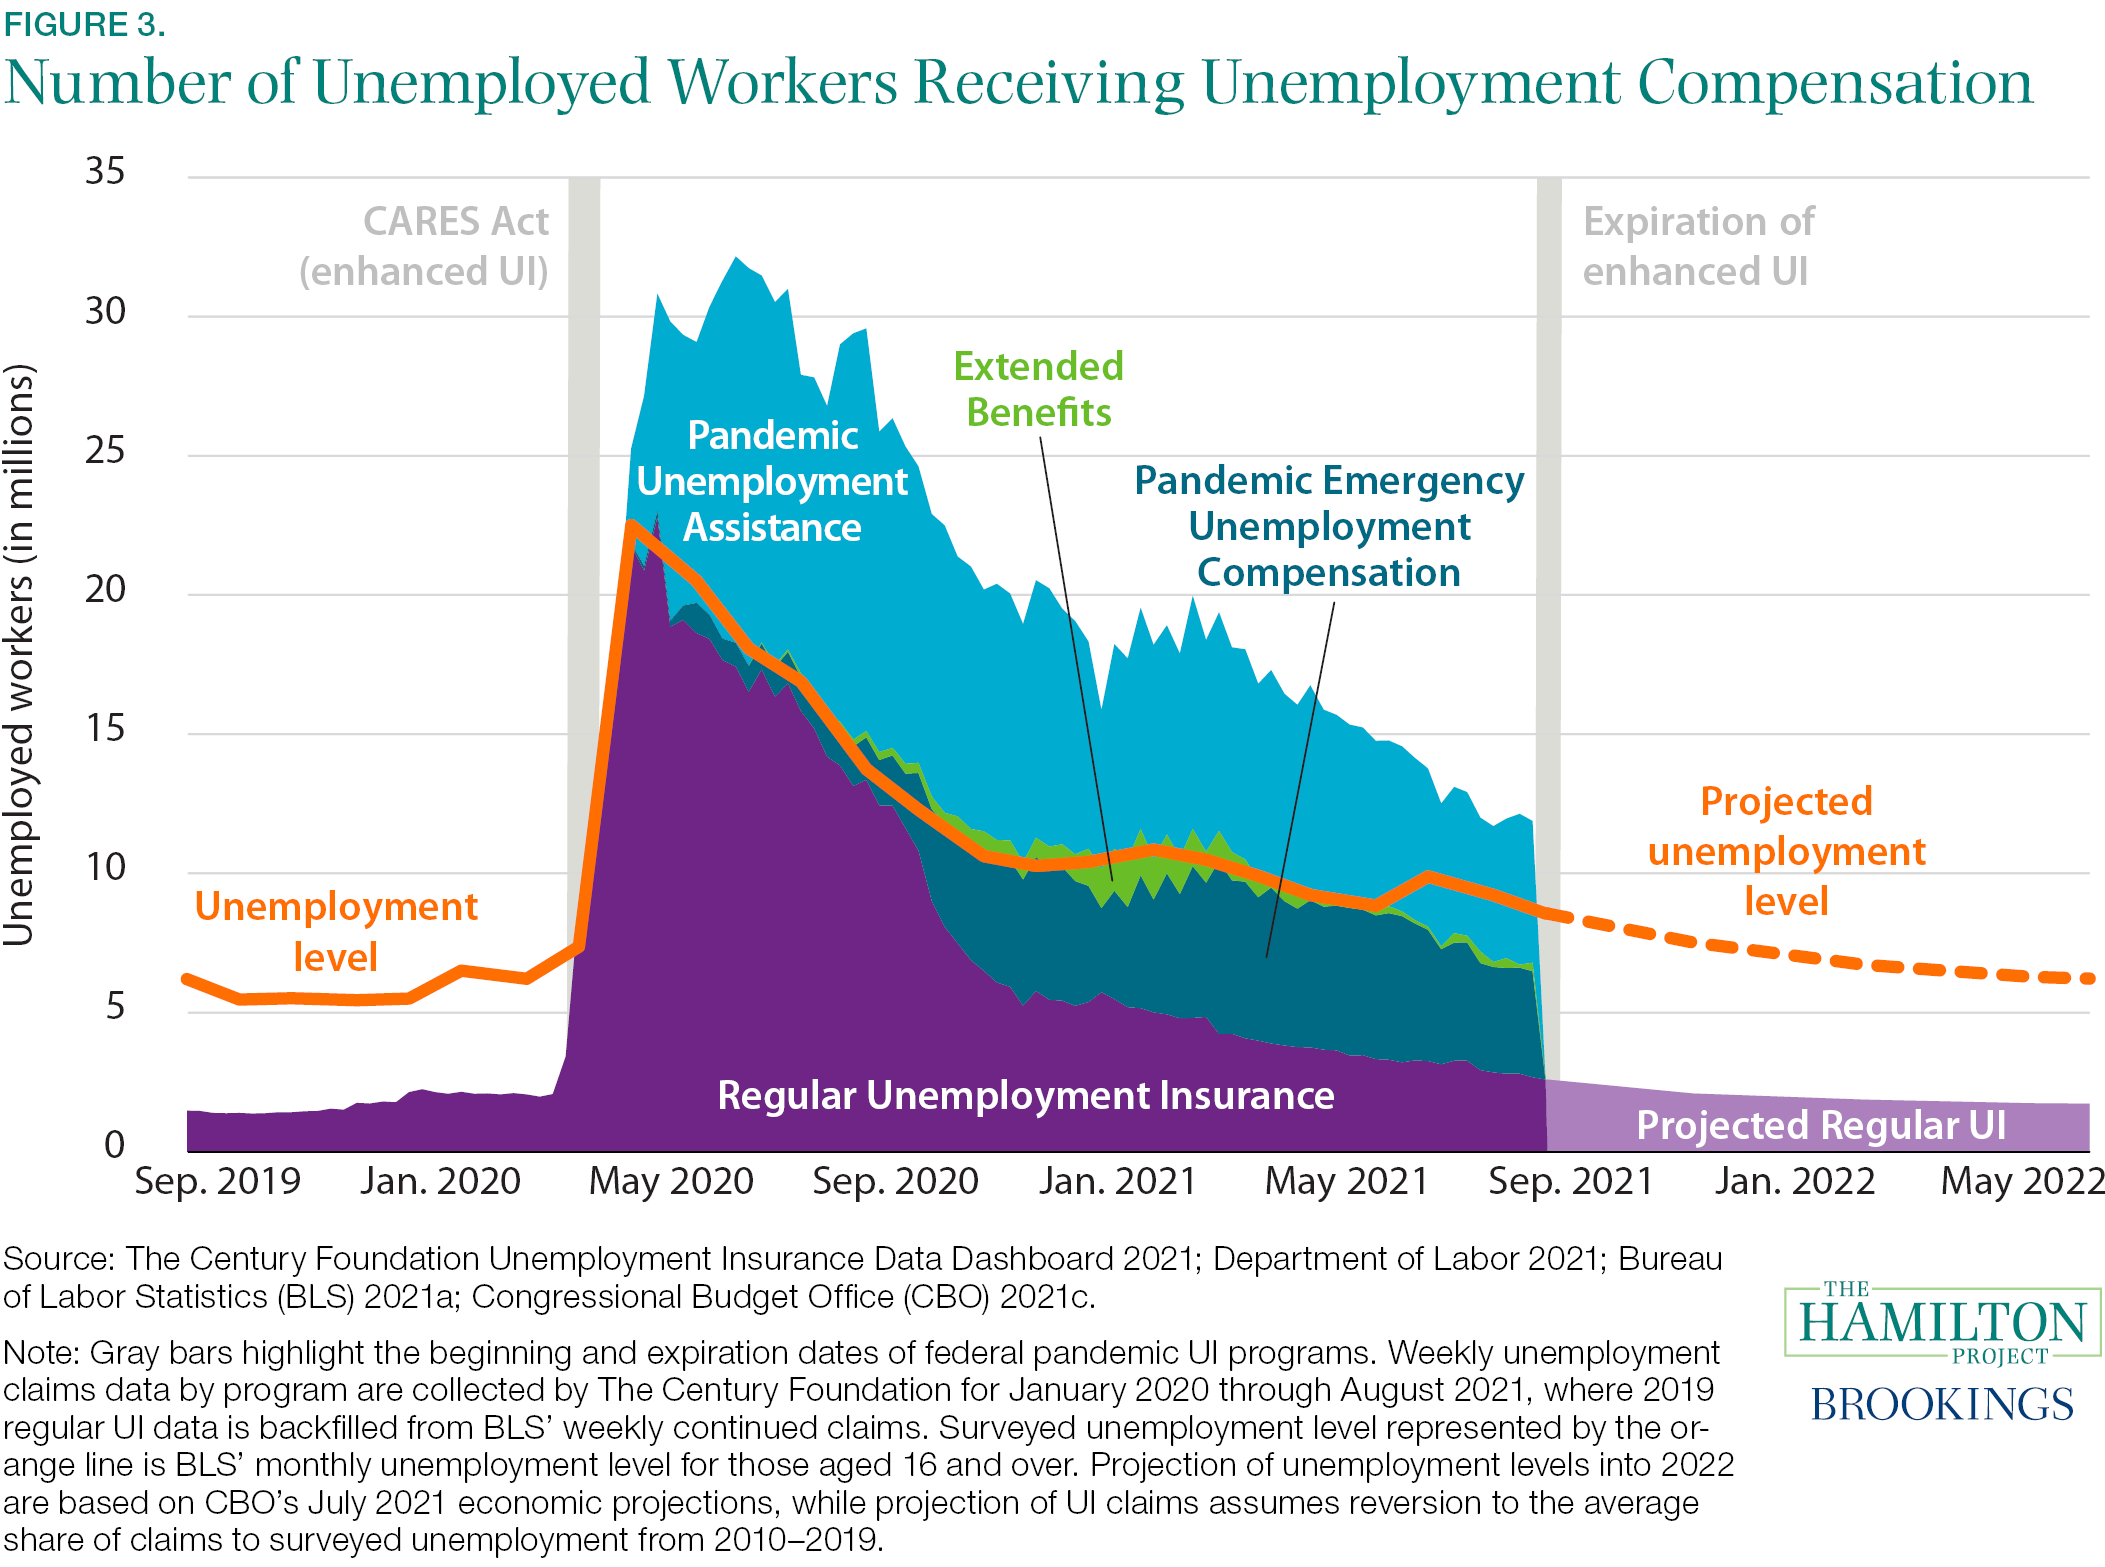
Over the summer of 2021 in some states, and in the first week of September 2021 in the remainder of states, enhanced UI expired. That set of policies had significantly expanded eligibility to workers not covered by regular UI (Pandemic Unemployment Assistance [PUA]), extended the number of weeks that a worker could receive UI (Pandemic Emergency Unemployment Compensation [PEUC]), and increased the generosity of benefits (Federal Pandemic Unemployment Compensation [FPUC]). Prior to the CARES Act, which created PUA, PEUC, and FPUC, only 30 percent of workers were eligible for unemployment compensation.
Figure 3 shows the total number of unemployed workers superimposed over weekly continued UI claims for regular UI benefits and Extended Benefits, which automatically extends weeks of eligibility based on a state’s economic conditions, as well as claims for emergency programs: PUA and PEUC.
Note that the level of unemployment greatly underestimates the number of people who lost jobs during the pandemic. To be described as officially unemployed, a person must be actively looking for work; however, millions of people effectively have left the labor force since March 2020 but were eligible for the expanded UI benefits. At the time that the emergency programs expired, there was a gap of more than 5.5 million workers who were in the labor market and unemployed, but not receiving UI. We project that gap to close only modestly through the end of this year.
Fiscal support has helped people prioritize their health over labor market income, which was certainly one of the goals when the support was put in place in the spring of 2020 and when it was reauthorized several times. Preliminary analysis suggests that UI generosity had a modest effect on recipients’ job-finding rates (Petrosky-Nadeau and Valletta 2021). Nonetheless, we see no compelling evidence that the cancellation of those benefits so far has led to significant increases in aggregate employment (Coombs et al. 2021; Pardue 2021). On the other hand, the abrupt elimination of access to UI benefits for millions of people creates financial hardship for those who are unable to work owing to health risks or other constraints.
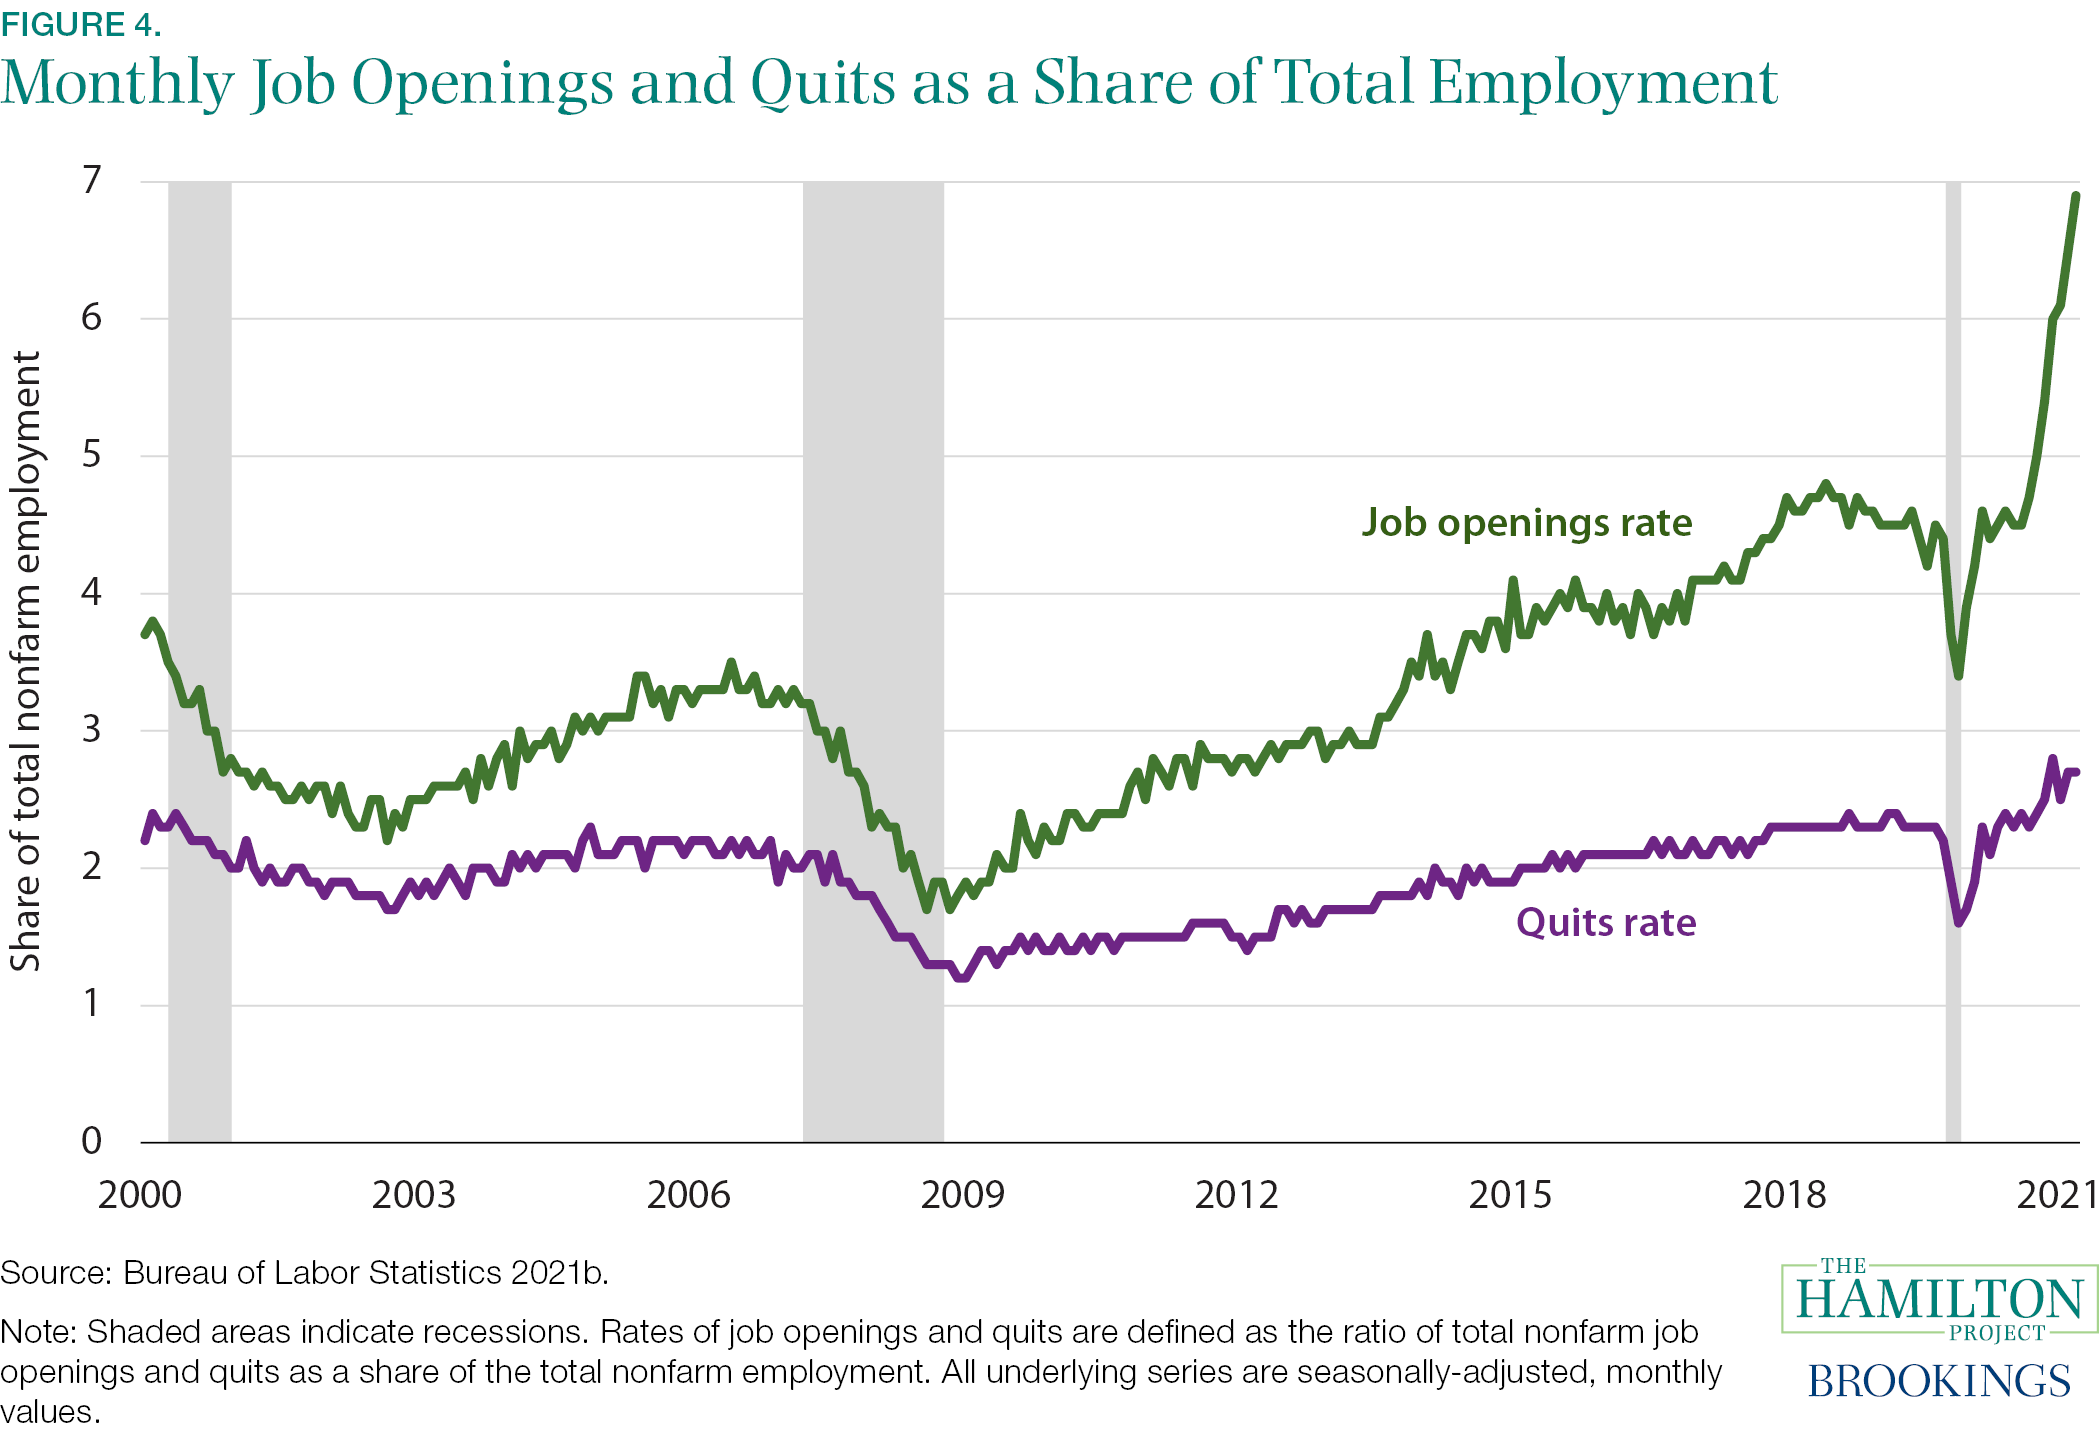
Fact 4: The number of job openings and the number of workers quitting their jobs is higher now than in the past 20 years.
Despite job openings being their highest since the end of 2000 (the earliest available data), several factors are holding down employment gains. One factor is that the share of workers quitting jobs each month is at a series high. As figure 4 shows, the quit rate generally moves with the job opening rate, since workers are more likely to switch jobs in a strong labor market. Moreover, in the current environment the composition of labor demand is changing, and workers may be taking time to move from temporary jobs they took during the pandemic. Taken together, record job openings, the slowness of job matching, and the depressed level of labor force participation has created wage pressure, particularly for workers in the service sector, for younger workers, and for workers with less formal education.
In addition to the depressed rate of job matching, also worrying is the lack of recovery in the labor force participation rate, which is the share of the population working or actively seeking work. That rate fell from 63 percent to 60 percent between February and April of last year, when nearly 8 million workers left the labor force. The participation rate recovered about halfway by June 2020, but has remained stubbornly depressed since then.
Factors unique to the pandemic have disproportionately affected labor force participation among certain groups even if these changes do not meaningfully affect aggregate levels (Furman, Kearney, and Powell 2021). For example, among mothers of elementary school–aged children—which is the demographic likely bearing the brunt of school closures (Amuedo-Dorantes et al. 2020)—the share that is employed fell more than that of mothers who did not have children in elementary school (Bauer, Dube, et al. 2021). Consequently, addressing the child-care crisis moves in the right direction but will not on its own make up the ground that has been lost in aggregate labor force participation.
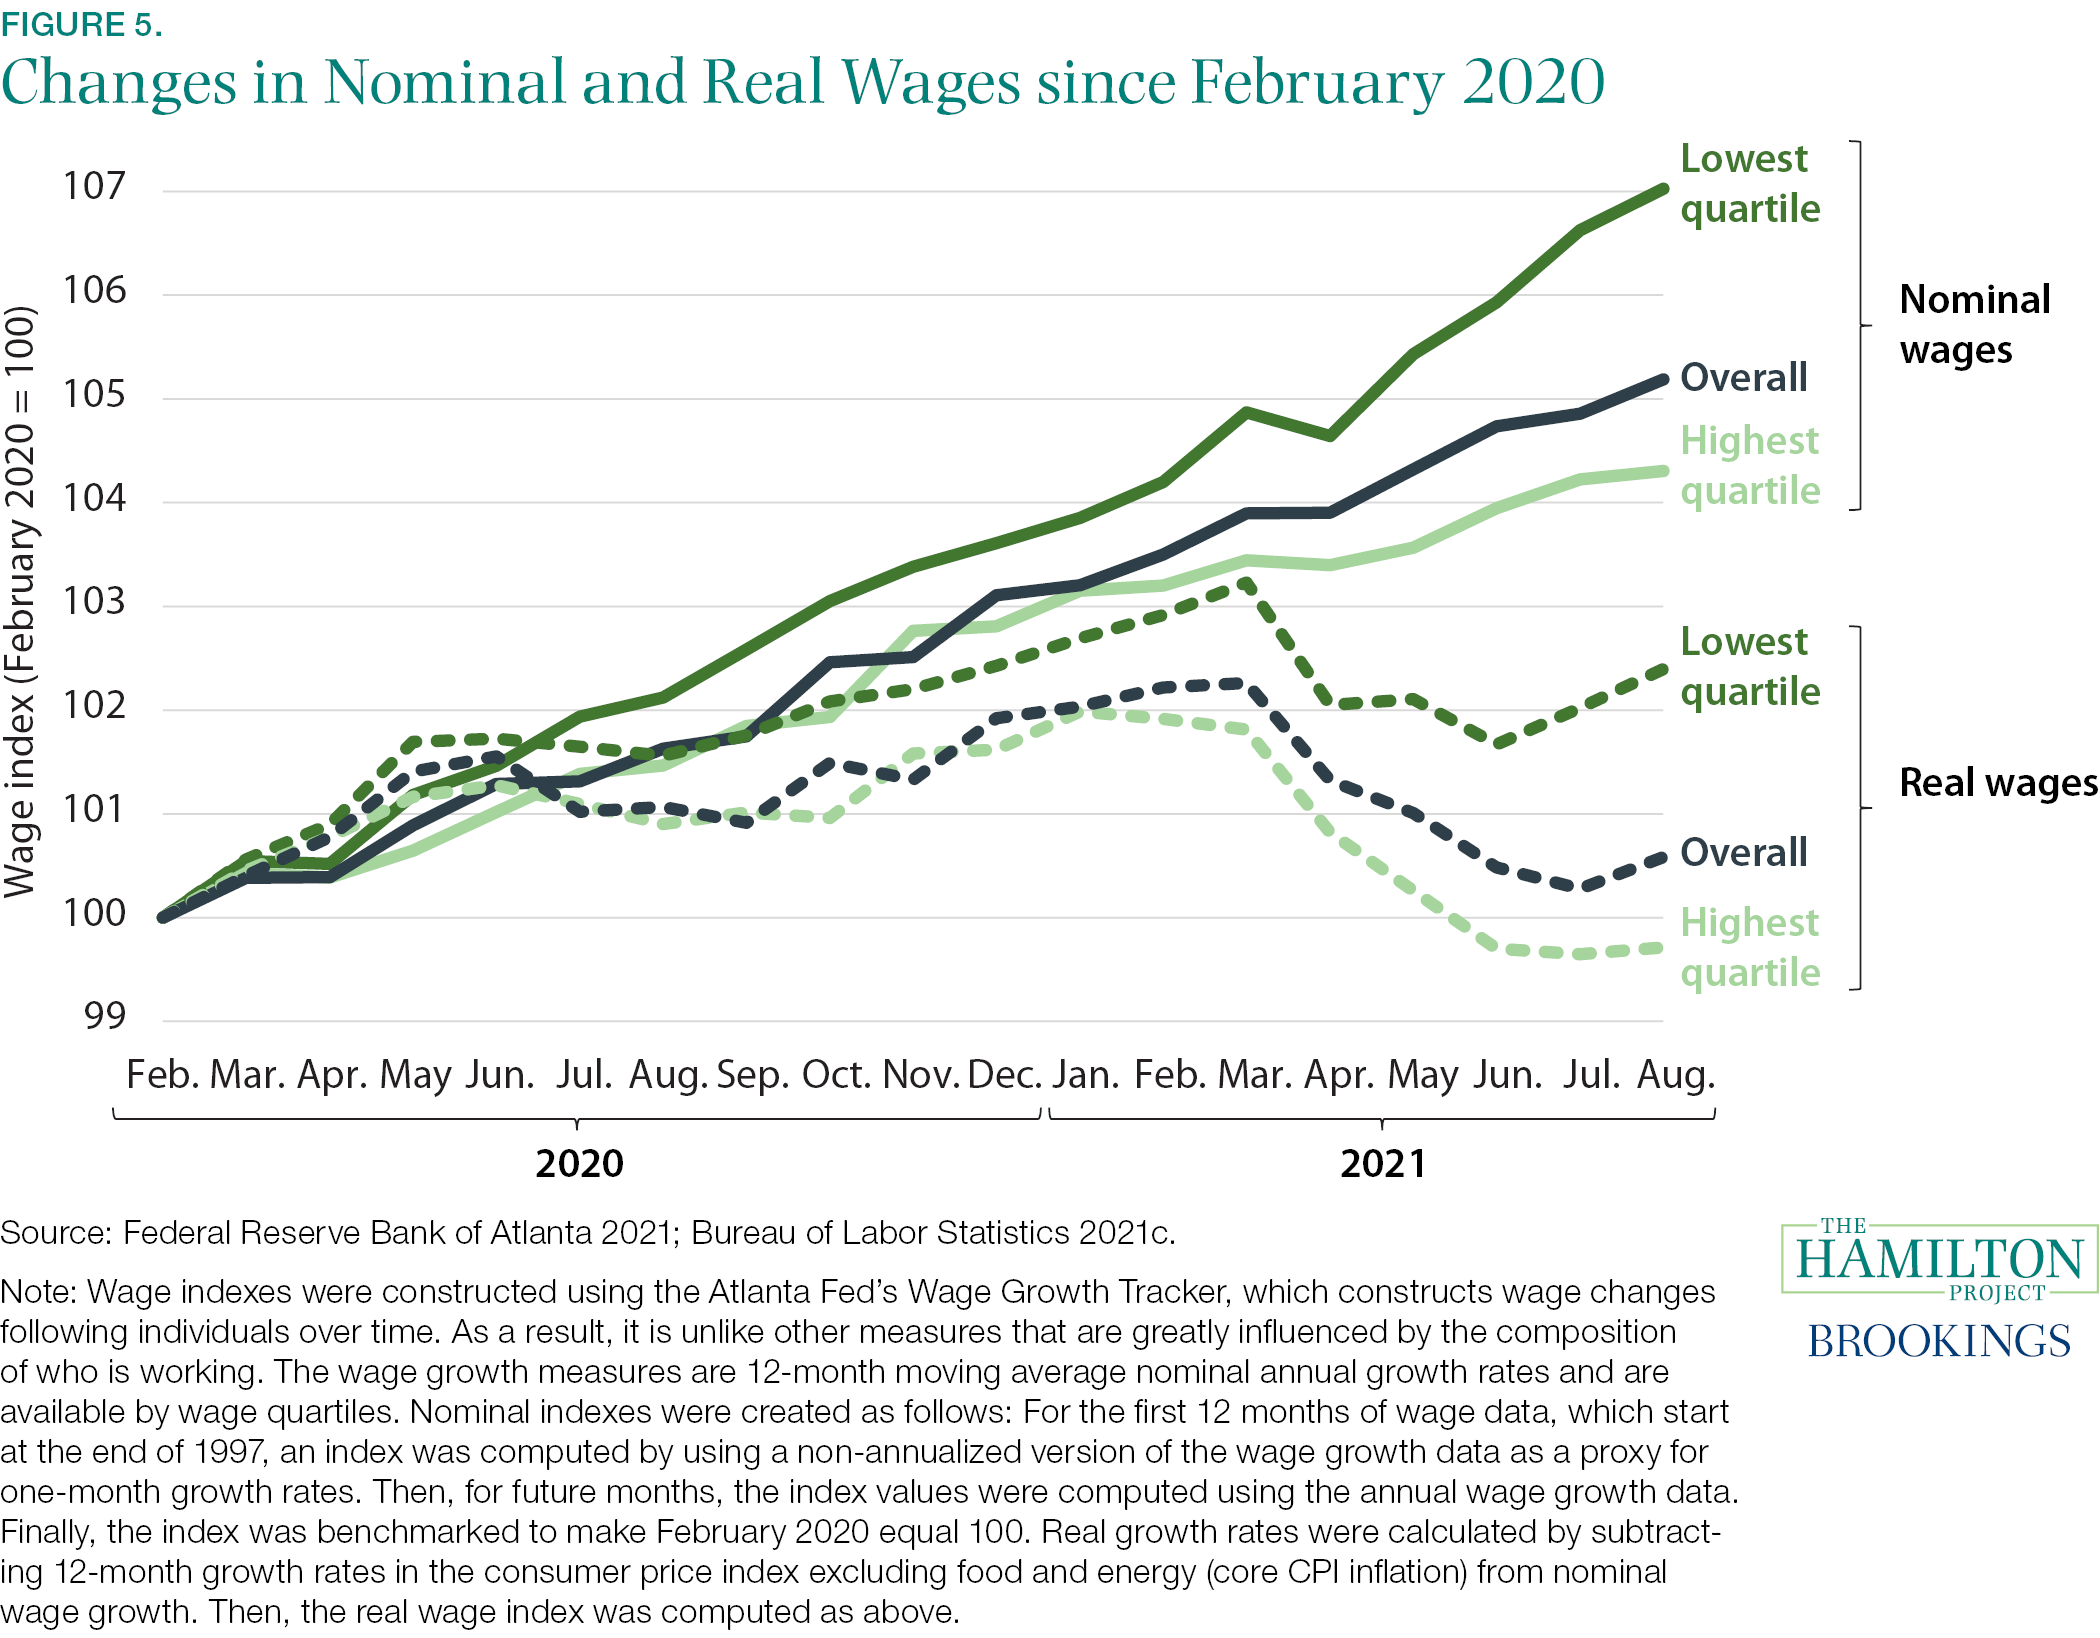
Fact 5: Even with recent jumps in inflation, lower income workers are seeing increases in real wages.
Upward pressure on wages has been good news, particularly for low-income workers and workers in certain industries. As shown in figure 5, wages for those in the bottom quartile of the wage distribution are up 7.0 percent from their pre-pandemic level, or 4.6 percent at an annual rate. That rate of growth is close to what that group experienced in 2019, when the consensus held that the labor market was relatively tight. Some sectors have seen particularly strong wage gains. For example, over the past 12 months average hourly earnings in the leisure and hospitality sector have grown nearly twice as fast as the overall private industry average. Other sectors seeing strong gains in hourly earnings include retail trade, transportation and warehousing, and financial activities.
Because of recent increases in the rate of inflation, workers’ purchasing power is not rising as fast as nominal wages. Price increases in recent months led to declines in real wages from March to June 2021. Those declines partly offset increases in real wages earlier in the pandemic for wage-earners in the bottom quartile, when inflation was soft and nominal wages were rising. In July and August real wages for that group notably accelerated. Overall, from February 2020 to August 2021 real wages for the bottom quartile have risen 2.4 percent, or 1.6 percent at an annual rate. That is considerably below the rate we saw in 2019 when real wage growth was 2.4 percent at an annual rate for the bottom quartile. Moreover, real wages are roughly unchanged for those in the highest quartile, in contrast to a gain of 0.8 percent in 2019.
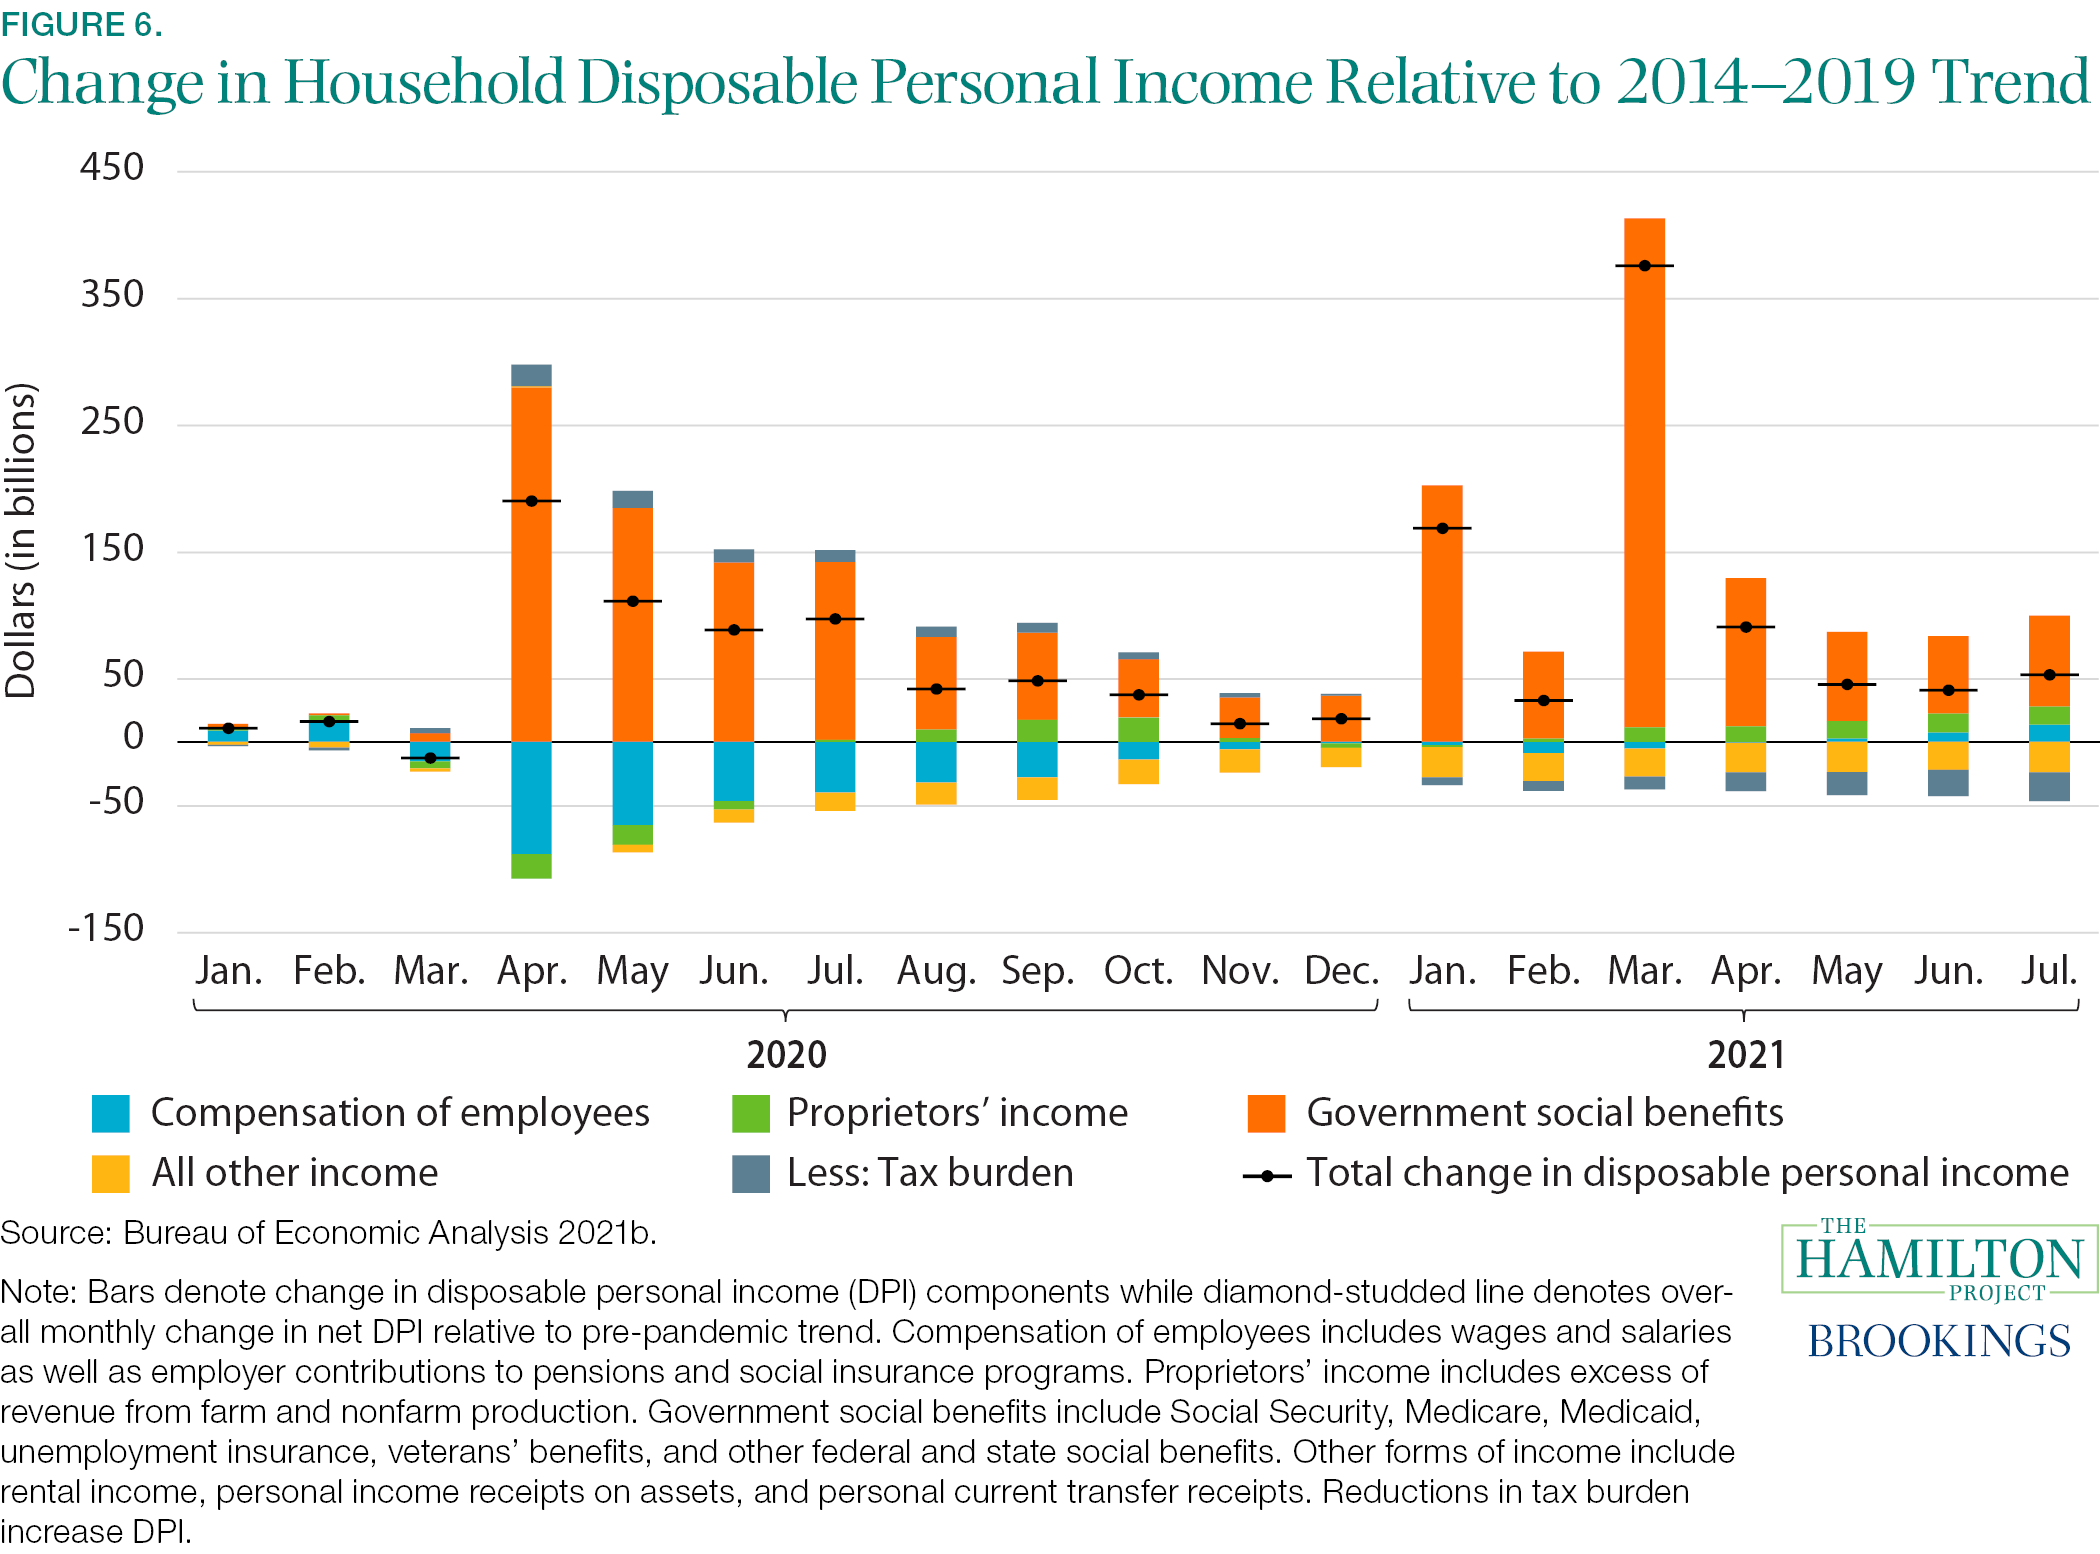
Fact 6: Post-pandemic, income after government taxes and transfers, as well as household saving, have been above their recent trends.
Disposable personal income (DPI, or total aftertax income) in 2020 and so far in 2021 has been higher than if DPI had simply grown at its trend rate of the previous five years. In aggregate, DPI has so far been higher than trend by a total of $1.4 trillion since the start of the pandemic.
In 2020 weak aggregate compensation of employees was more than offset by a sharp increase in government benefits, leaving total DPI a cumulative $630 billion above its trend level over the course of that year (figure 6). As a result of additional dispensation of government social benefits to households in January and March of this year, DPI has been higher, on average, by about $115 billion each month since January than if it had grown at its trend pace. Since March of this year those benefits have come down sharply but remain elevated. Under current law, the boost to DPI should fully wane by early next year. (See Alcala Kovalski et al. 2021 for related information about the waning fiscal support.)
As a result of the significant boosts to DPI and restrained services spending during the pandemic, aggregate household saving has skyrocketed. In every month from March 2020 through April of this year, the rate of saving was higher than in the past four decades; in some months it was roughly double the previous post–World War II peak. In total, households have roughly $2.5 trillion more in savings than if DPI and spending had grown in line with trend rates in the five years prior to the pandemic. Moreover, home prices and stock market prices have surged, leading to large increases in household wealth. Those resources will help to finance the pent-up demand for forgone spending. Ultimately, households will view the increase in savings and wealth as financial resources to support long-term, relatively steady consumer spending.
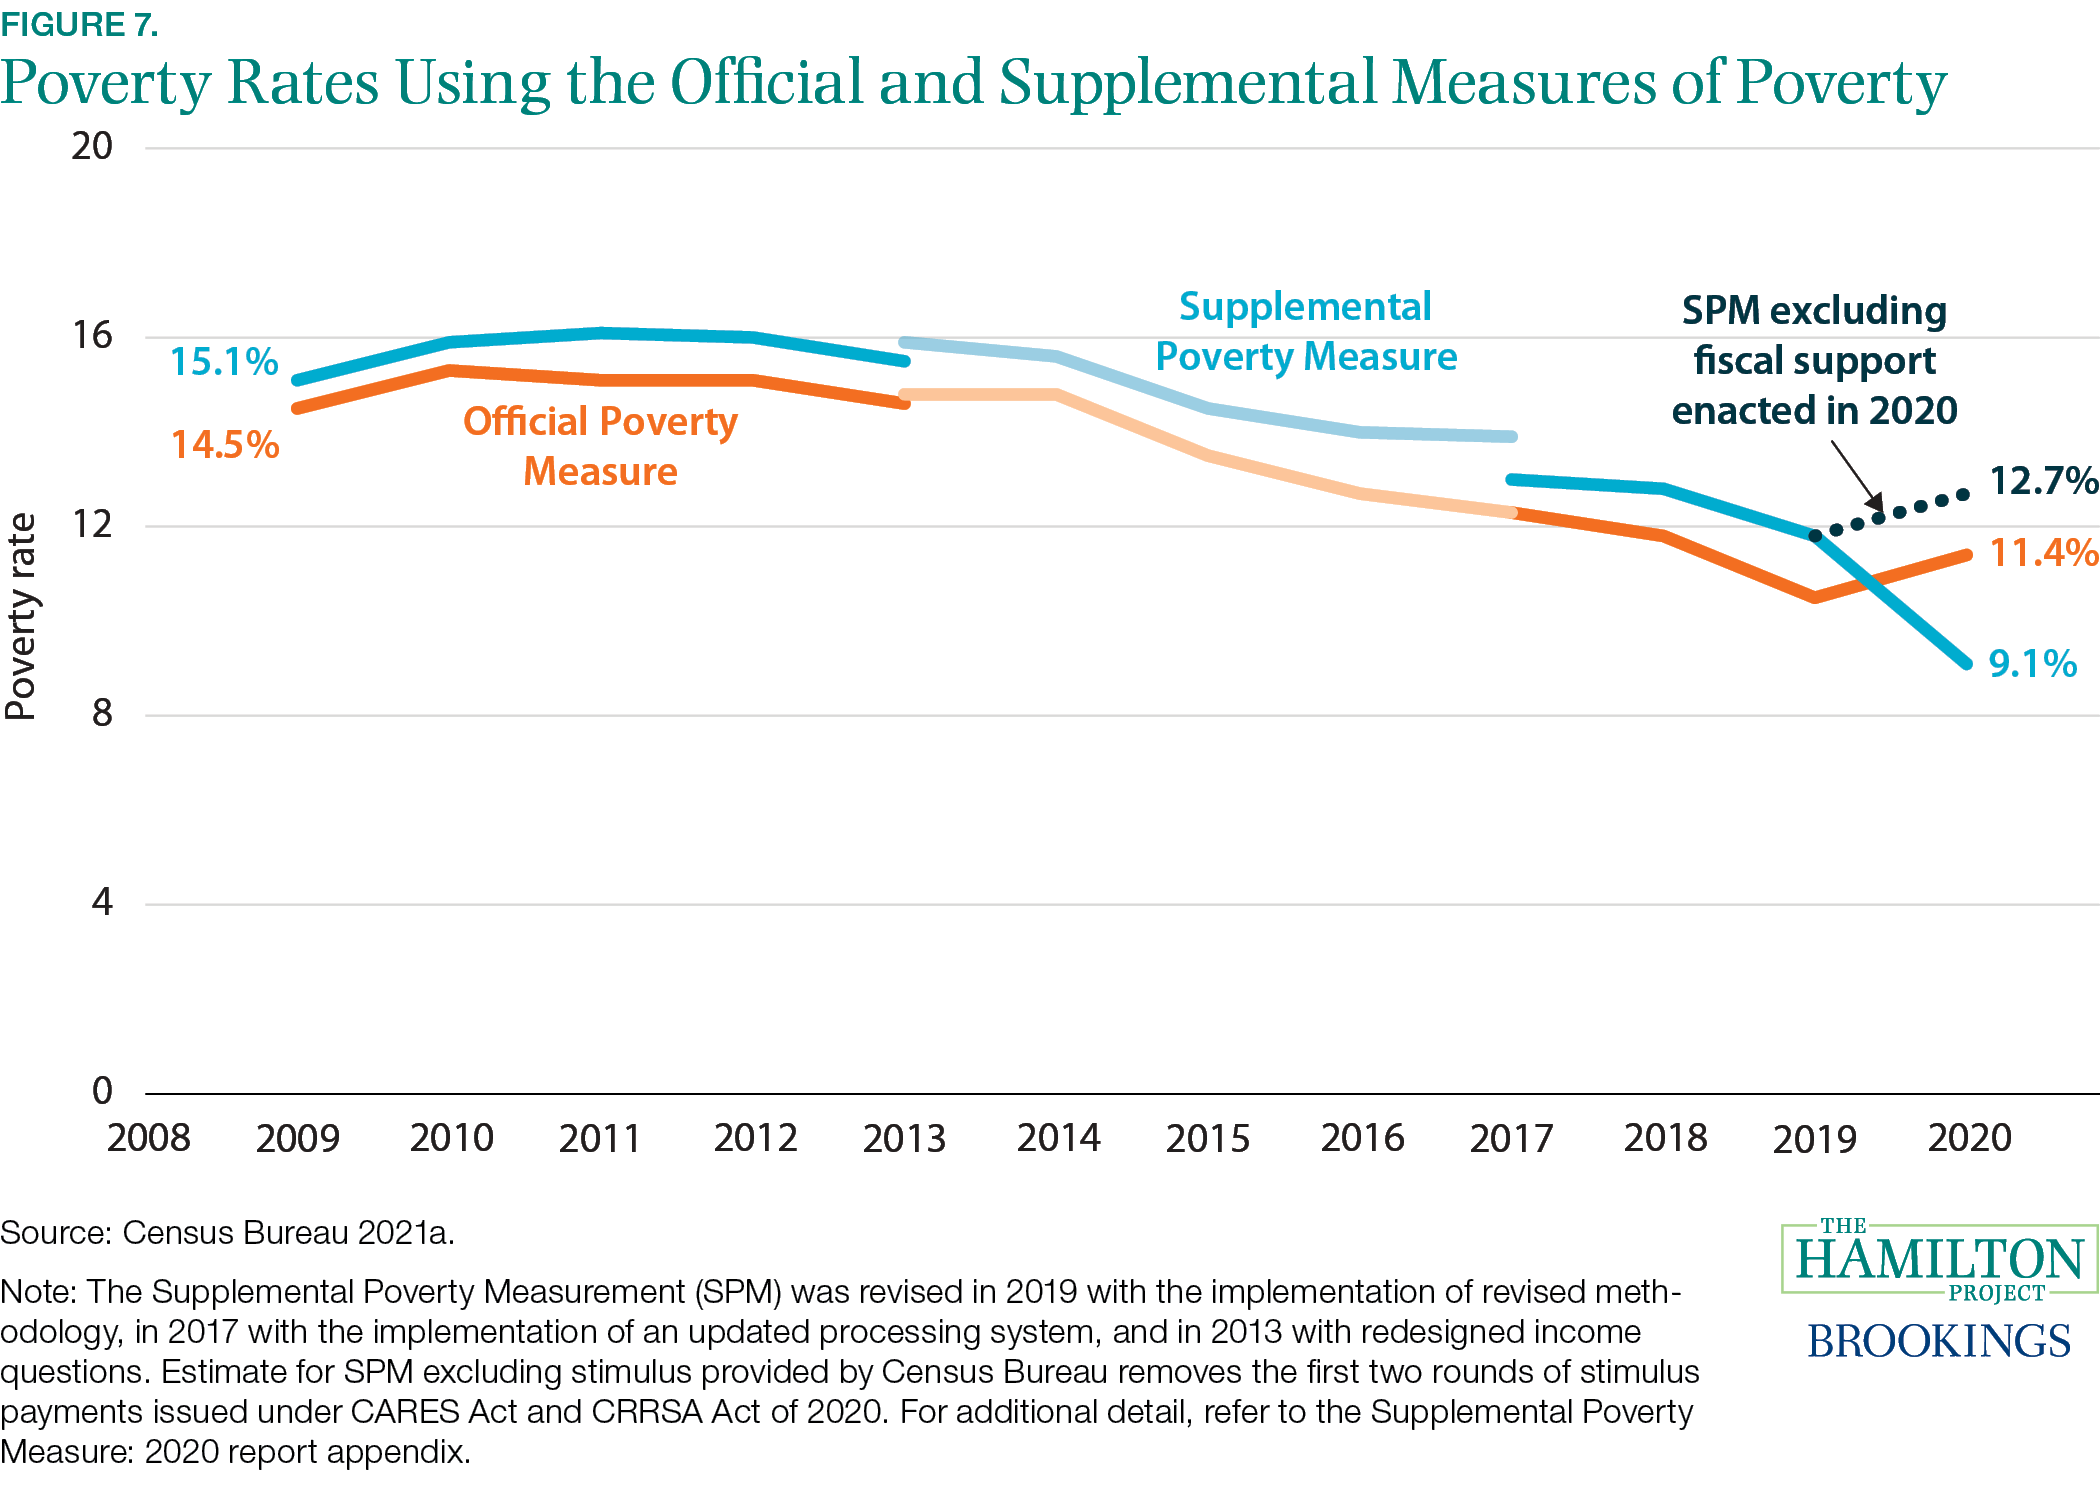
Fact 7: Fiscal support led to a reduction in poverty in 2020.
By the Official Poverty Measure (OPM), poverty increased from 10.5 percent to 11.4 percent from 2019 to 2020. After taking into account the enormous fiscal support provided to households in 2020, the percentage of the US population in poverty, as measured by the Supplemental Poverty Measure (SPM), fell from 12 percent to 9 percent (figure 7). While poverty as measured by the SPM is typically lower than OPM for children, 2020 was the first time that SPM was lower than the OPM overall.
The two policies that had the most significant effects relative to earlier years, because they were the most changed from prior policy, were the expansion of unemployment compensation and checks to households. If Congress had not enacted relief for families, SPM poverty would have risen to 12.7 percent rather than falling to 9.1 percent.
Another factor behind the decrease in poverty was the relatively strong wage growth for those at the bottom of the income distribution who remained employed (see fact 5). Notably, those wage gains came on the heels of strong wage growth in 2018 and 2019, when the tight labor market benefited lower-wage workers.
In 2021 continued fiscal support—particularly the full refundability of and the increase in the child tax credit and increases to the Supplemental Nutrition Assistance Program (SNAP) maximum benefit—as well as the continued labor market recovery should help to lift households out of poverty. Sustained progress in reducing post-tax-and-transfer poverty as measured in the SPM is possible through making permanent some of the policies enacted to counter the COVID-19 recession.
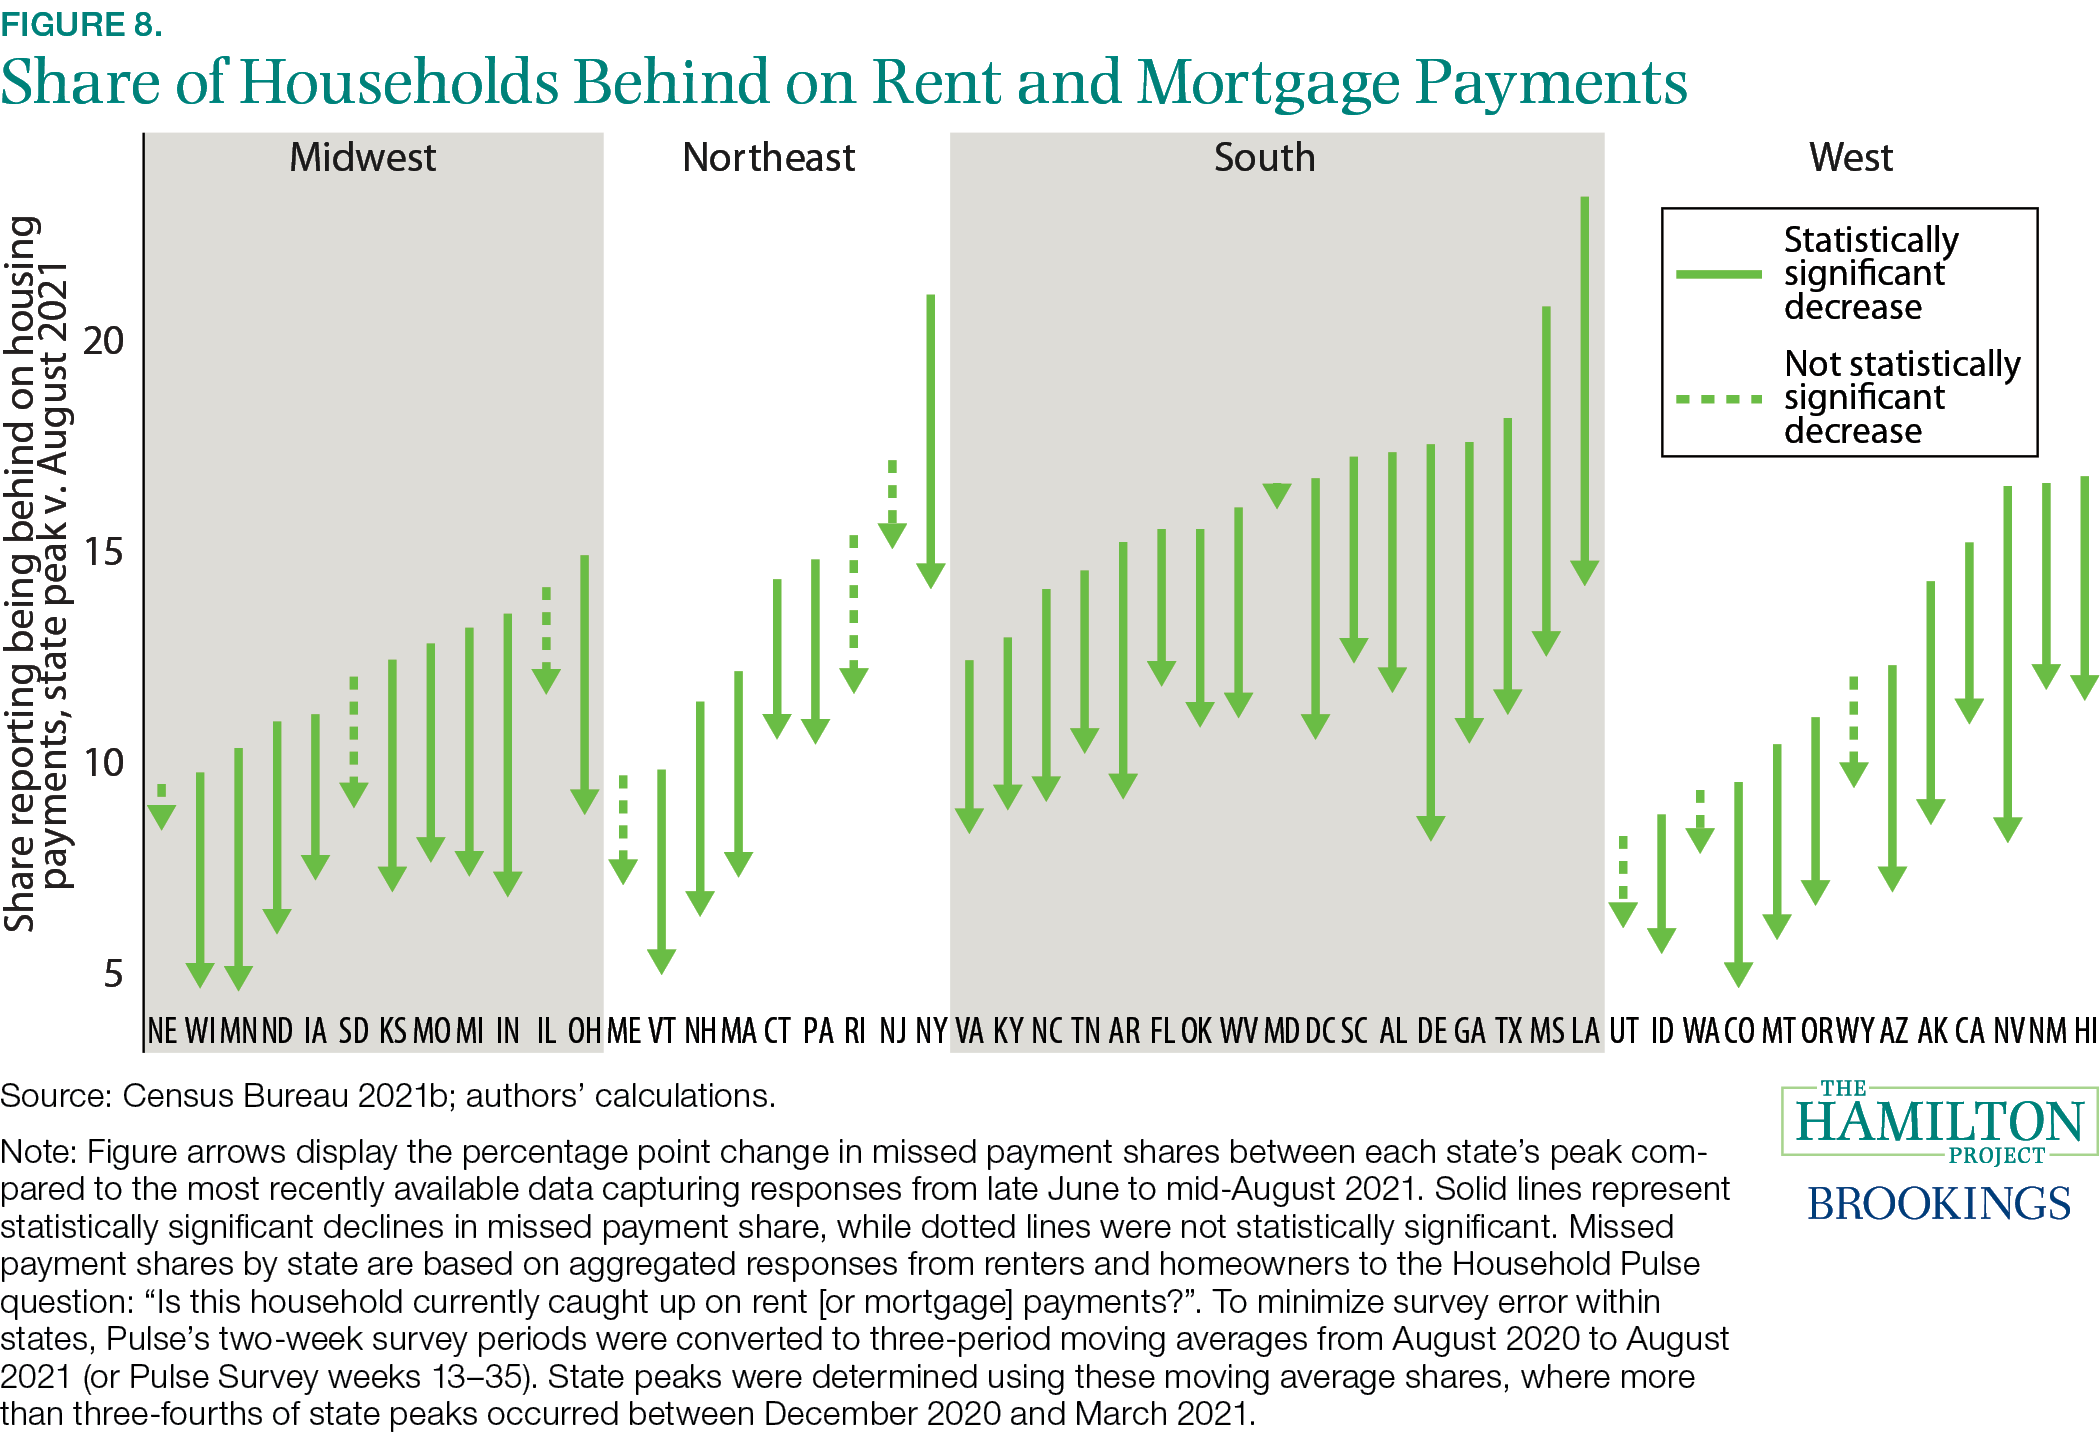
Fact 8: To date, 36 states have made progress in catching up on delinquent rent and mortgage payments.
To help Americans struggling to make mortgage and rent payments in the midst of a sharp contraction in labor income in the spring of 2020, policymakers put in place several relief programs. Those programs initially took the form of foreclosure and eviction moratoria and later also included financial support.
Delinquent mortgage borrowers experiencing economic hardships related to the pandemic, who had a federally backed mortgage, which includes mortgages backed by Federal Housing Administration, Veterans Administration, Fannie Mae, and Freddie Mac loans, were automatically eligible for forbearance through September 30, 2021. The government put in place help for mortgage servicers who are generally required to make payments to investors regardless of whether borrowers are delinquent. According to the Federal Reserve Bank of New York, forbearance plans disproportionately benefitted low-income borrowers, especially those holding FHA-insured loans and those living in disadvantaged neighborhoods (Haughwout, Lee, Scally, and van der Klaauw 2021). In addition, Congress’s American Rescue Plan provided nearly $10 billion to help homeowners who were behind on their mortgage and utility payments.
The federal eviction moratorium expired in August 2021, although some states have extended such protections. The federal government has allocated $46.5 billion in relief to help renters make their back payments and to help landlords who are owed those payments. State and local grantees had provided only $5.1 billion of the first $25 billion allocated for emergency rental assistance through July 2021 and news reports (Siegel 2021) suggest distribution of aid continues to be slow, even with recent US Department of the Treasury (2021) guidance to expedite delivery. With regard to the money that was distributed in the first quarter of 2021, more than 60 percent of households who received aid had household incomes under 30 percent of typical incomes in their geographic area.
Nonetheless, the broader fiscal support and the partial recovery in the labor market has helped to reduce the number of people who are behind on their payments. Figure 8 shows how much progress has been made in getting caught up on rent or mortgage payments by state, from each state’s peak to the most recent data spanning July and August. Three-quarters of the states reached their highest share of missed rent or mortgage between December 2020 and March 2021. Since peaking, the share of residents who reported missing rent or mortgage payments is lower in 36 states by statistically significant amounts.
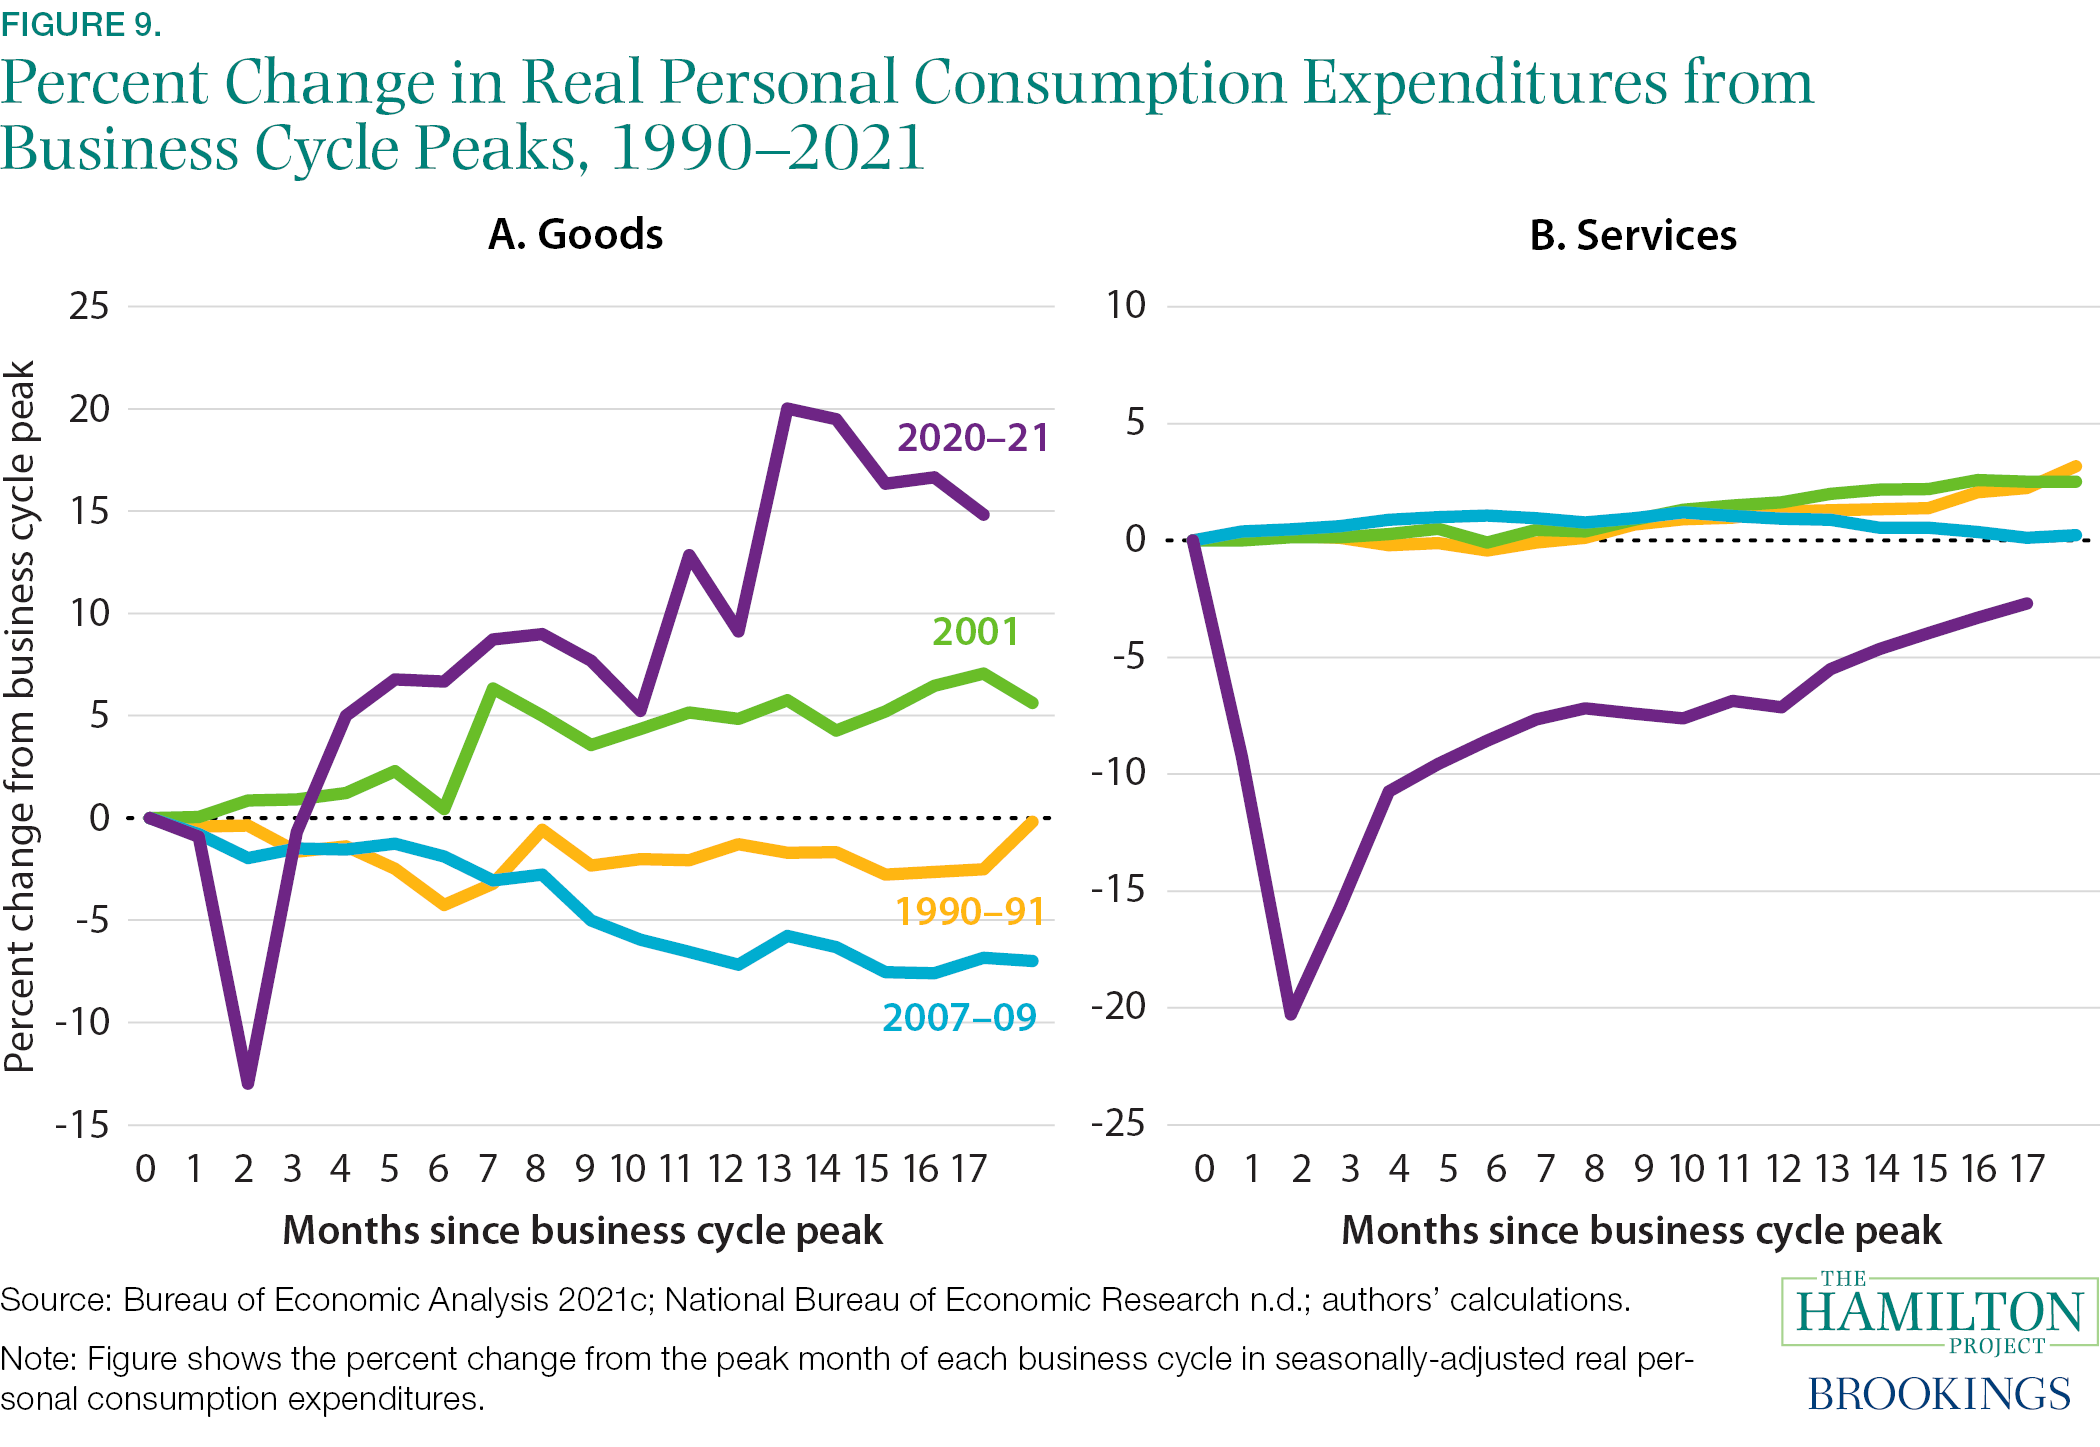
Fact 9: The strength in durable goods spending and weakness in spending on consumer services stands in sharp contrast to previous recoveries.
Together, social distancing and substantial support to households led to a surge in spending on durable goods even as households curtailed spending on services—a dramatic departure from behavior in more-typical recessions. As shown in figure 9a, overall real spending on goods initially sank 13 percent from February to April of 2020, but then quickly rose and had exceeded its pre-pandemic level by June. This rise included purchases such as vehicles, household furniture, and recreational equipment; after adjusting for inflation, so far in 2021 purchases of those durable goods have averaged 25 percent higher than pre-pandemic spending. In contrast, spending on services—many of those being face-to-face transactions such as live entertainment and dining at restaurants—fell steeply during the pandemic. Real services spending dropped more than 20 percent in the spring of 2020 and has yet to recover to pre-pandemic levels.
These patterns diverge from prior recessions. In most prior recessions, spending on durable goods remains subdued for an extended period, as in the case of the Great Recession where 18 months into the recovery, goods expenditures remained 7 percent below the pre-recession peak. In addition, figure 9b shows that, in each of the prior three recessions, spending on services temporarily plateaued in the first year of recovery before resuming growth. But in none of these prior recessions did services dip below their pre-recession levels for any sustained period—another sign of the uniqueness of the COVID-19 recession.
In recent months, demand has begun shifting back toward services as people begin resuming normal activities. From March to July, goods purchases declined moderately, while spending on services climbed 3 percent; notably, spending on live entertainment, hotels, and public transportation collectively increased by 35 percent over those four months.
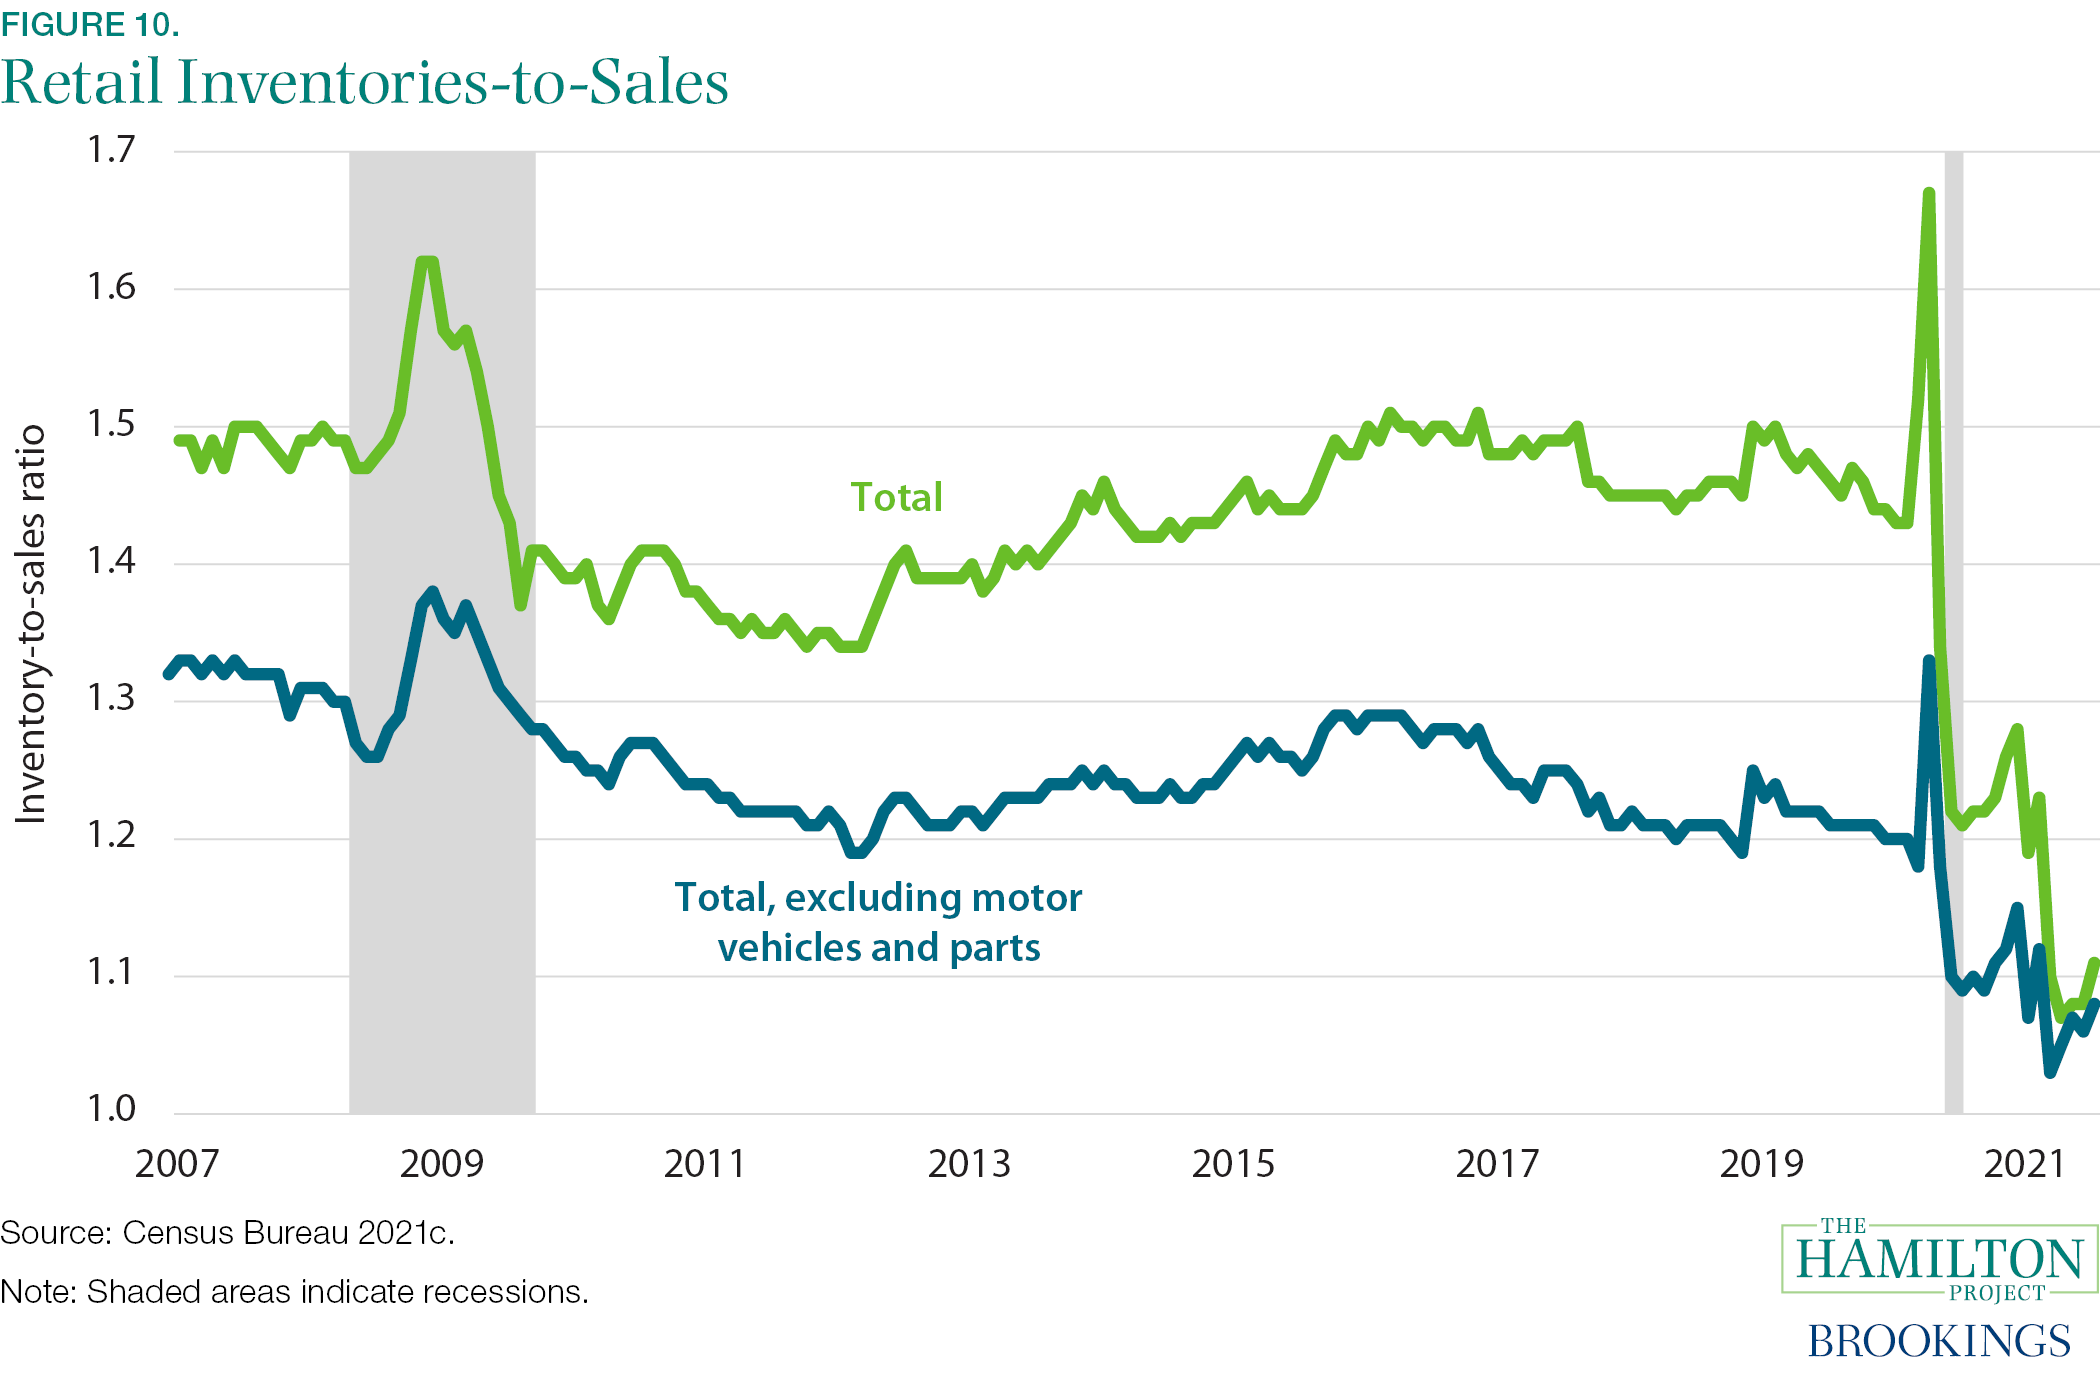
Fact 10: Retail inventories are unsustainably low.
Through August 2021, much of the consumer demand for goods has been met by drawdowns of inventory. As shown in figure 10, the retail inventory-to-sales ratio spiked at the beginning of the pandemic when spending plummeted. Since then, however, the ratio has fallen precipitously. This is particularly true for the automotive sector, where shortages of semiconductors have constrained production. Even outside of that sector, production has been insufficient to keep up with demand. Indeed, unfilled orders and delivery times are elevated across the manufacturing sector. Disruptions in global supply chains have been a continuing obstacle, in particular backlogs at ports that have increased the cost of shipping to historic highs.
On the one hand, capacity utilization in the manufacturing sector has recovered close to its pre-pandemic level. On the other hand, historical patterns and recent surveys of manufacturers suggest that they will increase utilization well beyond that level to replenish inventories as demand recovers.
In addition to investment in inventories, survey data suggest that investment to expand capacity and productivity is poised to increase. Private investment in equipment and structures has partially rebounded since the second quarter of 2020 but has not yet returned to pre-pandemic trends. As of the first quarter of 2021, investment in business equipment had rebounded as a share of potential output, but additional investment is required to make up for lost investment during the pandemic. A rebound in investment in structures is more than accounted for by investment in residential structures; in fact, investment in residential structures as a share of output is back to levels not seen since 2007. Nonresidential structure investment, however, is still down as a share of potential output.
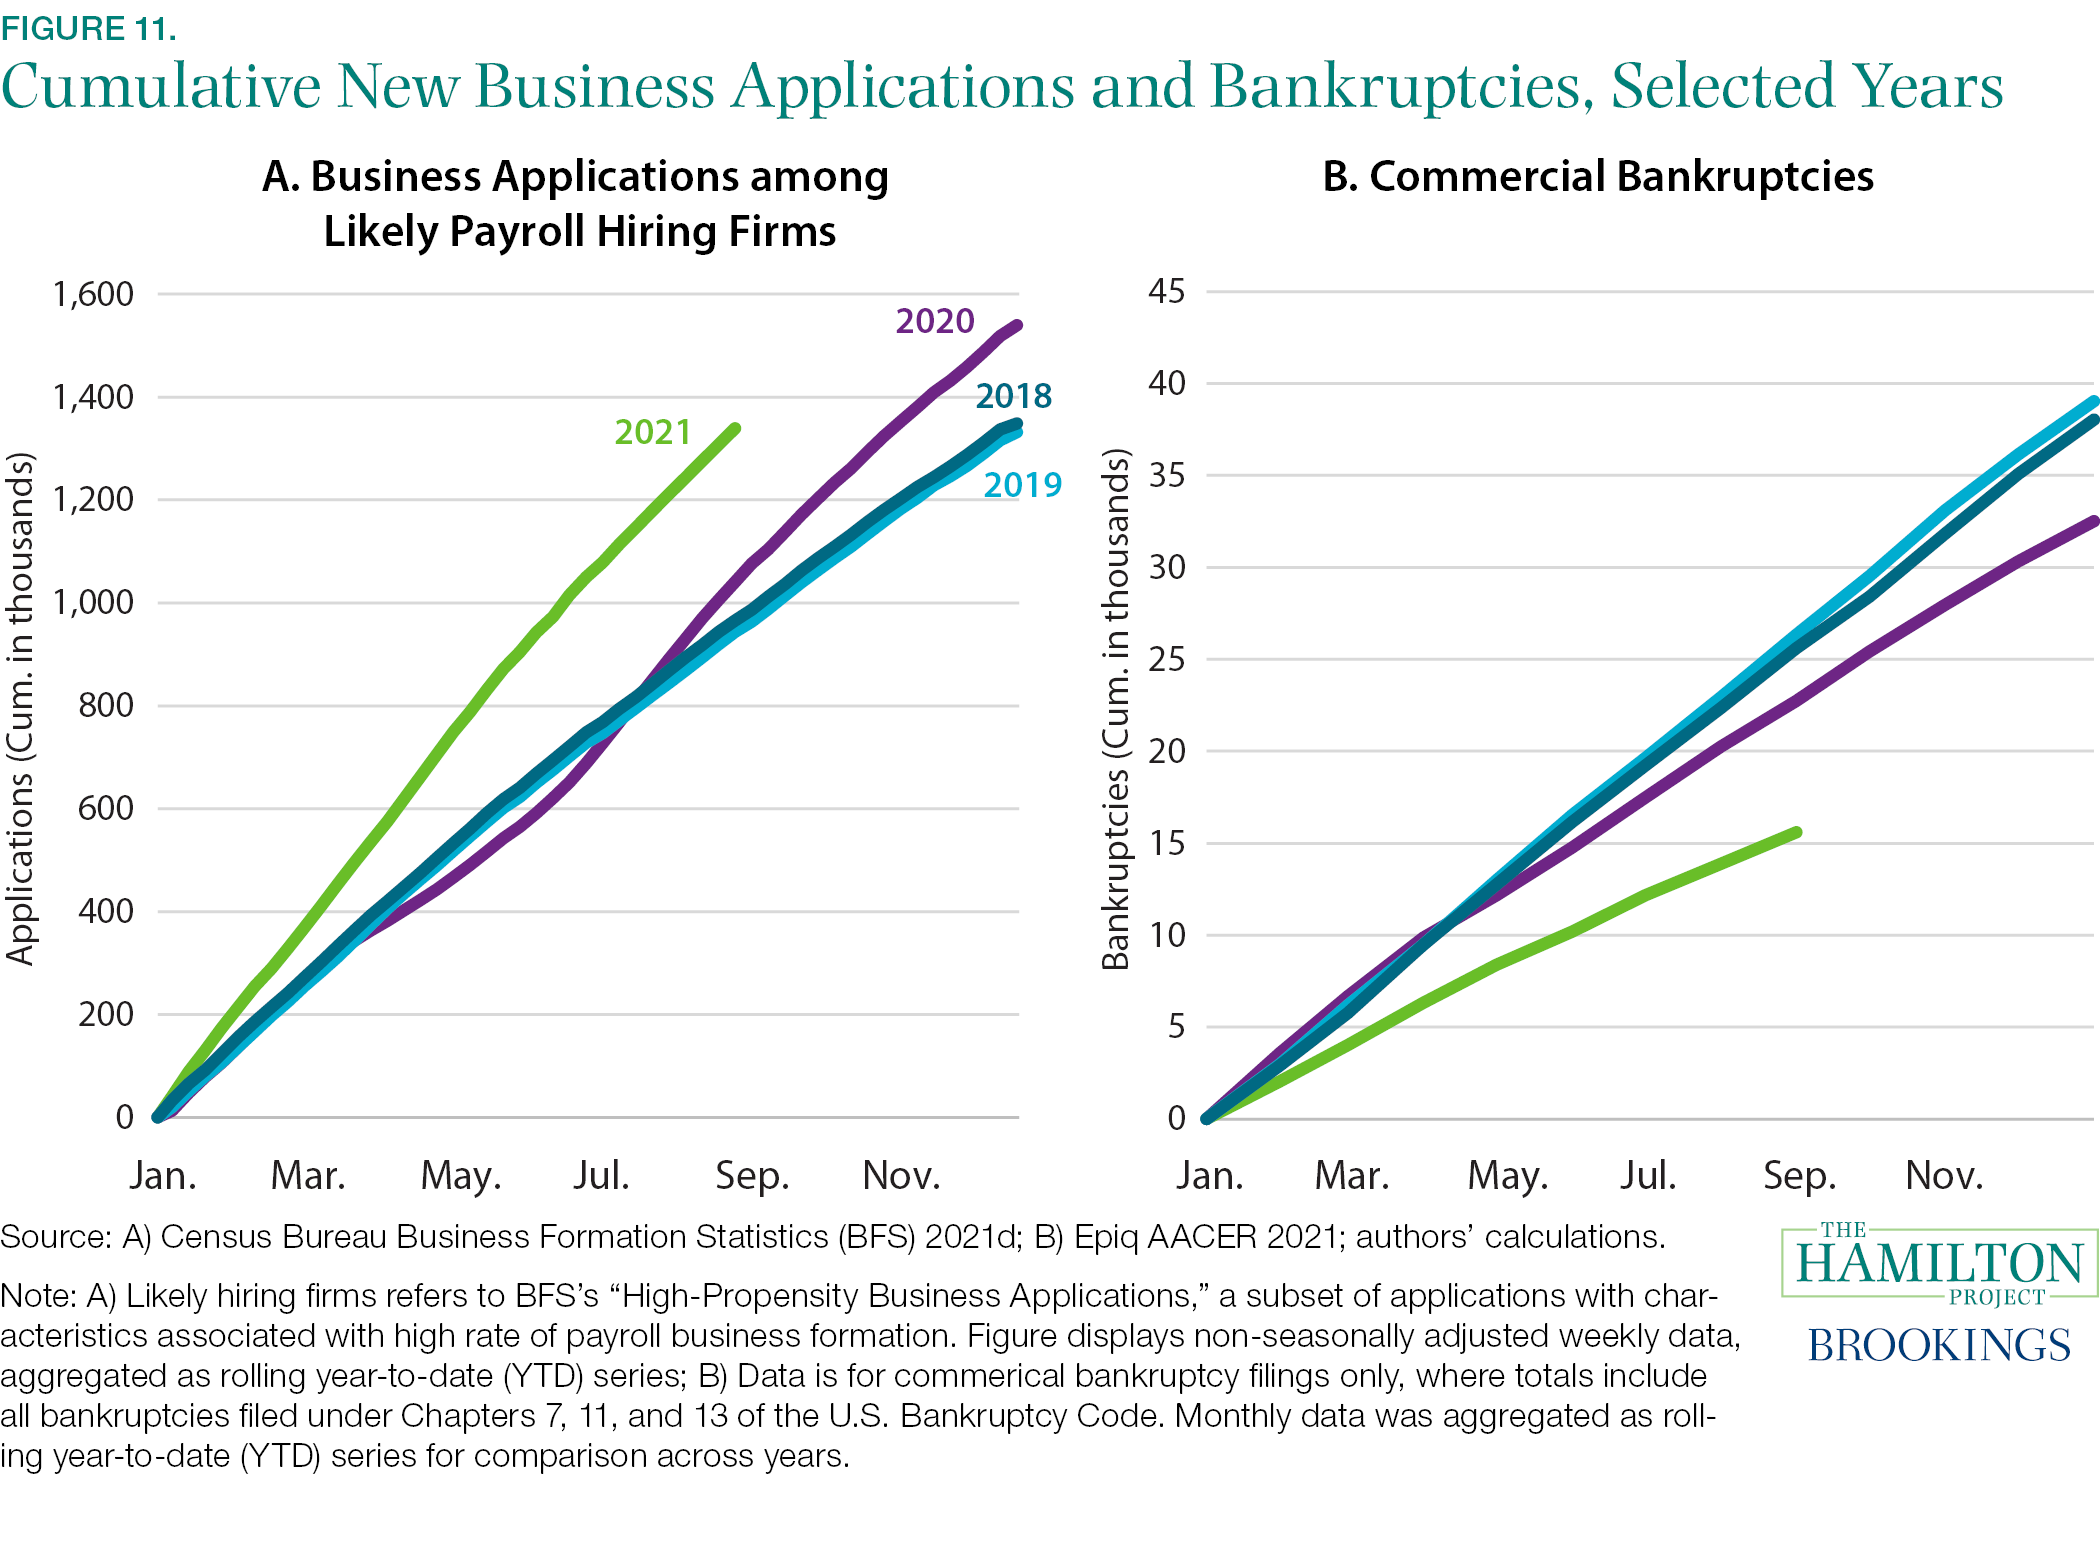
Fact 11: There were more new business applications and fewer bankruptcies in 2020 and 2021 than in 2018 and 2019.
Newly created businesses appear to be a major source of production of the goods and services that households are demanding. Figure 11a shows new business applications of firms that the Census Bureau characterizes as having a high propensity to employ workers. Since the summer of 2020, we have seen the highest level of applications since the agency began to track the series in 2004. Applications have perhaps reflected new business opportunities in the wake of the pandemic. The prospective new businesses are concentrated in online retail, which makes up a third of the increase in total new applications, and in service sector industries, which suffered some of the largest employment losses early last year (Haltiwanger 2021).
In the past year and a half, fewer firms have failed than initially feared, due in part to fiscal support like the Paycheck Protection Program that offered forgivable loans to small- and medium-sized businesses. Figure 11b compares cumulative commercial bankruptcies for the past four years. The full year 2020 ended with 17 percent fewer bankruptcies than in 2019, while 2021 is currently on track to record the fewest commercial bankruptcy filings since at least 2012 (when the data became available). More specifically, Chapter 7 filings and Chapter 13 filings, which represent asset liquidation and those of sole proprietorships, were 16 percent and 45 percent lower in 2020 than 2019, respectively. In contrast, Chapter 11 filings, which historically have reflected the reorganizations of large firms, jumped 29 percent in 2020. That increase also likely reflects legislation enacted in February 2020 and then expanded under the CARES Act, which offered smaller businesses the ability to reorganize under Chapter 11 and thus remain viable.
Although the business sector appears to have done well overall, some acutely affected sectors have seen more closures. For example, early evidence shows an elevated rate of exits for heavily COVID-affected businesses, such as barber shops and hair salons (Crane et al. 2021).
Download the report for full list of references.
Related Content


Authors


The Brookings Institution is committed to quality, independence, and impact.
We are supported by a diverse array of funders. In line with our values and policies, each Brookings publication represents the sole views of its author(s).