
Introduction
In this set of economic facts, we describe trends in union density in the U.S. through 2025 in the public and private sector, among workers, and by state.
The share of employees in the U.S. who are covered by or a member of a union, i.e., the union density rate, has fallen drastically over the past four decades. In 1985, 17.9 percent of wage and salary workers were members of a union, and 20.4 percent were covered by a union contract. Today, union density is at an all-time low: One in 10 workers were members of a union in 2025.
While union density has declined, union membership grew somewhat in 2025. In 2025, there were an estimated 14.7 million union members, which is an increase of roughly 400,000 from 2024. Previously, The Hamilton Project and the Economic Policy Institute examined the uptick in private-sector union elections in recent years (Howard et al. 2025). After a decade-high number of union elections petitions overseen by the National Labor Relations Board (NLRB) were held in FY2024, FY2025 ended with around 350 fewer cases than the previous fiscal year (National Labor Relations Board, n.d.).
While most research shows that union density has been in a decades-long decline, much of the focus has been on private-sector union density. Often overlooked is the public sector’s (i.e., state and local government workers) recent and steady decline in union density, which fell by 2.5 percentage points between 2020 to 2025. Despite its decline, union density in the public sector (34.3 percent in 2025) remains more than five times higher than the private sector union density rate of 5.9 percent.
-
Fact 1. The share of workers in a union, called union density, has long been declining in the United States.
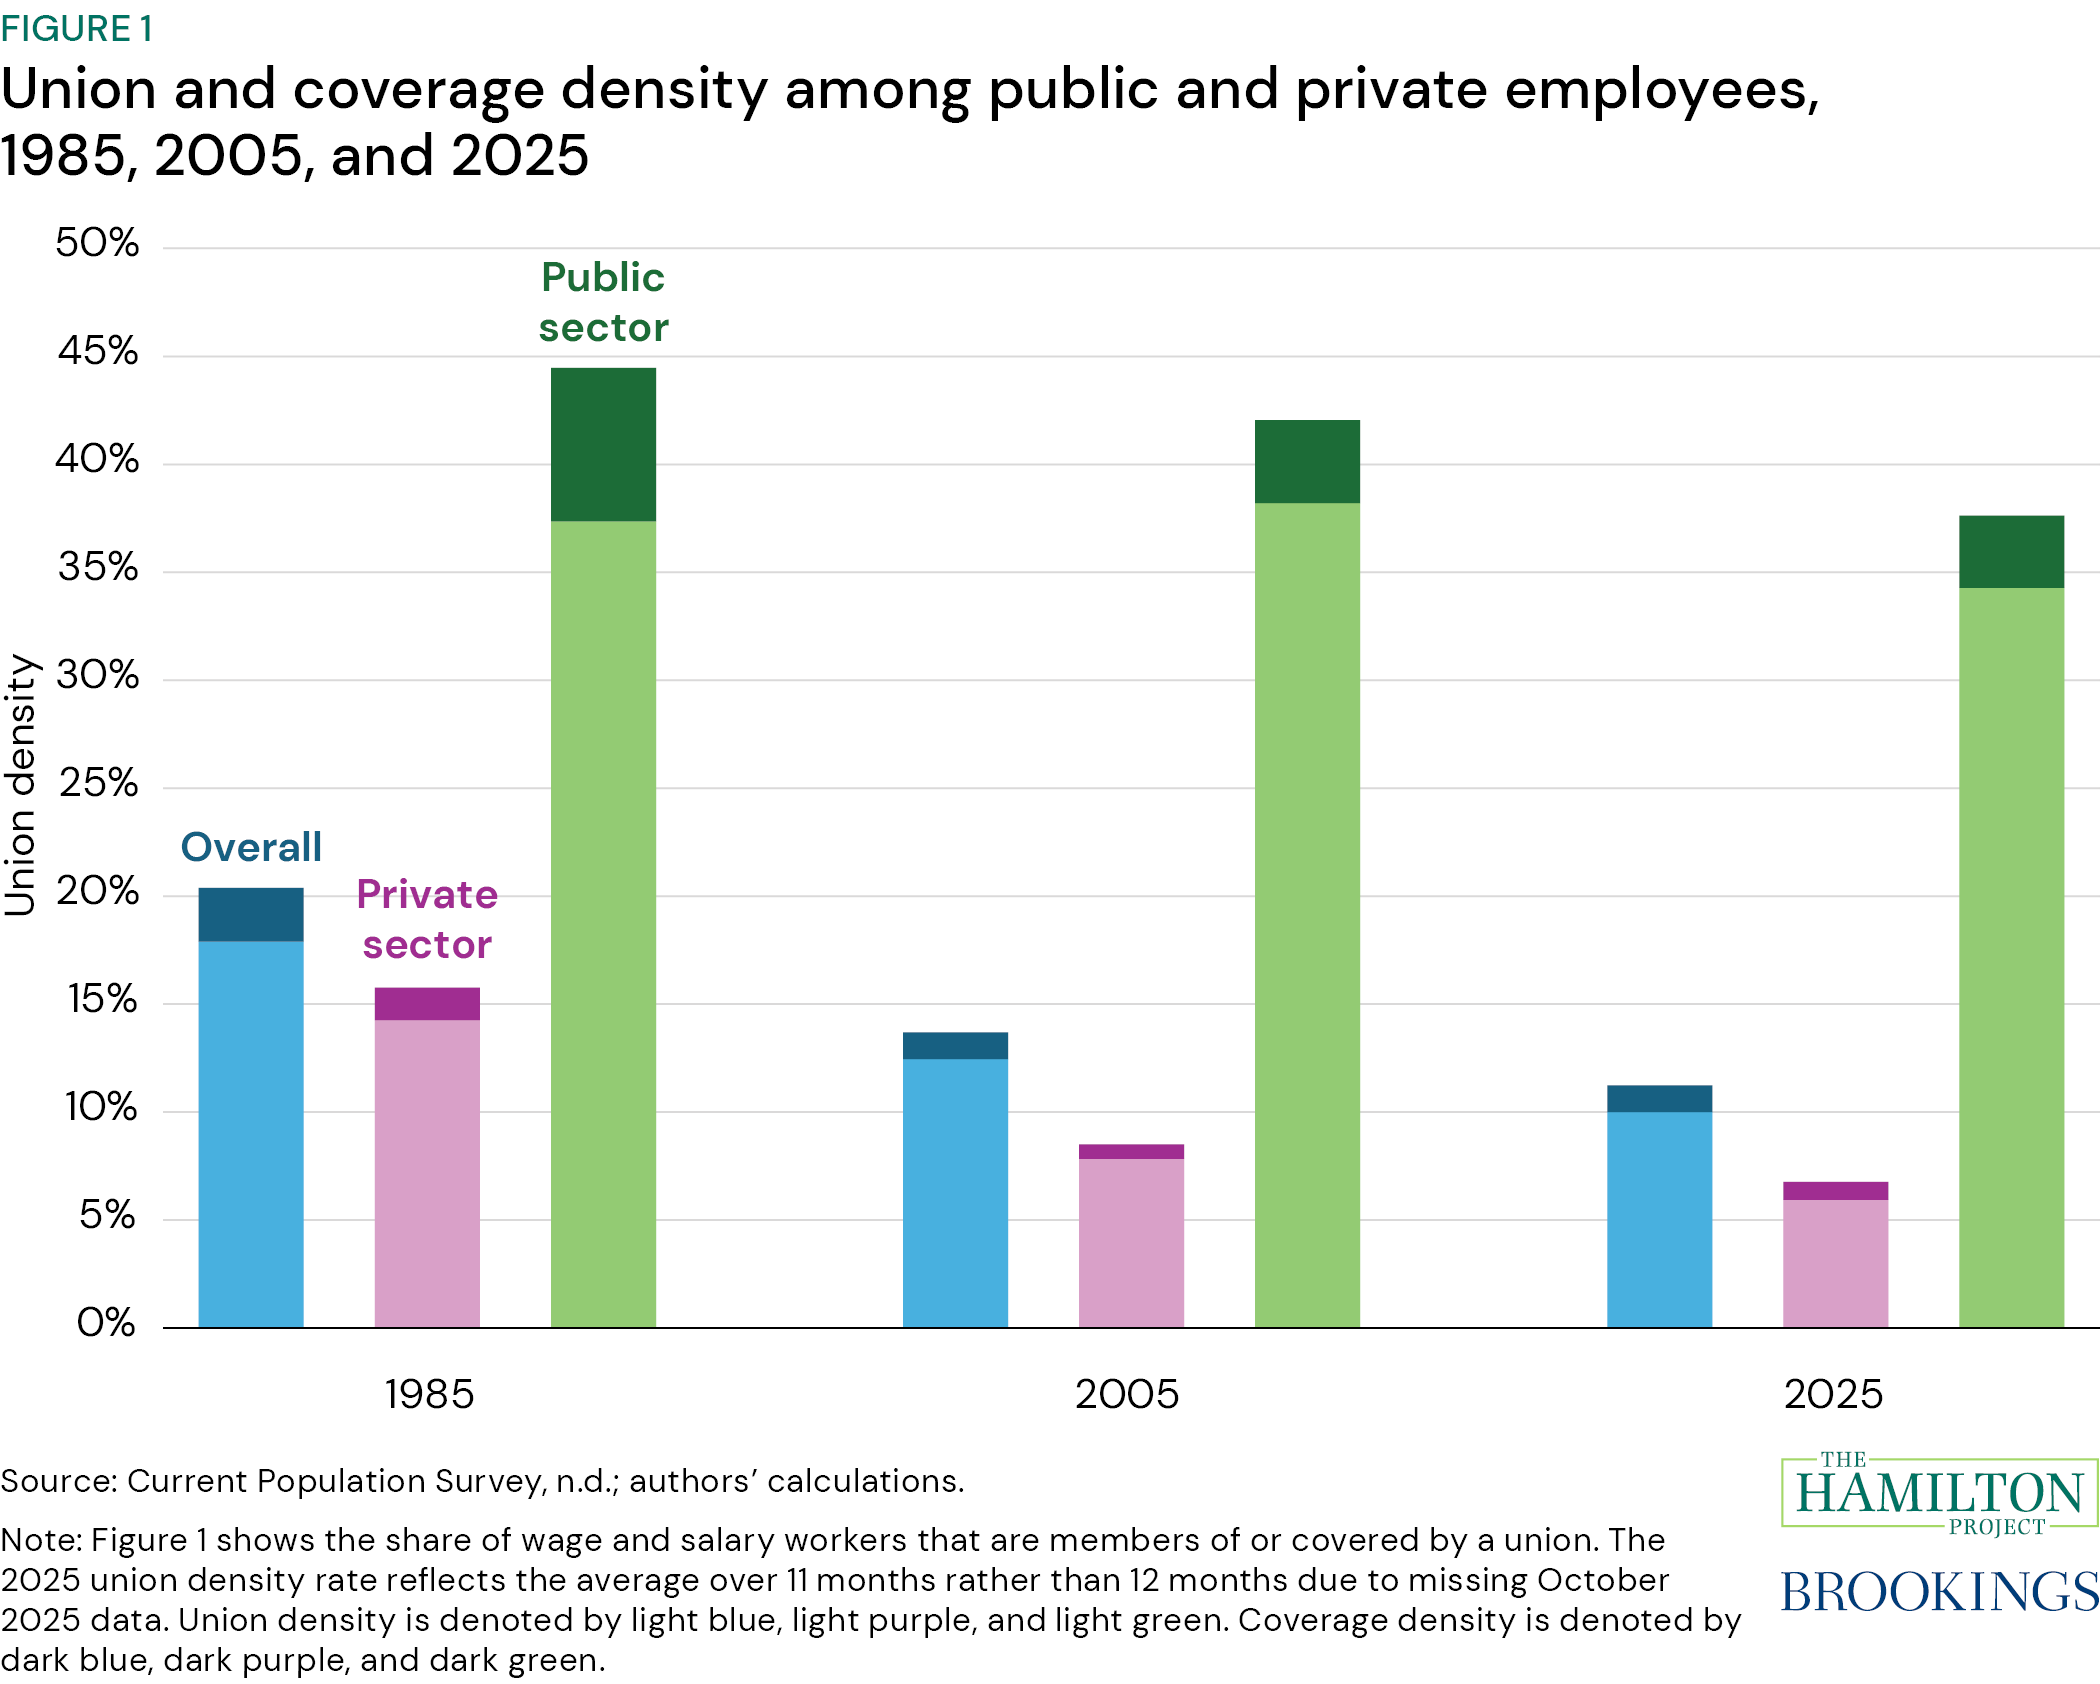
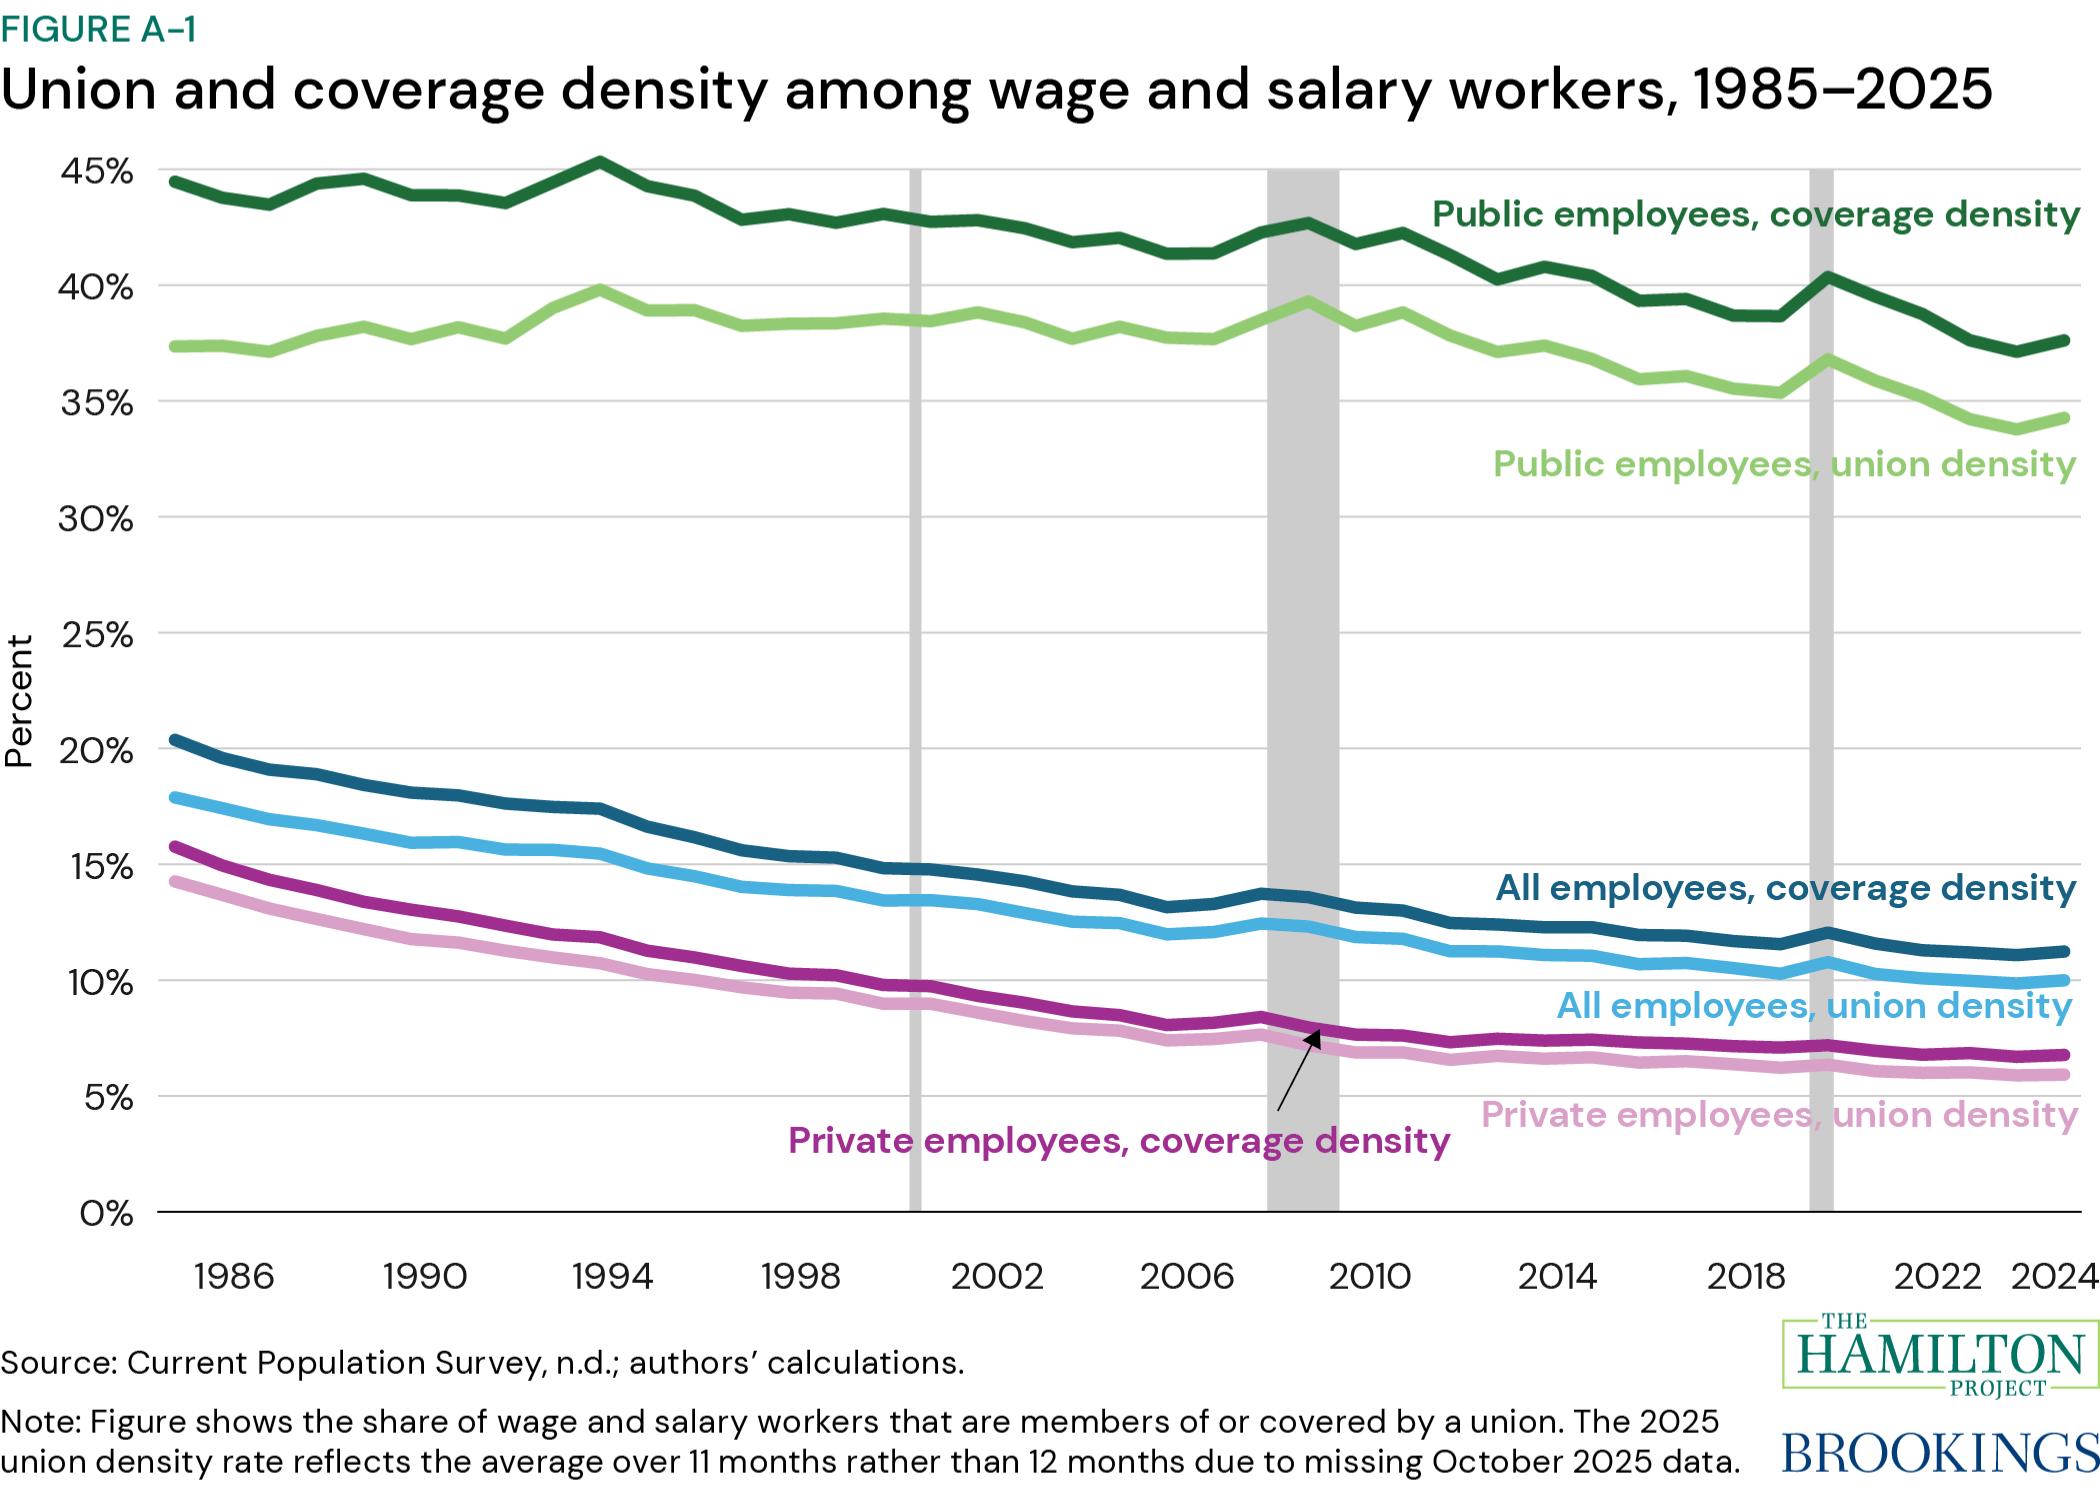
Figure 1 shows the share of wage and salary workers ages 16 and older who were members of or covered by a union in 1985, 2005, and 2025. (See appendix figure 1 for the union density and coverage time series from 1985–2025.) The union density rate is a measure of employees who are members of a union and the union coverage rate includes those who are protected by a collective bargaining agreement, whether or not they are a dues-paying member.
While union density has been on the decline for decades, since around 2010, private sector union density has been declining more slowly than in previous decades, and there has been a modest decline in coverage density. In 2025, about 5.9 percent of the private-sector workforce, or 7.4 million workers, were unionized. This is a slight increase in total union membership from 2024 (5.9 percent, or 7.2 million workers).
In 2025, over a third of the public-sector workforce—about 6.2 million state and local workers—were members of a union. The difference between the union density rate and union coverage rate is consistently larger in the public sector. The gap between the union coverage rate and the union density rate as of 2025 was 0.8 percentage points for the private sector and 3.3 percentage points for the public sector.
-
Fact 2. Most union members carry over from year to year.

Figure 2 shows the composition of public- and private-sector union membership in a given year based on their employment characteristics (employed in a union, employed not in a union, unemployed, a student, retired, or not in the labor force) in the prior year. Because this calculation requires observation in two consecutive years and union members responded to the survey in both years more frequently, the annual union density rates in figure 2 are slightly higher than in figure 1.
Over the past 25 years, most union members were union members in the prior year. In 2000, about 71.3 percent of union members had been in a union in 1999; in 2025, about 65.6 percent of union members were in a union in 2024.
Some new union members convert into membership after having been covered by a contract: On average, 7.8 percent of new union members were those who were covered but not members in the prior year. Around 0.85 percent of union members in a given year were people who were students, retirees, or otherwise not in the labor market in the prior year.
Most new union members come from those who were in the labor market (employed and unemployed workers) but not in union jobs. Each year, about half of those who became union members did not switch their industry or occupation, suggesting that the worker either found a new union job within their sector, that their workplace became unionized, or that some portion of new members are not new union members (i.e., a union member incorrectly responding to the question in the first survey).
-
Fact 3. Union members retire at a higher rate than non-union workers.
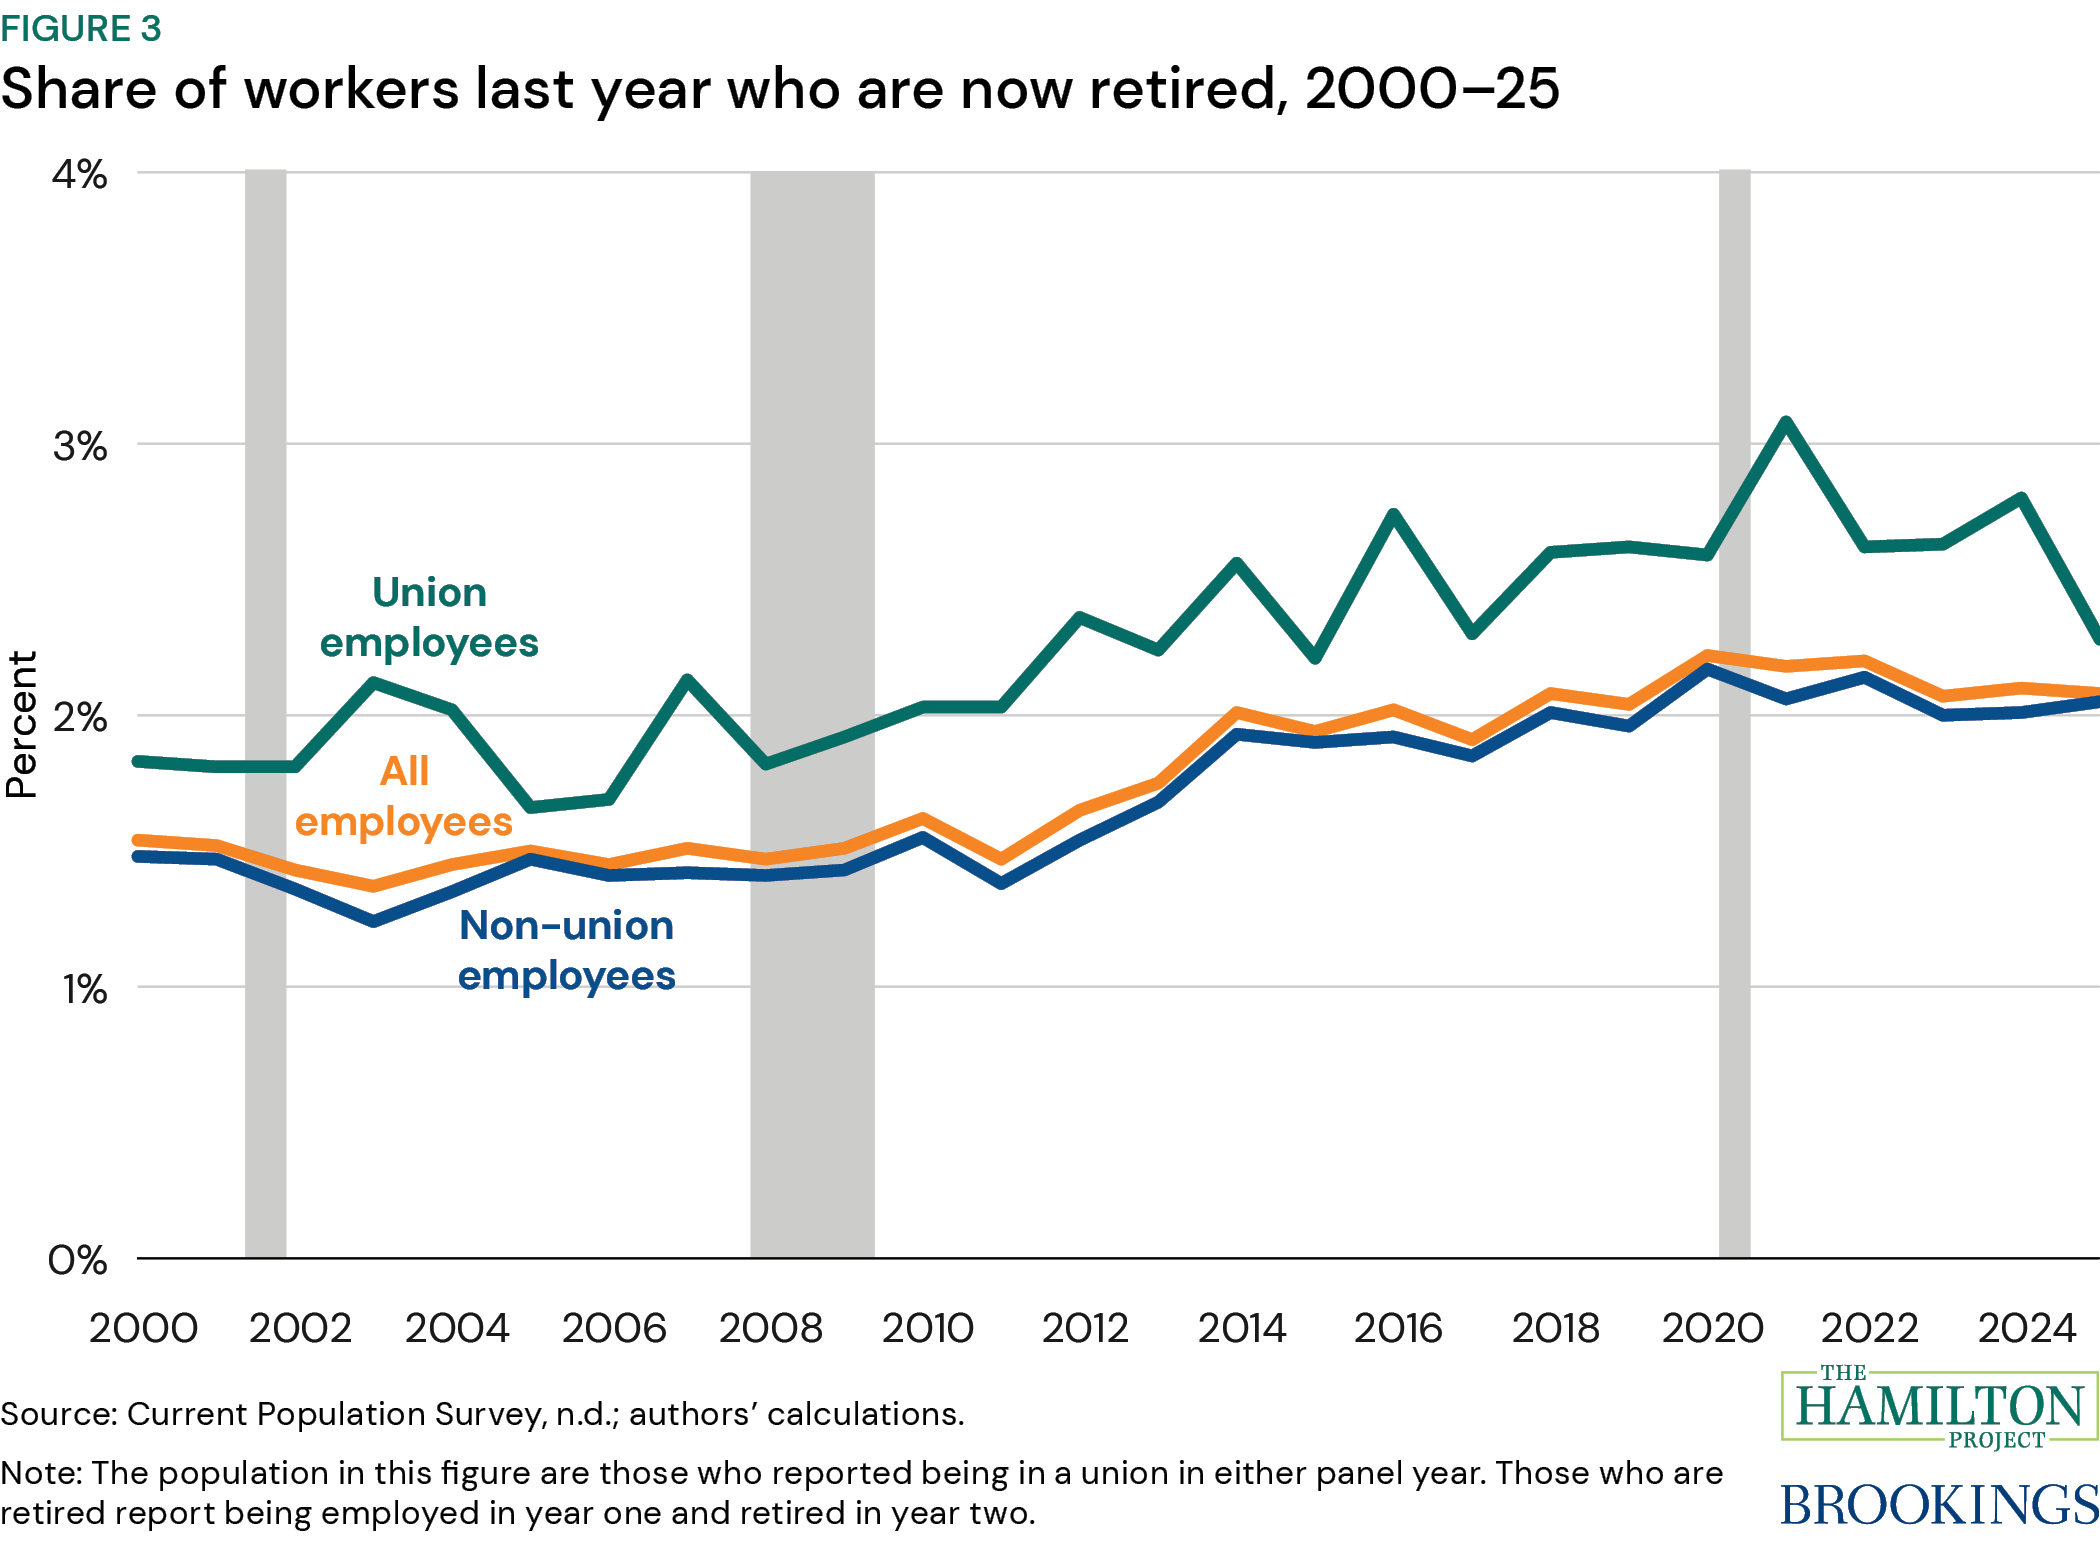
Figure 3 shows that since 2000, union members have retired at a higher rate each year than the non-unionized workforce. In 2000, the union member retirement rate was 1.8 percent, and the non-union retirement was 1.5 percent, a difference of 0.3 percentage points. In 2025, the union member retirement rate was 2.3 percent while the non-union member retirement rate was 2.0 percent, a difference of 0.3 percentage points. Retirement rates from public-sector jobs, both union and non-union, are somewhat higher than in the private sector (not shown).
For union and non-union workers, the retirement rate rose following the onset of recessions, both during the Great Recession and following the onset of the COVID recession. In 2021, 3.1 percent of those who were union workers in 2020 were retired; the retirement rate among union workers returned to trend the following year. In recent years, the overall retirement rate has held steady while the union member retirement rate has for the most part stayed on its higher trend; it remains to be seen whether the dip in the union member retirement rate in 2025 is an anomaly or not.
Union membership is concentrated in industries with an older subset of workers, like manufacturing (Dunn and Walker 2016). About 19 percent of union members in 2025 were 55–64, and 5 percent were over the age of 65, while among non-union workers, 15 percent were 55–64, and 6 percent were older than 65 in 2025. This could reflect differences in retirement ages: In 2000, unionized workers retired 2.9 years earlier than non-union workers, and in 2025, the gap was 1.4 years.
-
Fact 4. Union density has declined more in the private sector than in the public, but local government union density has fallen in recent years.
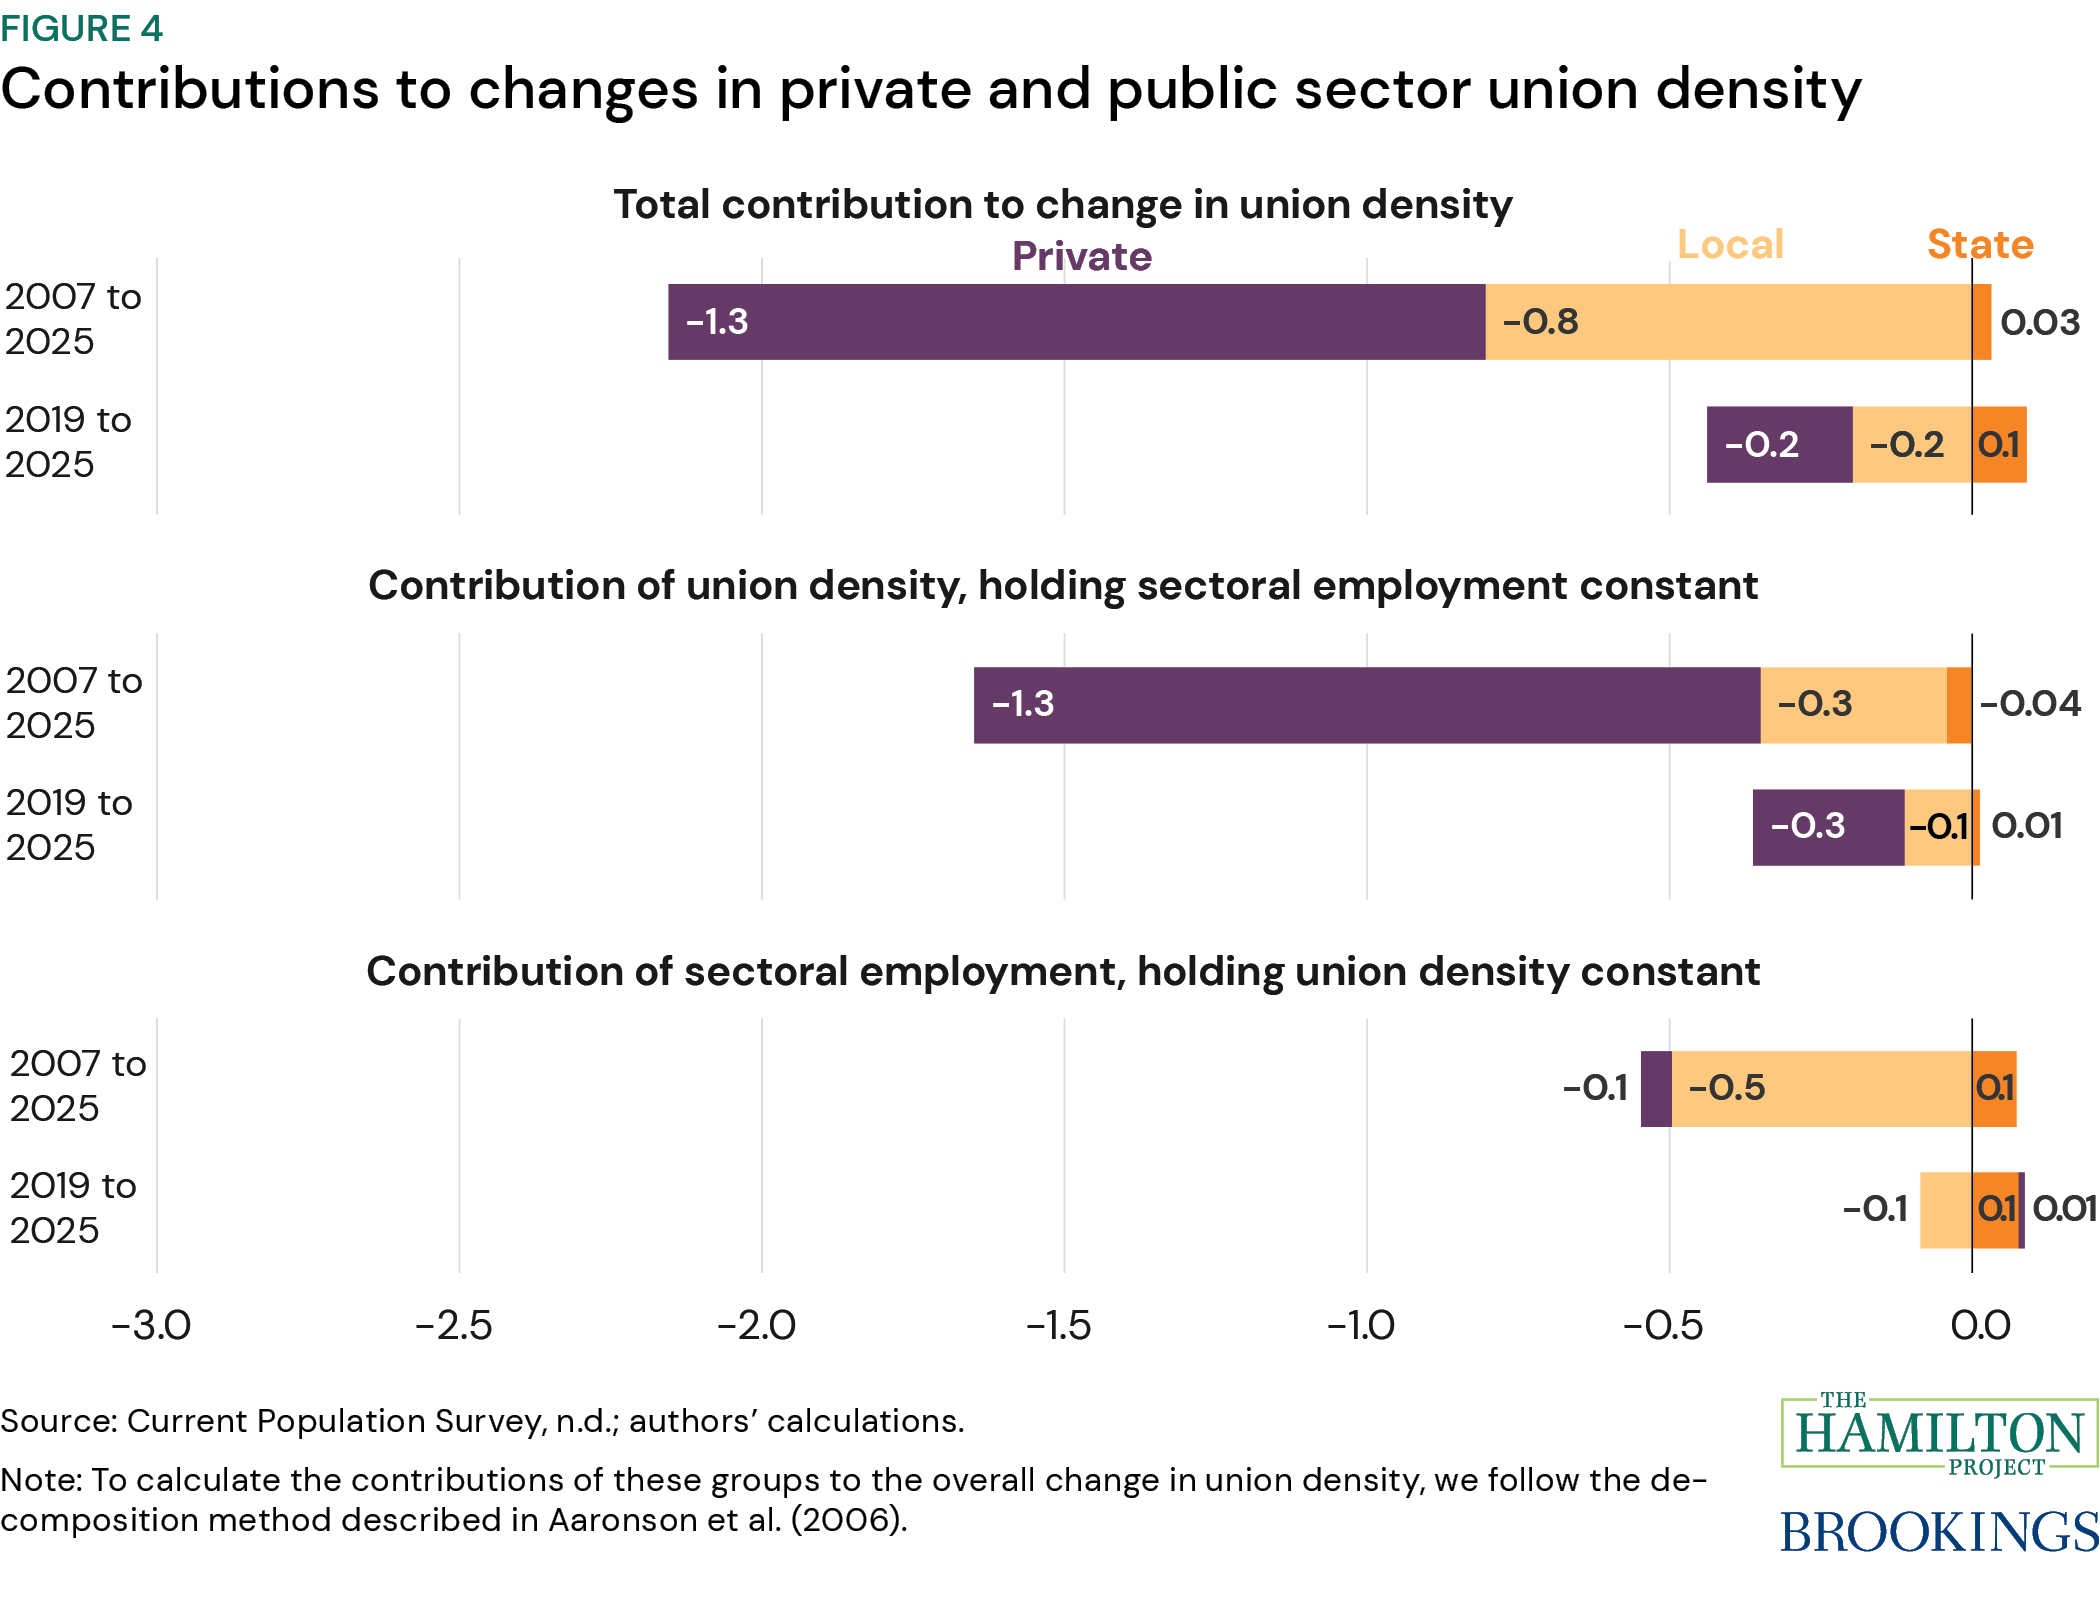
Figure 4 decomposes the change in overall union density between years, in this case 2007 to 2025 and 2019 to 2025, among three sectors (private, state, and local) and two factors, employment in the sector and union density in the sector. This method allows one to attribute changes in union density between these two points in time to either employment or union density in the sector, while holding the other factor constant.
Between 2007 and 2025, union density declined by 2.1 percentage points; between 2019 and 2025, union density declined by 0.35 percentage points. Lower employment in the private sector (0.1 percentage points) contributed substantially less to declining union density from 2007 to 2025 than public employment (0.42 percentage points). However, lower employment in the private sector and in local government contributed similar amounts from 2019 to 2025 (-0.01 and -0.1 percentage points), while state employee employment rose.
Next, we attribute declining union density to two factors: changes in union density or sectoral employment while holding the other factor constant. We find in both time periods that declining union density, while holding sectoral employment constant, explains most of the overall decline, though falling local government employment played a role as well, particularly between 2007 and 2019. Since 2019, holding union density constant, declining employment in the public sector contributed 0.01 percentage points to the overall decline in union density, while for the private sector, growing employment went slightly in the opposite direction (0.01 percentage points).
-
Fact 5. States with Right-to-Work laws have lower levels of private sector union density.
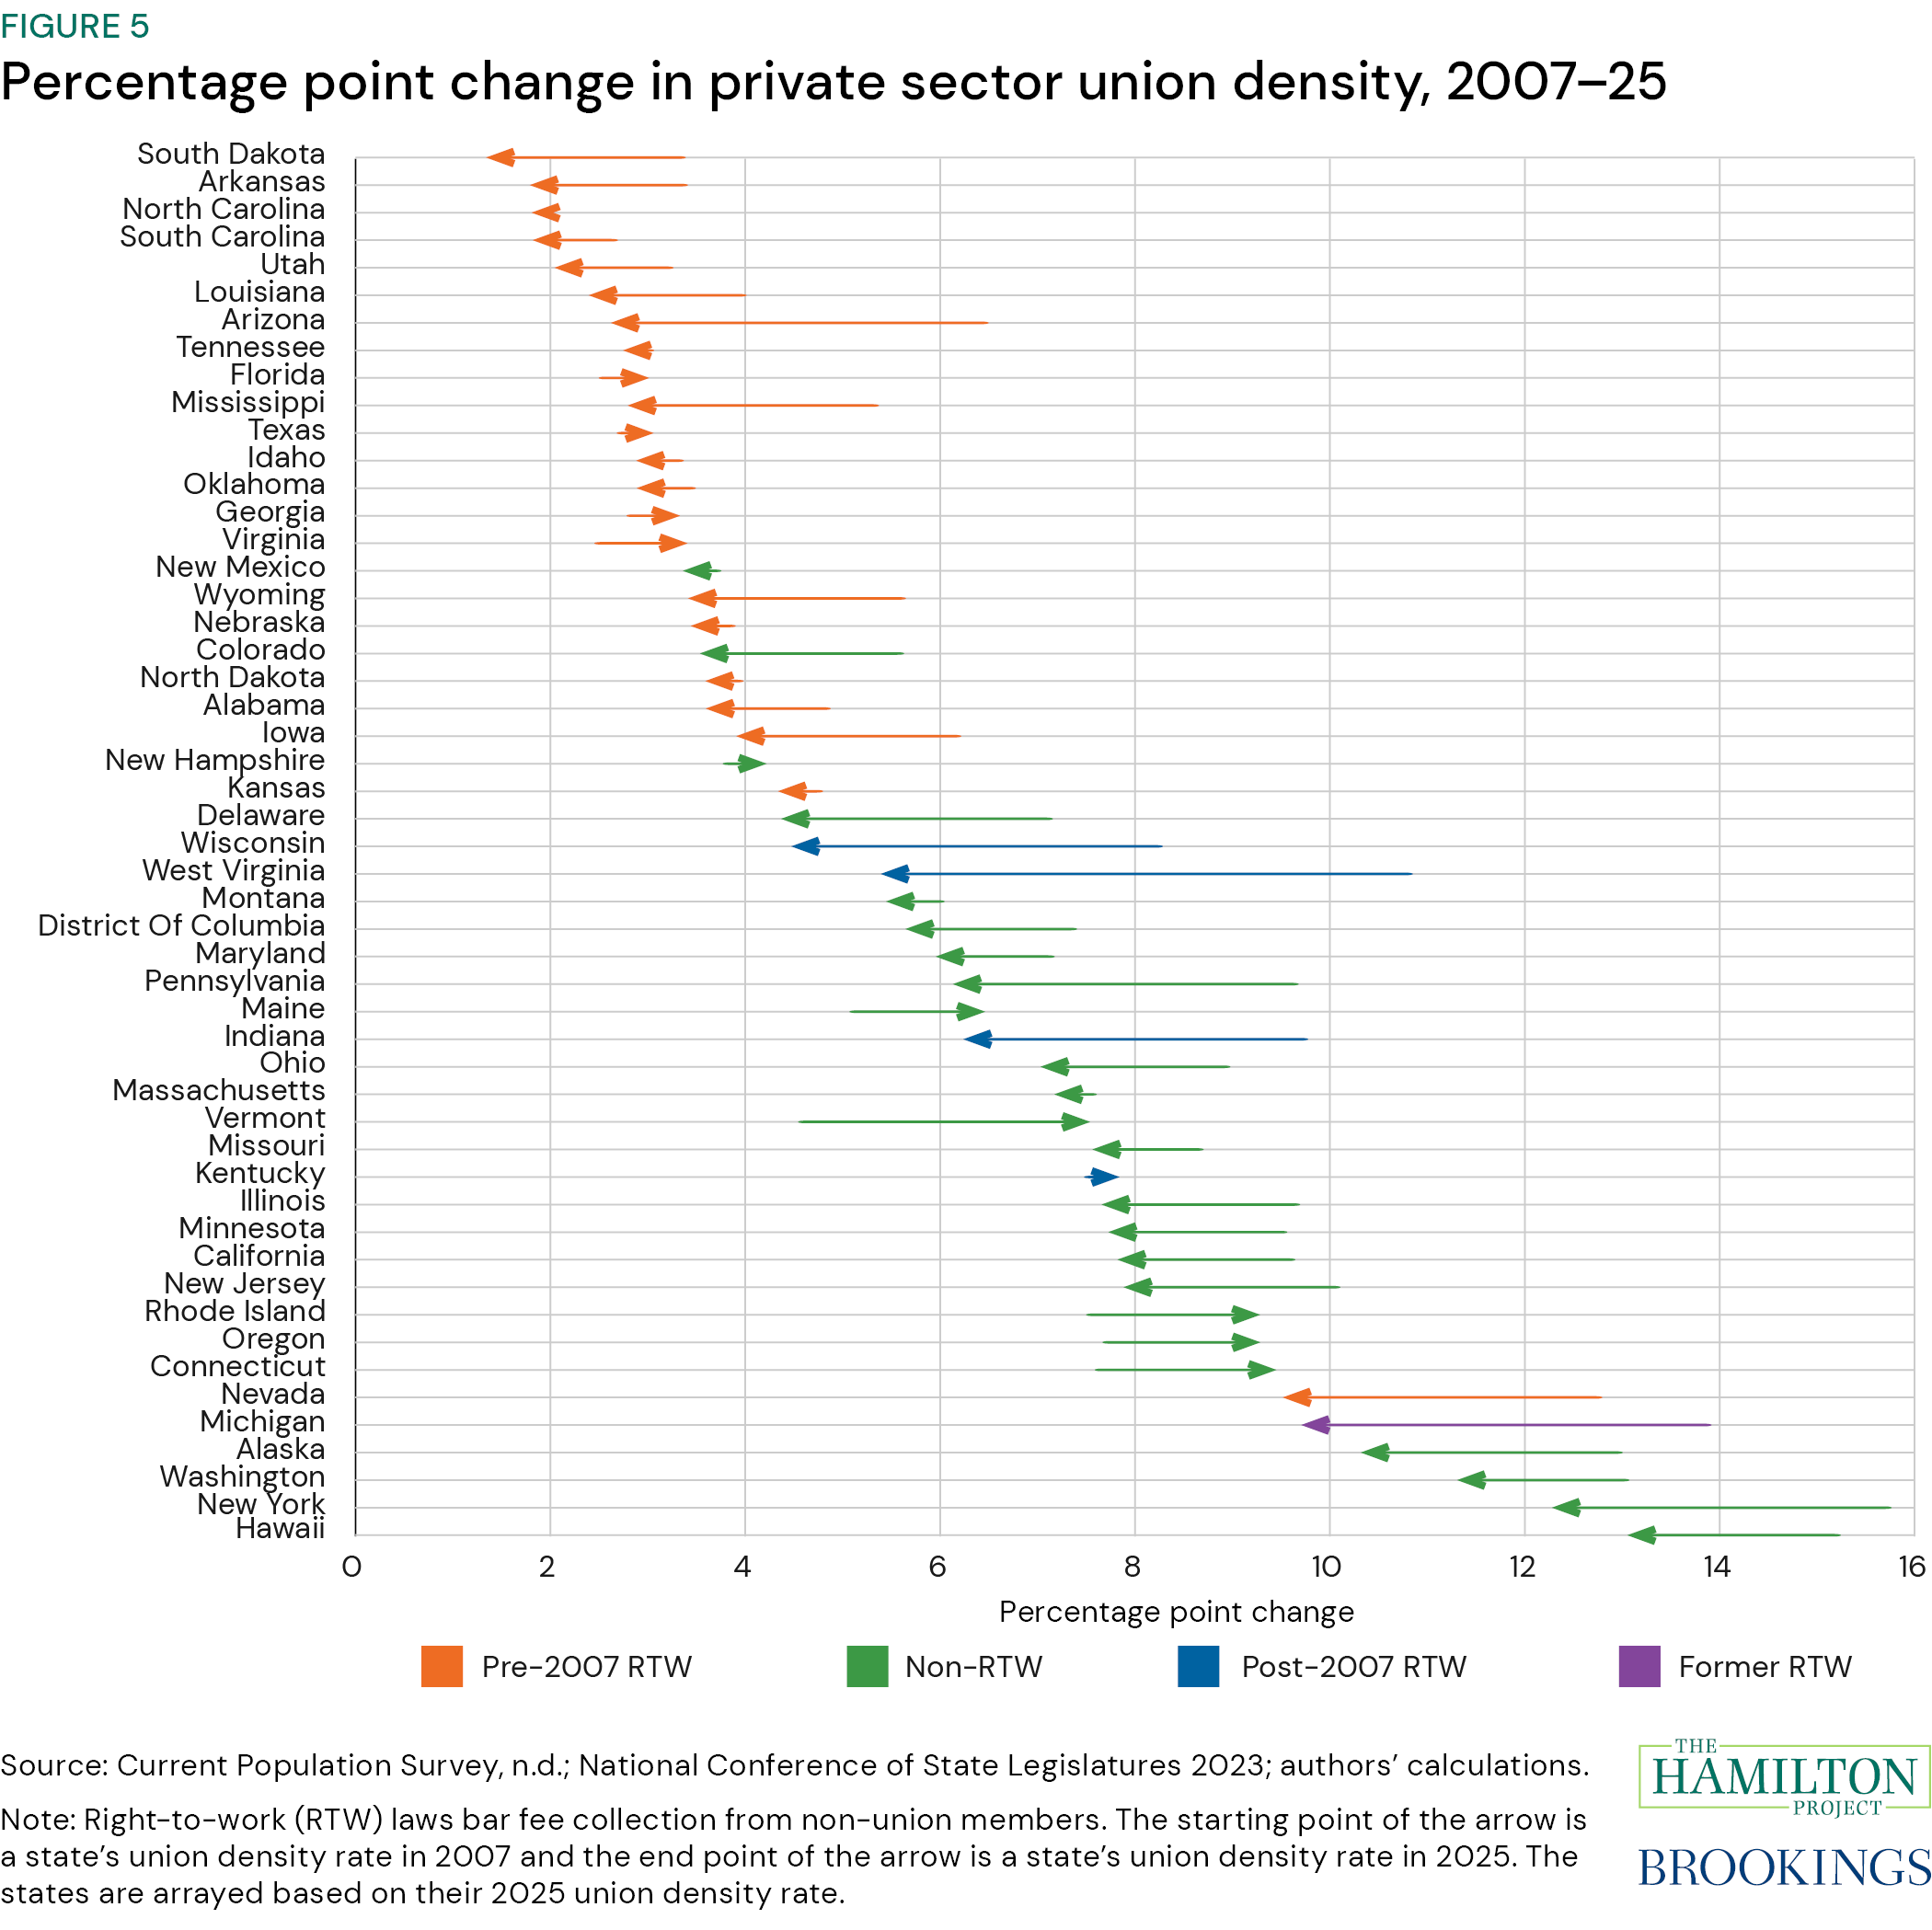
Figure 5 shows union density changes by the year that a state adopted “Right-to-Work (RTW)” laws, which prohibit unionized workplaces from collecting fees from non-union members (National Conference of State Legislatures 2023). We show states that passed RTW prior to 2007 (orange), states that passed RTW post-2007 (dark blue), states that never passed RTW (green), and Michigan (purple), the only state that adopted and repealed their RTW law.
In general, longtime RTW states have the lowest levels of union density; even so, 82 percent of these states have seen declining union density since 2007. For the four states that adopted RTW since 2007, three (West Virginia [5.3 percentage points], Indiana [3.4 percentage points], and Wisconsin [3.7 percentage points]) have among the greatest declines in union density since then; Kentucky’s union density rate is essentially unchanged (a quarter of a percentage point).
Since 2007, 11 states have seen union density increase: Five RTW states and six states that do not have RTW laws. Among these states, the magnitude of union density increases is higher among non-RTW states. Vermont saw union density increase by 2.9 percentage points since 2007.
-
Fact 6. Research attributes the decline in private sector union density to a range of factors.
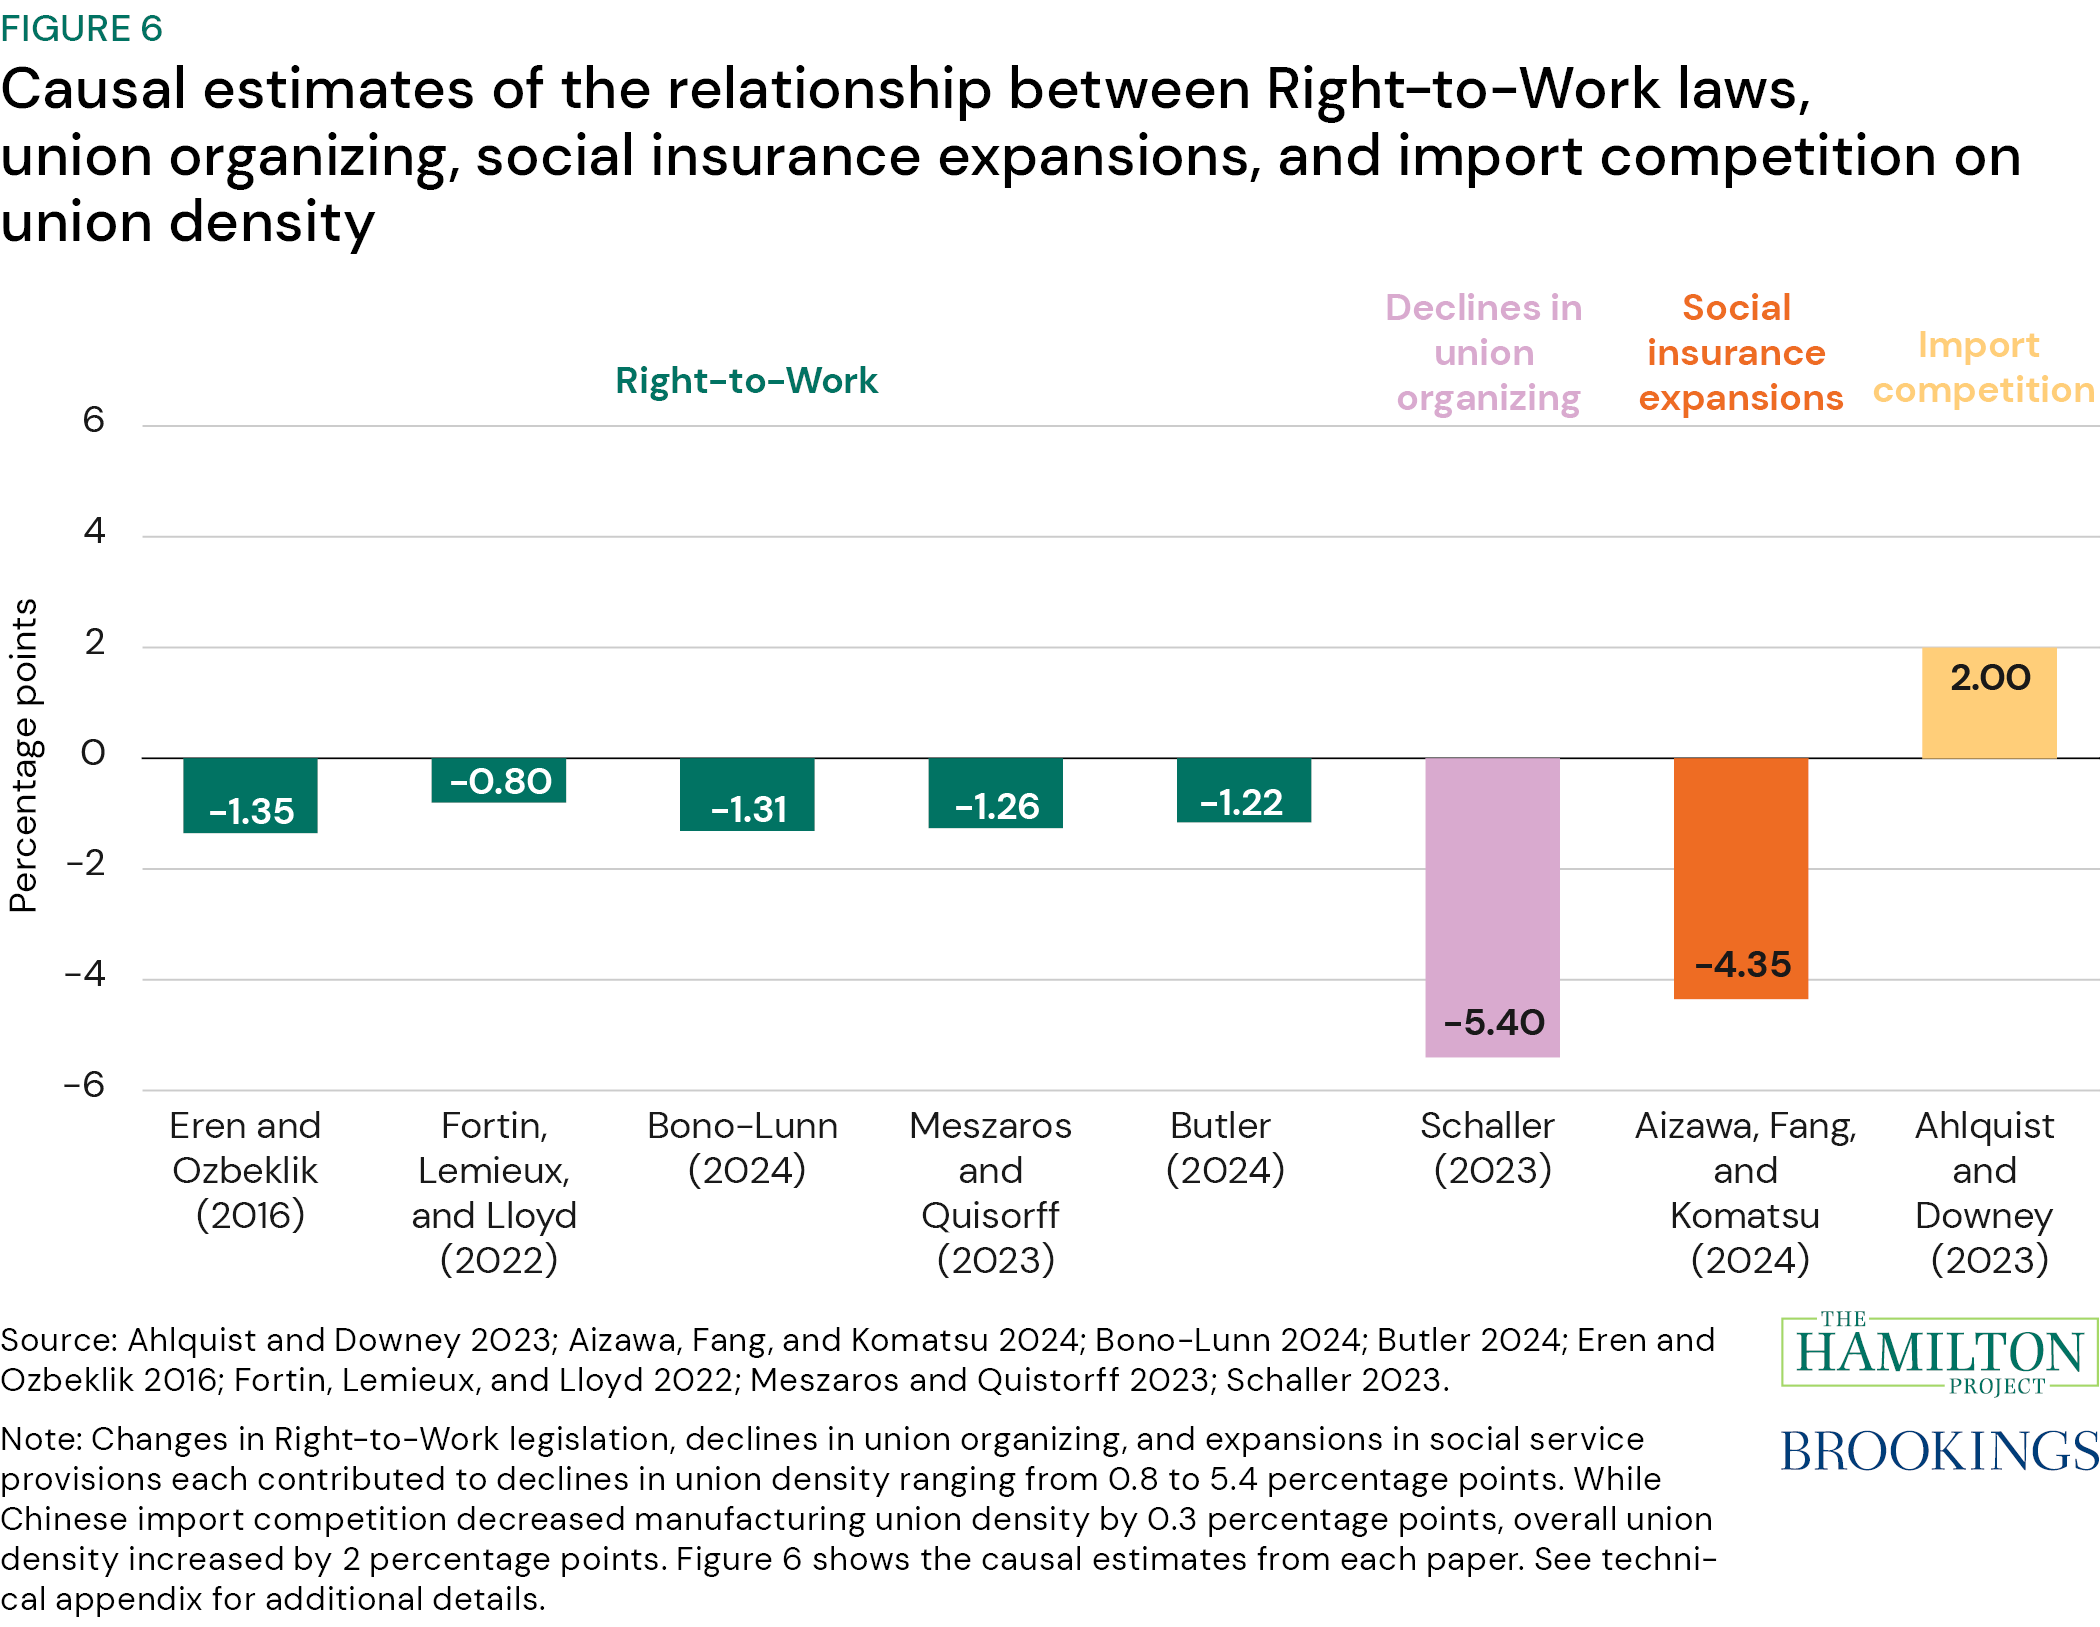
Earlier empirical work on union density primarily focused on wage differentials between unionized and non-unionized workers and estimating mechanisms behind declining union density (Freeman and Medoff 1985; Pencavel and Hartsog 1984) but were not designed for causal inference (Freeman 2005). More recent work utilizes more quasi-experimental designs to better isolate potential causes of change in union status. Figure 6 summarizes the causal estimates from eight studies that examine the shifts in private sector union density caused by Right-to-Work laws, declines in union elections, increased import competition with China, and expansions in retiree and health benefits in the last century.
Most research in this area studies the effect of “Right-to-Work” laws, or state-level regulations that prohibit unionized workplaces from collecting fees from non-union members. Since unions represent union and non-union members alike in RTW states and non-union members experience the same benefits as union members, workers have less incentive to join a union (Bono-Lunn 2024; Butler 2024; Eren and Ozbeklik 2016; Fortin, Lemieux, and Lloyd 2022; Meszaros and Quistorff 2023). The studies estimate that RTW laws cause a modest decline in private sector union membership, between 0.8 and 1.35 percentage points.
Schaller (2023) finds that declines in union organizing and the decline in elections overseen by the National Labor Relations Board (NLRB) are associated with a 5.4 percentage point decline in union density. The findings underlie the importance of union elections in maintaining union density, as these elections facilitate the creation of unions among workers.
Aizawa, Fang, and Komatsu (2024) study how changes to social insurance, such as expansions in Medicaid and Medicare, affect union density. According to their decomposition model, greater availability of social insurance coverage caused a 4.35 percentage point decline in union membership. They attribute this to the greater usage and accessibility of social benefits lowering demand for union services, such as union-provided insurance benefits.
Ahlquist and Downey (2023) study the effect of international import competition on union density. While the authors find that increased import competition with China prompted a 0.3 percentage point decline in national union density from the manufacturing sectors, their decomposition model reveals that occupational shifts outside of manufacturing sectors led to an increase in union membership rates by 2.3 percentage points, as less educated women moved from low to high union density occupations. The estimated overall net effect of increased import competition is an increase of 2 percentage points in national union density.
-
Technical appendix
Fact 1
Figure 1 represents three years of snapshots (1985, 2005, and 2025) from the time series in figure A-1. Green lines represent state and local sector employees, blue lines represent all employees, and purple lines represent private-sector employees.
Fact 2
Data are from the Current Population Survey (1999–2025) outgoing rotation groups, where the question of whether or not a worker is a member of a union is asked. We restrict the sample to those who are observed twice in the outgoing rotation group (ORG), respond affirmatively that they are in a union in either year, and use the longitudinal weight LNKW1YWT. ”Continuing” refers to workers who reported being in a union in both ORGs. “Union covered to union member” refers to workers who were covered by a union in year one and members in year two.
“Employed, covered non-member” refers to workers who were not in a union but covered in year one and were a union member in year two. “Employed, not covered” refers to workers who were neither in a union nor covered in year one and were a union member in year two. “Unemployed” refers to workers who were unemployed in year one and were a union member in year two. “Students” refers to people who were in school in year one and members of a union in year two. “Not in the labor force” refers to people who were retired or otherwise out of the labor force in year one and members of a union in year two. Because these measures are self-reported, potential measurement error from responders’ answers to self-reported union status changes if more respondents spuriously report being a member the second time that they are asked. This phenomena is documented in other cases where CPS survey respondents are repeatedly asked questions (i.e., Warren, Himmelstern, and Halpern-Manners 2024).
Fact 3
Data are from the Current Population Survey (1999–2025) outgoing rotation group supplements. We restrict the sample to those who are observed in both outgoing rotation group supplements and use the longitudinal weight LNKW1YWT. The retirement rate among union members (non-union workers) are those who report being employed and a member of a union (not a member of a union) in year one and retired in year two.
Fact 6
The studies discussed in these facts focus on private sector union density. Within the literature, authors yielded a variety of quasi-experimental approaches to assess the effects of a range of factors on union density rates. The populations and periods of interest vary by study:
Right-to-Work (RTW)
Eren and Ozbeklik (2016): Study examines changes in Oklahoma union density following the passage of RTW laws in 2001, finding that private sector union density decreased by 1.35 percentage points. Authors use a synthetic control model to estimate changes in a variety of state-labor market outcomes in Oklahoma from 1983 to 2007.
Fortin, Lemieux, and Lloyd (2022): Treated states of interest are those where RTW was adopted between 2011 and 2017: Wisconsin (2011, 2015), Indiana (2012), Michigan (2013), West Virginia (2016), and Kentucky (2017). Authors compare unionization (coverage) rates between the five “recently adopted states” and states that never adopted RTW in pre- and post- periods. Authors find that RTW decreased union coverage rates among private (a decline of 0.8 percentage points) and public sector (a decline of 6.2 percentage points) union density (table 2). The study examines the years 2007 to 2019.
Bono-Lunn (2024): Author employs a difference-in-difference with dynamic treatment effects to measure multiple labor market outcomes on a sample of 28 states, comparing RTW states to states that never implemented RTW. RTW decreased union membership by 1.3 percentage points in the private sector and 4.8 percentage points in the public sector (public sector estimates not shown). Study examines the years 1990 to 2019.
Butler (2024): Study examines changes in union density among five states that passed RTW between 2011 and 2017: Wisconsin (2011, 2015), Indiana (2012), Michigan (2013), West Virginia (2016), and Kentucky (2017). Using a synthetic differences-in-differences model to estimate short-run labor market changes and data from 2007 to 2019, the author finds that treated states experience a 1.22 percentage point decrease in union density.
Meszaros and Quistorff (2023): Authors examine a variety of states (Louisiana, Idaho, Oklahoma, Indiana, Michigan, Wisconsin, West Virginia, and Kentucky) that passed RTW legislation, looking at trends in union density from 1970 to 2021. Study uses a synthetic control model to estimate the impact of RTW in the eight aforementioned states. They find that RTW laws decreased union membership by 1.26 percentage points in the 1–10 years after implementation (table 5). The study’s years of interest are from 1970 to 2021.
Declines in union organizing
Schaller (2023): Author uses data from the National Labor Relations Board to look at how declines in union organizing and elections led to private-sector union density decline. To estimate these effects, the author uses a shift-share decomposition to isolate the impact of changes across sectoral and regional employment and compare them to within-industry and regional changes. The analysis reveals that declining organizing rates led to a 5.4 percentage point drop in union density. The paper’s data ranged from 1963 to 2012.
Social insurance expansion
Aizawa, Fang, and Komatsu (2024): Paper decomposes the impact of expansions in social insurance, technological change, and RTW laws on union density. These facts report the fraction of the estimated decline on union density explained by social insurance expansion as 14.8 percent. Technological change and RTW laws explain 32.1 percent and 6.8 percent of the decline, respectively (table 5). The data used in the paper spans from 1955 to 2019, and finds that RTW is associated with a 4.35 percentage point decrease in union density.
Import competition
Ahlquist and Downey (2023): The authors decompose the effects of Chinese import competition on union density into changes in membership within manufacturing and changes in industry size, changes in manufacturing‘s share of total employment, and changes in union density outside of manufacturing from 1990 to 2014. While an increase in import competition is directly associated with a modest decline in manufacturing union density, spillover effects from non-manufacturing industries counteracted the decline. Using CPS data, the authors show that women with lower educational attainment moved to highly unionized industries.
-
References
Aaronson, Stephanie, Bruce Fallick, Andrew Figura, Jonathan Pingle, and William Wascher. 2006. “The Recent Decline in the Labor Force Participation Rate and Its Implications for Potential Labor Supply.” Brookings Papers on Economic Activity Spring 2006 (1): 69–154.
Ahlquist, John S., and Mitch Downey. 2023. “The Effects of Import Competition on Unionization.” American Economic Journal: Economic Policy 15 (4): 359–89.
Aizawa, Naoki, Hanming Fang, and Katsuhiro Komatsu. 2024. “Labor Unions and Social Insurance.” Working Paper 32793, National Bureau of Economic Research, Cambridge, MA.
Bono-Lunn, Dillan. 2024. “The impacts of U.S. right-to-work laws on free-riding, unionization, and compensation.” Southern Economic Journal 90 (3): 769–91.
Bureau of Labor Statistics (BLS). n.d. “Current Population Survey (CPS).” Bureau of Labor Statistics, U.S. Department of Labor, Washington, DC. https://www.census.gov/programs-surveys/cps/data/tables.html.
Butler, Anand. 2024. “The Short-Run Impact of Right-to-Work Policies: Union Response and Heterogenous Effects.” Working Paper No. 24-15, University of Colorado Boulder, Boulder, CO.
Dunn, Megan, and James A. Walker. 2016. “Union Membership in the United States.” Bureau of Labor Statistics, U.S. Department of Labor, Washington, DC. https://www.bls.gov/spotlight/2016/union-membership-in-the-united-states/home.htm.
Eren, Ozkan, and Serkan Ozbeklik. 2016. “What Do Right-to-Work Laws Do Evidence from a Synthetic Control Method Analysis.” Journal of Policy Analysis and Management 35 (1): 173–94.
Fortin, Nicole, Thomas Lemieux, and Neil Lloyd. 2022. “Right-to-Work Laws, Unionization, and Wage Setting.” Working Paper 30098, National Bureau of Economic Research, Cambridge, MA.
Freeman, Richard B. 2005. “What Do Unions Do? The 2004 M-Brane StringWister Edition.” Working Paper 11410, National Bureau of Economic Research, Cambridge, MA.
Freeman, Richard B., and James L. Medoff. 1985. “What Do Unions Do?” ILR Review 38 (2): 244–63.
Howard, Olivia, Lauren Bauer, Celine McNicholas, and Margaret Poydock. 2025. “Tracking National Labor Relations Board actions through its administrative data.” The Hamilton Project, Brookings Institution, Washington, DC.
Meszaros, John, and Brian Quistorff. 2023. “Right-to-Work revisited.” Industrial Relations: A Journal of Economy and Society 64 (1): 3–22.
National Conference of State Legislatures. 2023. “Right-To-Work Resources.” Updated December 19, 2023. https://www.ncsl.org/labor-and-employment/right-to-work-resources.
National Labor Relations Board. n.d. “Number of Elections Held Per FY.” Accessed May 15, 2026. https://www.nlrb.gov/reports/nlrb-case-activity-reports/representation-cases/election/election-statistics.
Pencavel, John H., and Catherine E. Hartsong. 1984. “A Reconsideration of the Effects of Unionism on Relative Wages and Employment in the United States, 1920-1980.” Working Paper 1316, National Bureau of Economic Research, Cambridge, MA.
Schaller, Zachary. 2023. “Decomposing the Decline of Unions: Revisiting Sectoral and Regional Shifts.” ILR Review 76 (2): 387–411.
Warren, John R., Jessie Himmelstern, and Andrew Halpern-Manners. 2024. “Panel Conditioning Biases in the Current Population Survey’s Food Security Supplement.” Public Opinion Quarterly 88 (1): 193–213.
Authors


Related Content


-
Acknowledgements and disclosures
The authors are grateful to Aviva Aron-Dine, Josh Bivens, Celine McNicholas, Ryan Nunn, and Margaret Poydock for feedback that improved this piece. The authors thank Cameron Greene, Olivia Howard, and Linsie Zou for substantial contributions to earlier versions of the piece and Asha Patt and Eileen Powell for research assistance.
The Brookings Institution is committed to quality, independence, and impact.
We are supported by a diverse array of funders. In line with our values and policies, each Brookings publication represents the sole views of its author(s).