Editor’s Note: Speaking before the annual research conference of the Dutch central bank, Karen Dynan summarized her BPEA Spring 2012 paper (PDF) on how the consumer debt overhang and the uncertain state of households’ finances are related to the weak U.S. economic recovery.
Thank you for inviting me to speak today. I would like to start by commending the organizers for putting together this conference. The past few years have really highlighted just how much we do not know about household finances. Dramatic balance sheet developments have created tremendous hardships for individual households and have wreaked havoc with the financial system as well as the broader economy. Research like that featured in this conference should yield important lessons about how, going forward, we can foster household economic security and reduce the likelihood of financial crises.
I am going to talk about the U.S. household debt overhang and how it is related to the weak U.S. economic recovery. I will draw off my own research and that of others, as well as what I have learned engaging with people from policy agencies, financial institutions, and consumer groups over the past few years.
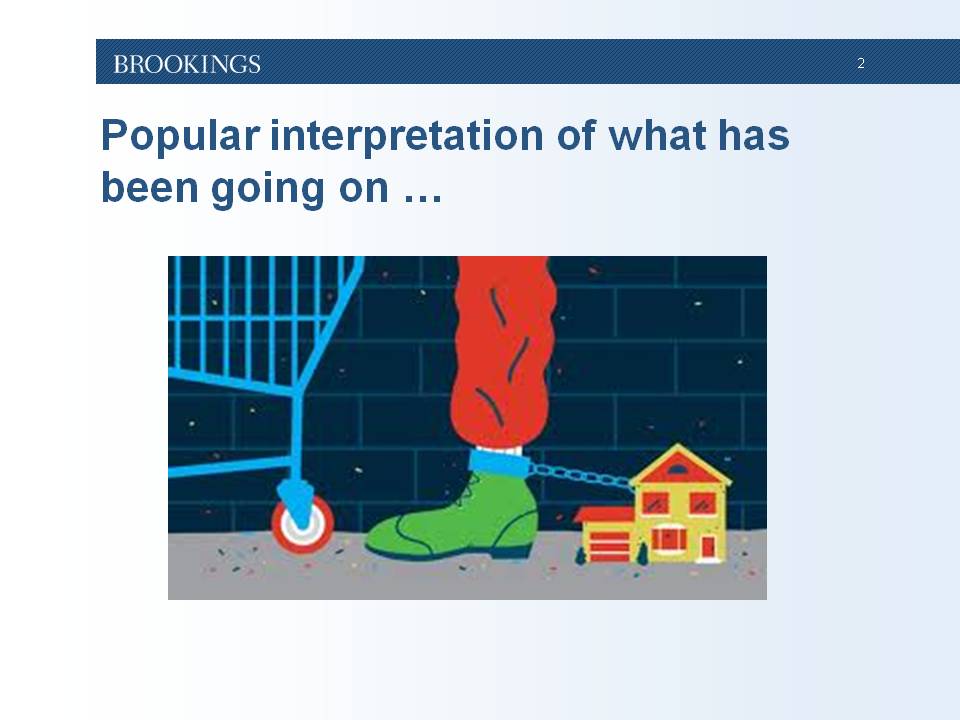
Slide 2 shows a cartoon that summarizes the popular interpretation of what has been going on. We see the consumer trying to move forward and fill his shopping cart. But, he cannot do so because his leg is chained to something that is holding him back. That something is a charming little house. The message is that purchases of homes, and, in particular, the debt taken on to do so, have now become a terrible drag. Americans cannot move forward and consume.
I will turn now to how well this characterization captures the actual situation.
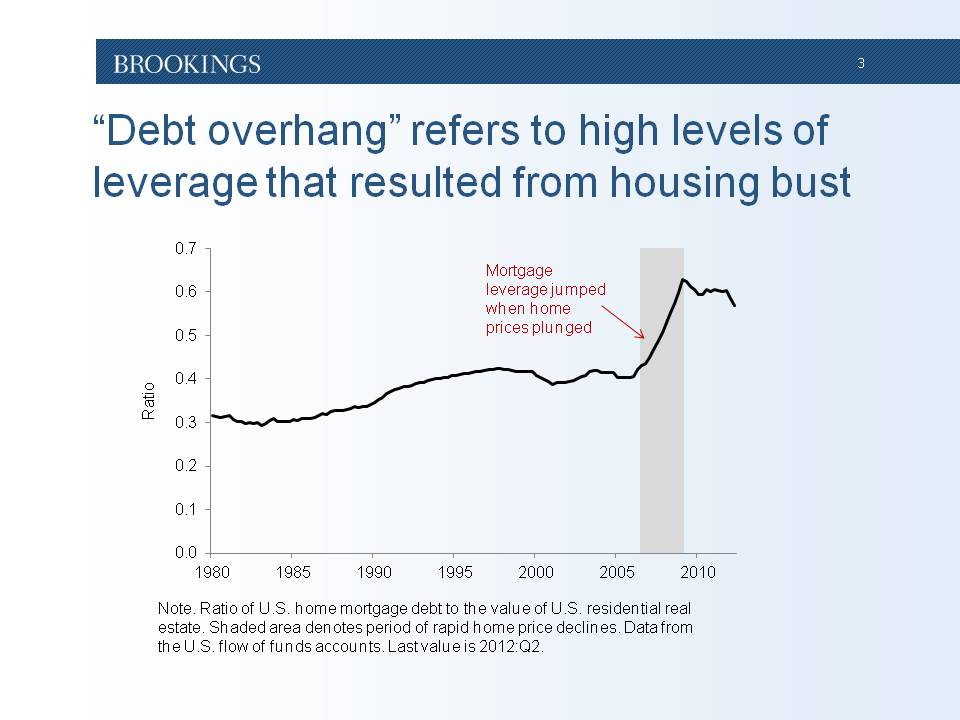
First (slide 3), let me define what I mean by “household debt overhang” since I will be using that term a lot throughout my talk. I am specifically referring to the extremely high levels of leverage—meaning debt relative to assets—experienced by many U.S. households in the wake of the plunge in home prices that occurred between late 2006 and early 2009. The pattern is particularly striking for mortgage leverage. As you can see in the chart, the ratio of aggregate U.S. mortgage debt to the aggregate value of homes jumped up during the housing bust—denoted by the shaded area—and has remained extremely elevated since then.
The Causes of the Household Debt Overhang (slide 4)
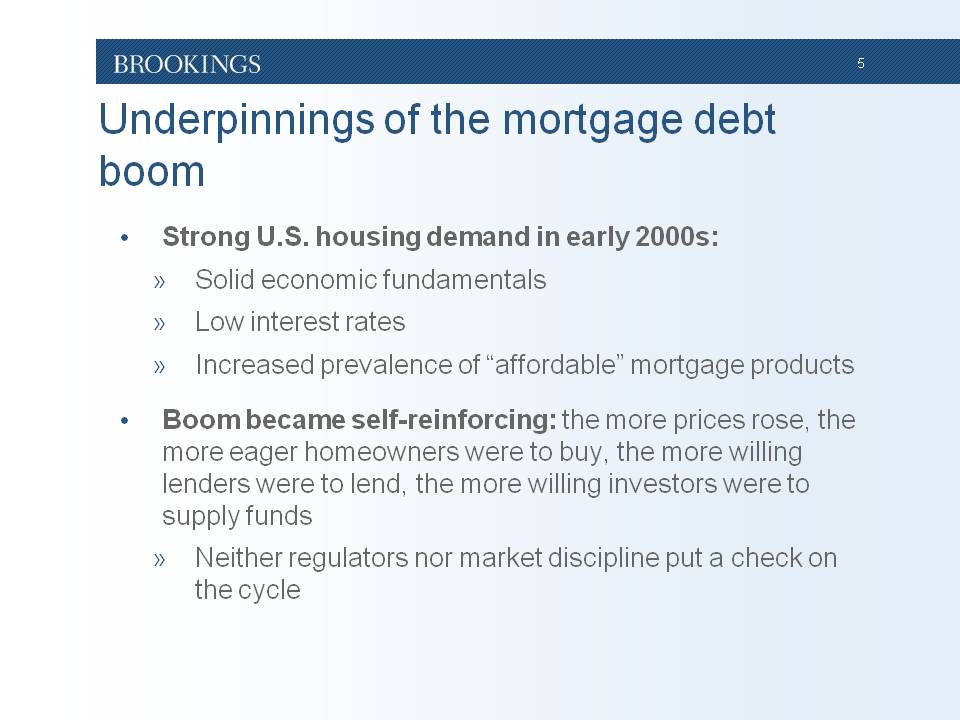
To understand how the United States ended up with this household debt overhang, one needs to go back about a decade (slide 5). In the early 2000s, strong U.S. housing demand arose from the combination of solid economic fundamentals, low interest rates, and the increased prevalence of so-called “affordable” mortgage products that made homeownership possible for households with little savings and limited ability to make mortgage payments. In turn, housing construction boomed, prices started to rise rapidly, and mortgage borrowing picked up.
And, as time went on, the boom became self-reinforcing—the more prices rose, the more eager homeowners were to buy, the more willing lenders were to lend, and the more willing investors were to supply funds. Neither regulators nor market discipline put a check on the cycle, partly because of complex mortgage funding arrangements that obscured the risk associated with many loans. In addition, the widely held views in the United States that increasing homeownership was highly desirable and that financial innovation generally made for more efficient and less risky financial markets probably also contributed to the environment of lax regulation.
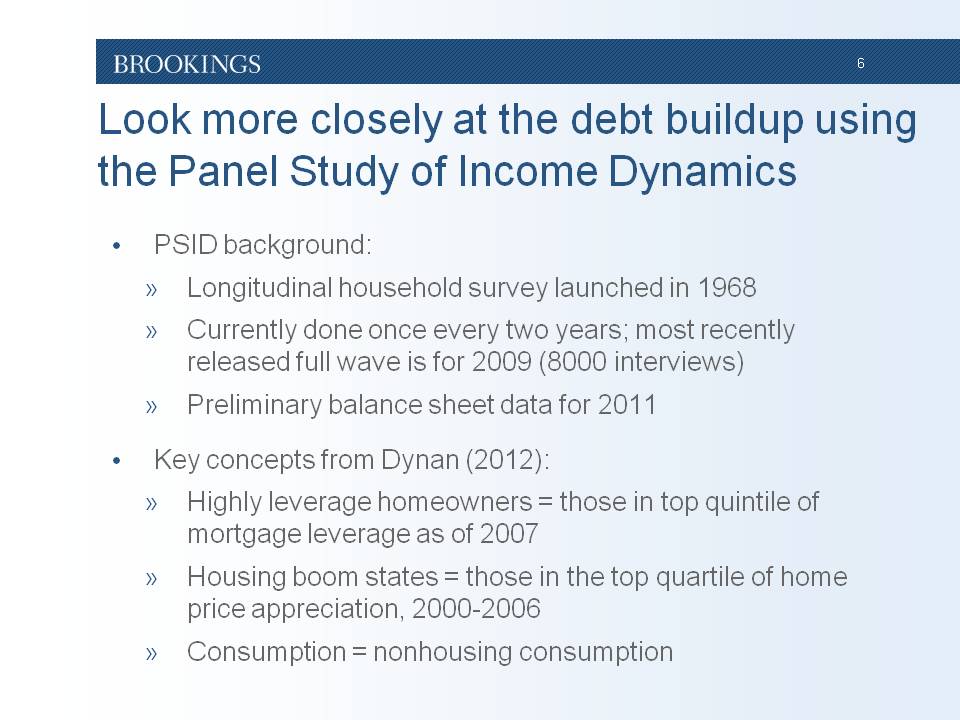
To shed more light on what was going on, I used the Panel Study of Income Dynamics to look more closely at the households that took on a lot of debt during this period (slide 6)[1]. By way of background, the PSID a longitudinal survey of U.S. households that was launched in 1968. The survey is currently done once every two years; the most recently released full wave contains information from about 8,000 interviews conducted in 2009. The full data set offers a fairly rich set of information about households, including data about their demographics, income, employment, housing situations, spending, and balance sheets. In addition, preliminary balance sheet data from the 2011 wave of the PSID was released earlier this year.
A few key concepts from my paper are as follows. First, I define highly leveraged homeowners as those in top quintile of mortgage leverage as of 2007 (that would be the PSID wave that was closest to the peak of the U.S. housing and mortgage boom). Second, I define “housing boom states” as those in the top quartile of home price appreciation between 2000 and 2006; of course, most U.S. states saw considerable home price appreciation over this period, but, for the purposes of identification, I separate out the ones where market conditions were especially frenzied. Finally, my consumption measure excludes housing because it would confound the analysis to include something so closely related to housing wealth as an outcome variable.
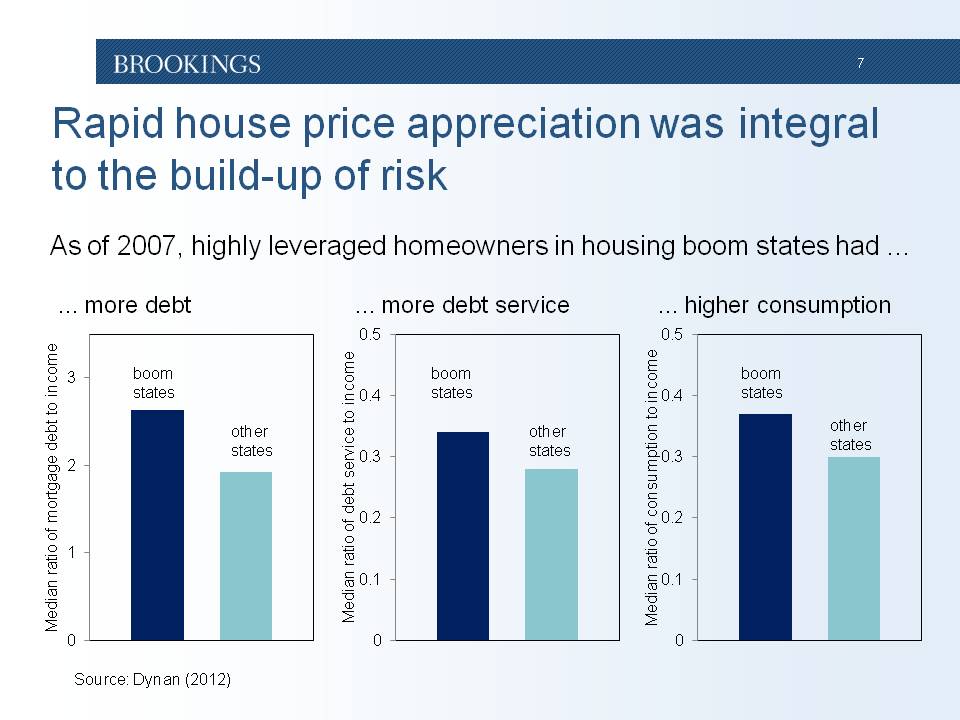
The most striking results from this part of my study concerned just how important a role home prices played in the buildup of risk during this period. In this slide (slide 7) I compare the experience of highly leveraged homeowners in housing boom states with that of highly leveraged homeowners in other states. As can be seen, as of 2007, mortgage debt relative to income among highly leveraged homeowners in the housing boom states (the dark blue bars) was much higher than that of their counterparts in the other states (the light blue bars). Debt service payments relative to income were also higher. In addition, consumption relative to income was higher for the highly leveraged homeowners in the housing boom states. So, the results are certainly consistent with the view that some households were significantly tapping into their housing capital gains to finance higher consumption.
Many people have pointed out that policymakers would have better anticipated the mortgage crisis if they had had better data. I agree with this point. As this group well knows, household surveys, like that used for these charts, are of limited use for monitoring household financial risk in real time because they are released with a significant lag, sometimes a several year lag. Mortgage records and credit bureau data can provide more timely information about indebtedness at the household level, but these proprietary sources were not being widely used for policy purposes prior to the financial crisis because they are very expensive and sometimes difficult to use.
However, foreseeing the crisis was not just a matter of having the right data; it was also a matter of how one interpreted the information. Despite the indications of risk building up among highly leveraged homeowners like that in this slide, the same data source yields other information that could be read as indicating these households were in very solid financial positions. In particular, although highly leveraged homeowners in housing boom states saw large increases in mortgage debt between 2005 and 2007, their median net worth actually rose by 13 percent of income over this period because of rapid home price appreciation. Also thanks to home price appreciation, their mortgage leverage—the median ratio of their mortgage balance to home value—stood at a less-than-alarming 0.84 in 2007.
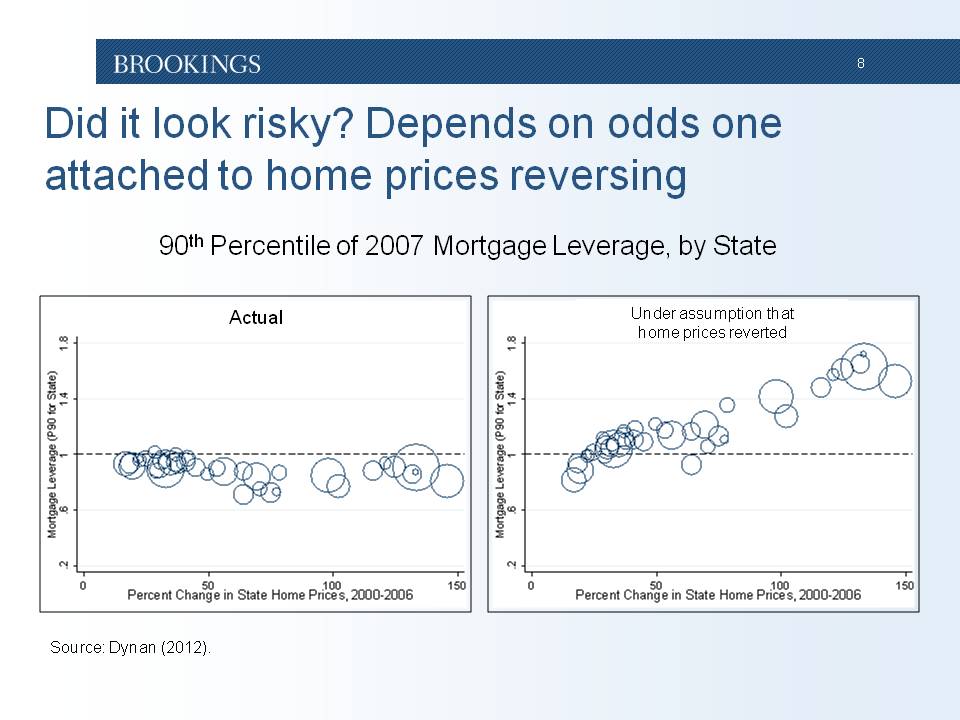
A key implication is that, even with the right micro data, one’s precrisis assessment of U.S. household financial conditions depended critically on whether one thought that the run-up in home prices might reverse (slide 8). This chart, which is again from my research, drives the point home. The bubbles in the panel at left correspond to different states and are sized to reflect each state’s population. In this panel I have plotted actual mortgage leverage at the 90th percentile against the home price appreciation the state saw during the housing boom. As you can see, if anything, actual mortgage leverage was lower for states with more home price appreciation. But, the panel at the right shows what mortgage leverage at the 90th percentile would look like if mortgage debt stayed the same but home prices reverted to the level they would be at if they had risen at just the rate of consumer inflation during the housing boom. Under this counterfactual scenario, highly leveraged homeowners in the housing boom states very clearly appear to be in a precarious situation.
The point is that correctly assessing the riskiness of U.S. household balance sheets in the precrisis period required not only the right data but the right perspective on home prices. There is a fascinating literature that documents the widespread reluctance of economists and others, including financial market analysts, to recognize the housing bubble. Gerardi, Foote, and Willen (2010) speculate that it goes against the basic training of economists to believe that assets can be substantially over- or under-valued.[2]
In any event, home prices did peak in 2006 and fell by close to one-third over the next 2½ years. As a result, mortgage leverage spiked and many homeowners were left “under water,” meaning that their mortgage loans exceeded the value of their homes. These highly leveraged households faced severe financial strains for several reasons. First, they no longer had home equity that they could tap into to support their spending. Second, although mortgage rates fell, they had difficulty refinancing into lower-rate loans in order to lower their monthly payment obligations. Third, they would have to take a loss if they tried to sell their homes in the face of job losses or other developments that impaired their ability to make mortgage payments.
Many homeowners defaulted under these circumstances, and we have seen millions of foreclosures in the United States. But, many others were simply left with extremely high levels of leverage. To give you an idea of the aggregate size of this problem, according to Corelogic, the share of mortgages that are under water has been running between one-quarter and one-fifth for the last several years, with the amount of negative mortgage equity currently totaling close to $700 billion.[3]
Let me turn now to how this debt overhang affected household spending and broader economic activity (slide 9).
The Effects of High Household Leverage on the U.S. Economy
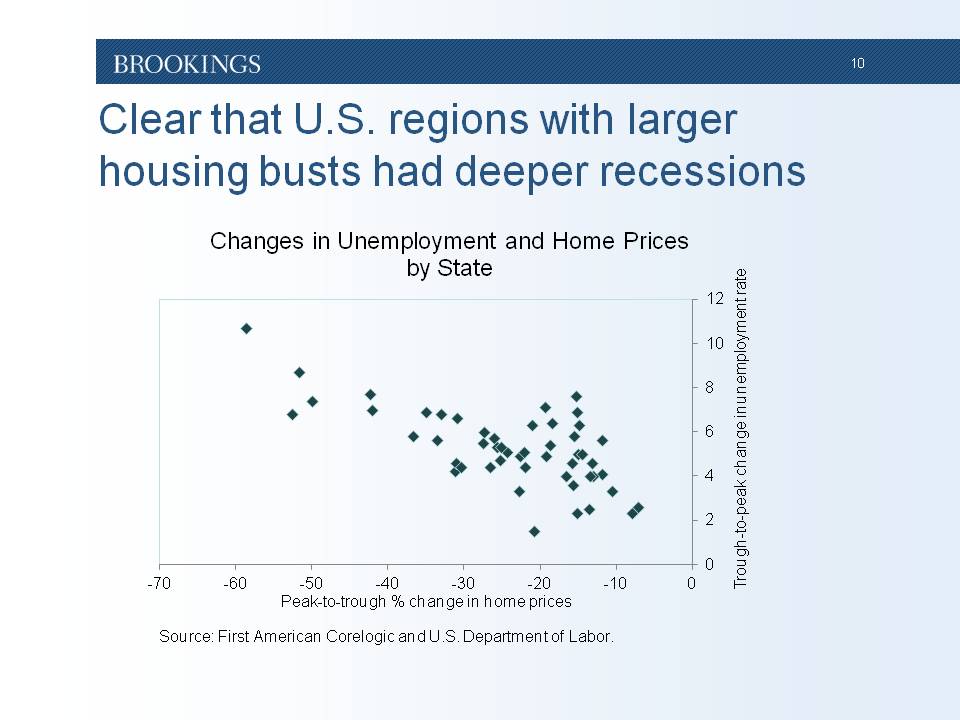
It is clear that the areas of the United States that suffered more pronounced housing busts—and, in turn, larger increases in household leverage—generally saw deeper recessions (slide 10). This slide plots the change in unemployment rate (trough to peak) against the change in home prices (peak to trough) by state. The negative relationship implies that that states that experienced larger home price declines also saw larger contractions in economic activity. Of course, correlation does not establish causality, but in a paper that corrected for possible endogeneity, Mian and Sufi (2011) found that shocks to household balance sheets account for a very large share of the jobs lost in the United States between March 2007 and March 2009. In a different paper, coauthored with Rao (2011), these authors found that consumption declined much more in regions with larger home price declines.[4]
But, does this mean that high household leverage in and of itself leads to depressed economic activity? No. A plunge in home prices affects household balance sheets in two distinct ways—it causes both an increase in leverage and a decline in overall wealth. Findings like those of Mian and Sufi could simply be the result of the latter change, particularly given the abundance of empirical support for wealth effects in the consumption literature.
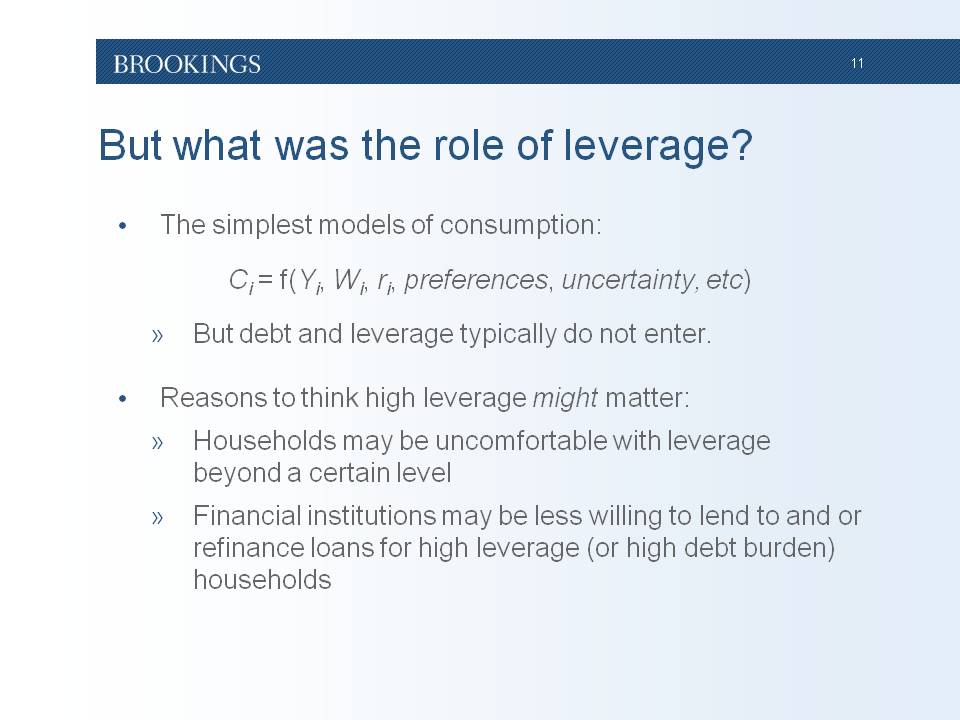
Basic economic theory does not offer a lot of guidance about the possible role of leverage (slide 11). According to the simplest models, a household’s consumption is determined by its income, wealth, the return it earns on savings, and preferences. In slightly more refined models, the uncertainty faced by a household plays a role, as does its ability to borrow. But, debt and leverage do not typically enter these simple models, nor the empirical specifications derived from them.
That said, we can think of several reasons why high debt and leverage might matter for consumption. First, some households may be uncomfortable with having leverage beyond a certain level; such households might reduce consumption in order to pay down debt when faced with a shock that increases leverage. Second, financial institutions may be less willing to lend to more highly leveraged households. As a result, the rise in leverage may have impeded some households from borrowing more to finance consumption and prevented others from raising their discretionary cash flow by refinancing into lower-rate mortgages. Similarly, the burden associated with debt service obligations might matter for the willingness or the ability of households to borrow.
Unfortunately, it is really hard to look for such effects using our standard macro empirical models. The challenge with putting debt-related variables into such models is that debt is often used to finance spending spurred by an unrelated development, such as good news about future income. It is generally difficult to disentangle this positive (and endogenous) relationship between household debt and consumer spending from any negative effect stemming from excessive indebtedness.
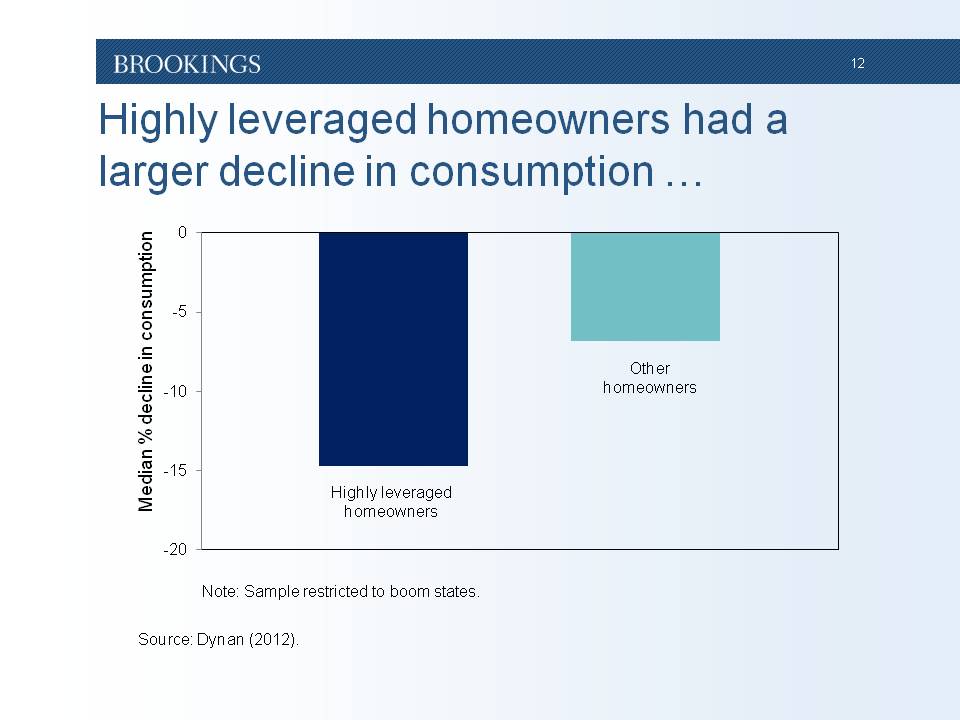
Hence, one again needs to look at household-level data. In my research, I started by simply looking at the change in consumption from 2007 to 2009, comparing homeowners with high leverage as of 2007 with other homeowners (slide 12). This chart shows results for housing boom states, where one might expect the effects to be most pronounced.
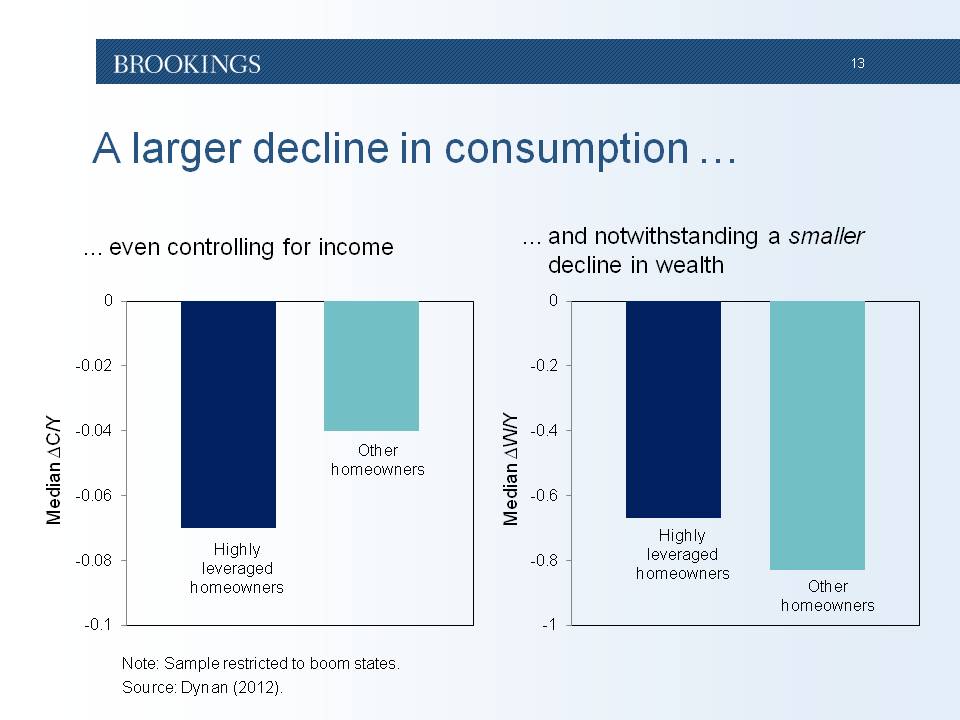
As you can see, highly leveraged homeowners in housing boom states—those captured by the dark blue bar—experienced a median percent decline in consumption that was nearly twice as large as that of other homeowners—captured by the light blue bar. Now, the highly leverage households did see a slightly larger decline in income. But, turning to the left panel on this next slide (slide 13), even if one scales consumption by income, one sees a considerably larger decline in consumption for highly leveraged households. And, this is not because highly leveraged homeowners experienced a larger decline in wealth—in fact, as you can see on the right, they experienced a smaller decline in wealth. So, these various charts suggest that the increase in leverage associated with the decline in home prices had an important depressing effect on the consumption of some households that goes beyond any wealth effects associated with the decline.
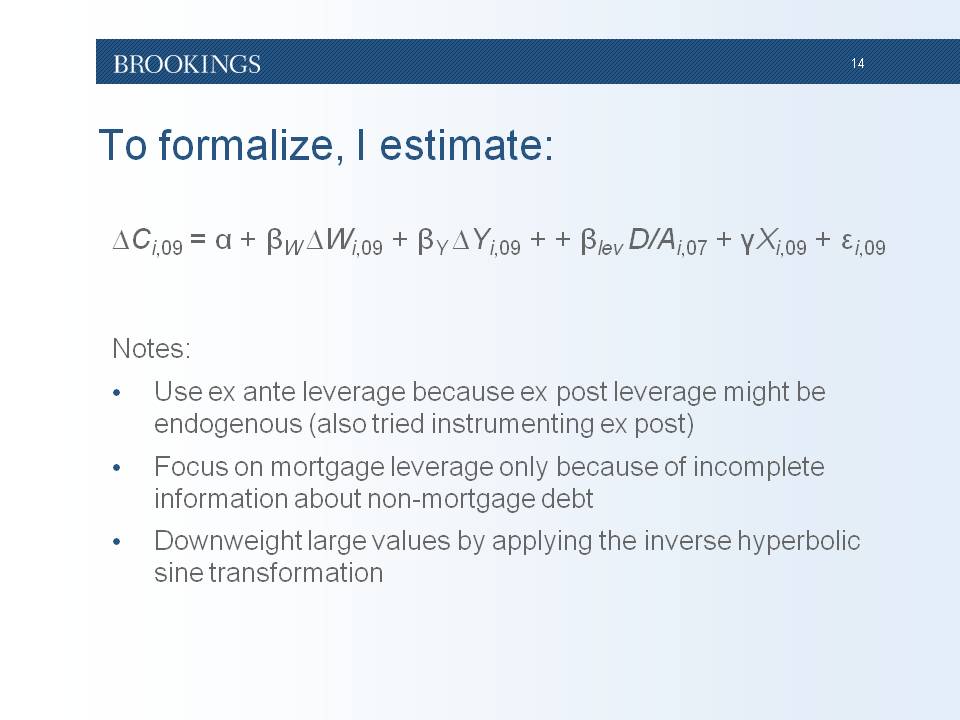
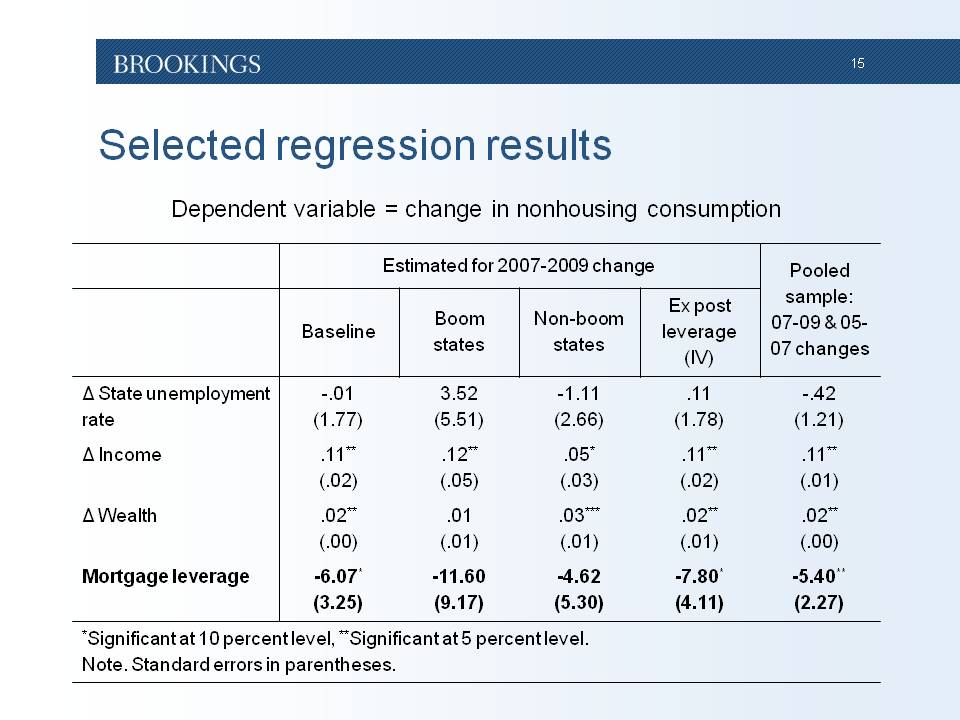
The next step was to test the hypothesis more formally using regression analysis (slide 14). Again, we are seeking to answer whether consumption has shown more weakness because of high leverage than would be expected given the movements in its other fundamental determinants, including the loss in wealth and weak income. This logic suggests estimating the following equation:

where the dependent variable is the change in the non-housing consumption of household i between 2007 and 2009, and the independent variables are the change in its wealth, the change in its income, its 2007 leverage and a vector of other variables that might also influence household consumption growth (such as the interest rate, economic conditions in the state, and demographic factors).
I use ex ante (2007) leverage in this equation because ex post (2009) leverage might be endogenous, although I also tried a specification where I instrumented ex post leverage. I focus on mortgage leverage only because of incomplete information about non-mortgage debt. In addition, I follow a long tradition in the empirical literature on household-level consumption and finances by using a transformation that downweights large values; in particular, I take the inverse hyperbolic sine of consumption, income, and wealth; the first differences can then be interpreted much like percent changes.
This table (slide 15) shows my results under some of the different specifications that I tried. The estimated coefficients on leverage—shown in the bolded row—were not very precise, most being statistically different from zero at between 5 and 10 percent levels of significance. The point estimates for the subsamples associated with different degrees of housing boom differ in the ways that one would expect, but, otherwise my point estimates were fairly similar across different specifications. At face value, a point estimate of -6.1 suggests that the effect of leverage on consumption could be material—an increase in a household’s mortgage loan-to-value ratio from 1.0 to 1.1 would have reduced its consumption growth by 0.6 percentage point over this 2-year period, or 0.3 percentage point per year.
Implications for the U.S. Economy
One big question, of course, is how important these effects are from a macroeconomic point of view (slide 16). I did not feel comfortable extrapolating from the data in the PSID alone because it is a small noisy survey and people have raised questions about its representativeness. But (slide 17), based on the aggregate mortgage leverage ratio I showed you earlier, we can say that the average homeowner has a mortgage leverage ratio that is running about 0.2 above its precrisis level. Applying my estimates—and taking into account the fact that about two-thirds of Americans own homes—one concludes that high leverage could be dampening aggregate consumption growth by ¼ to ½ percentage point per year.
But, this conclusion comes with a lot of caveats. First, the PSID, like most household surveys, contains a great deal of measurement error. Also, there might be important nonlinearities in the relationship that my specification did not capture. Perhaps, for example, high leverage only matters for consumption when the leverage ratio is above a certain level. In addition, the effects might have changed over time, as credit conditions have evolved, thanks in part to the government efforts to address the hardships imposed by high leverage. The measurement error likely imparts a downward bias to my estimated effects, but it is hard to call the direction of bias associated with the other factors.
Finally, I could not tell whether it is leverage per se that matters for consumption or whether it might be a different debt-related variable. We know, for example, that lenders look at how much of a household’s income goes toward required debt service payments when considering whether to extend credit and at what price. When I substituted the debt service ratio for the leverage ratio in my regressions, the results were very similar, which is perhaps not surprising given that both variables are a function of the level of debt. But, knowing the relative importance of these two variables is critical for assessing what is going on now because mortgage leverage and mortgage debt service have moved very differently over the past few years. While the aggregate mortgage leverage ratio has retraced very little of its jump during the housing bust, the aggregate homeowners mortgage debt service ratio has declined to its lowest level in a decade in part because of falling interest rates.
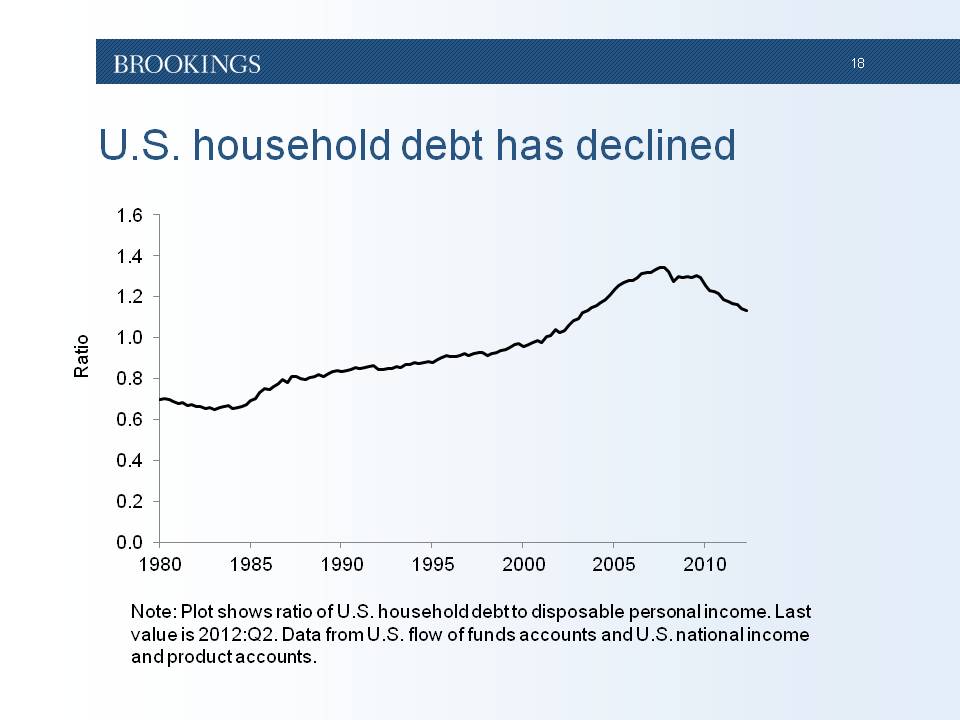
One more result from my research that I would like to feature pertains to how deleveraging is occurring. The United States has in fact seen a substantial drop in aggregate outstanding household debt (slide 18). Household debt has fallen by 6½ percent since its peak and the ratio of household debt to income now stands at its lowest level since 2003.
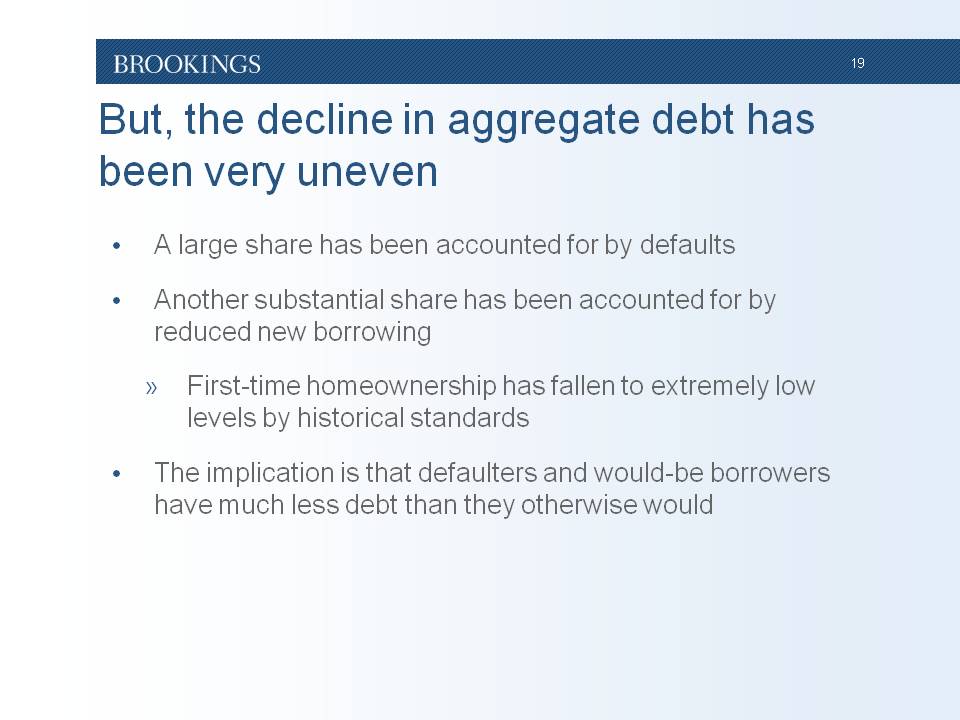
It would be a mistake, though, to think that these trends represent the experience of most households. In fact, the reduction in debt has been very uneven (slide 19). A large share of the decline in aggregate outstanding household debt has been accounted for by loans that were written off after going bad—in work that I did about a year ago, I calculated that the dollar volume of defaults on household debt was about two-thirds as large as the as-then total decline in household debt.
Another substantial share of the decline in aggregate household debt has been accounted for by reduced new borrowing, amid the extremely tight credit conditions that have prevailed in the United States in recent years. Many households with less-than-perfect credit applications have found it difficult, if not impossible, to obtain new loans. So, for example, in an analysis of credit records released earlier this year, Bhutta (2012) found that the pace at which people are becoming homeowners for the first time has dropped to about half that seen around the year 2000.[5]
The implication is that there are two types of households that have much less debt as the result of their experiences over the past few years—those who defaulted on their loans and would-be borrowers who could not get loans.
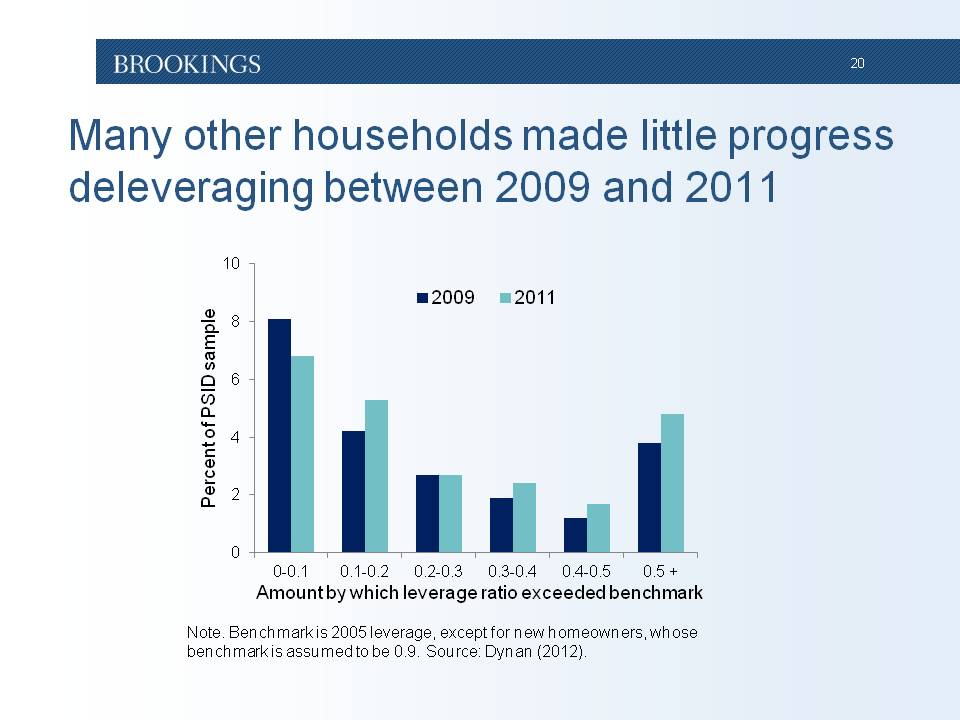
What about other households (slide 20)? My research suggests that many other households have made little to no progress reducing their leverage. I considered different benchmark levels of leverage that households might be trying to get back to. This chart compares excessive mortgage leverage as of 2009 (the dark blue bars) with that as of 2011 (the light blue bars) under the assumption that households are trying to get back to the same level of mortgage leverage as they had in 2005 (with the exception being new homeowners who are assumed to be trying to get back to a leverage ratio of 90 percent). Each pair of bars corresponds to the share of the full sample with different degree of excess leverage. So, for example, looking at the leftmost bar, about 8 percent of the sample had a leverage ratio that exceeded their benchmark by less than 0.1 in 2009.
The chart shows that the fraction of the sample with a little bit of excess leverage fell between 2009 and 2011, but that the fractions with higher degrees of excess leverage actually rose. So, on net, there does not appear to have been an improvement in the leverage situation of these households. In addition, this conclusion does not appear to be very sensitive to the choice of the benchmark levels of leverage.
Near-term Policy Challenges (slide 21)
This balance sheet research is highly relevant to certain challenges that U.S. policymakers are facing as they seek ways to both strengthen the as-yet weak economic recovery and to promote robust growth over the longer run.
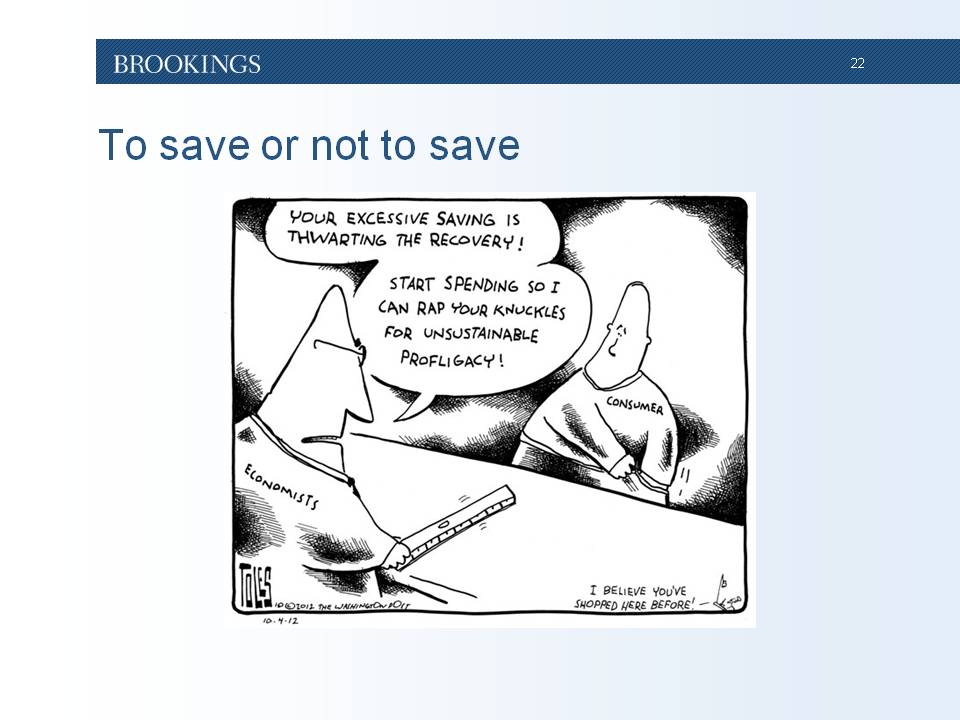
One challenge is that the various traditional ways for households to strengthen their balance sheets—saving more, paying down debt, and borrowing less—are good for economy over the longer run but bad over the shorter run. Over the longer run, such behavior will leave households in more secure and sustainable financial positions and thus presumably will leave the household sector and, in turn, the broader economy less vulnerable to shocks. But, over the shorter run, of course, these steps are all associated with spending less and therefore imply weaker aggregate demand. A recent Tom Toles cartoon that appeared in The Washington Post (slide 22) depicts the basic dilemma, with the pointy-headed economist staring harshly down at the American consumer saying “Your excess saving is thwarting the recovery” and then adding “Start spending so I can rap your knuckles for unsustainable profligacy.”
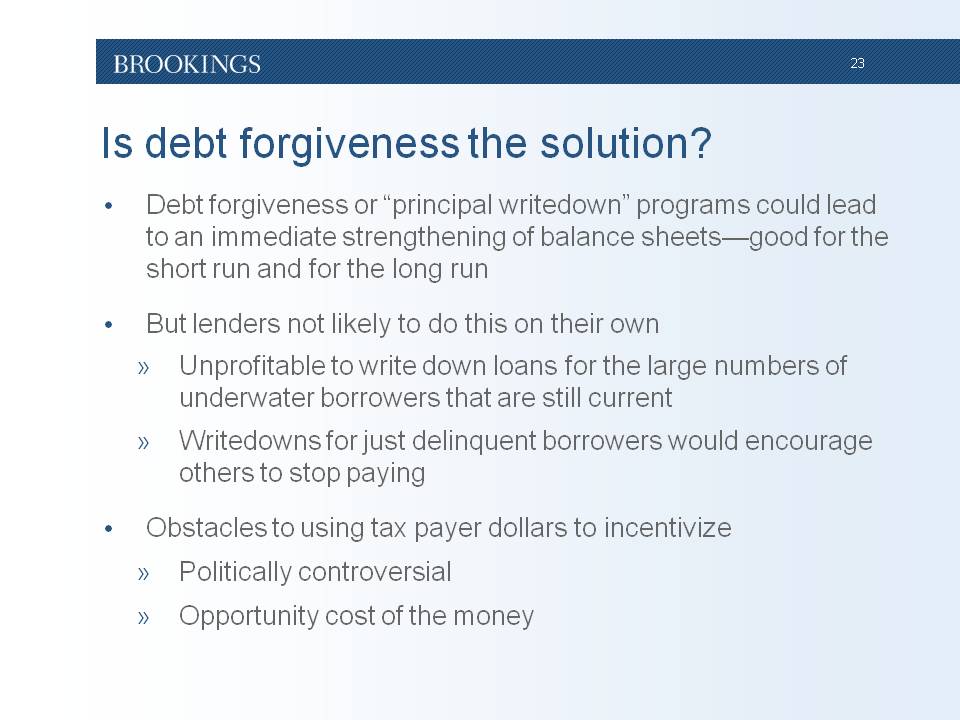
An issue that frequently comes up in policy circles is whether we can “have our cake and eat it too” through debt forgiveness, sometimes also referred to as “principal writedowns” in mortgage circles (slide 23). The idea is that if we could somehow make households’ excess debt disappear, then we would enjoy a substantial immediate strengthening of household balance sheets, which would be good for the economy both over the short run and over the longer run.
The problem is that lenders are not likely to undertake such programs on their own. It is true that it is better for lenders to forgive mortgage debt that exceeds the value of the underlying property rather than have a troubled mortgage go into foreclosure because the latter entails considerable legal and administrative costs and, when all is said and done, the lender will have to take the loss on the property anyways. But, the vast majority of underwater borrowers—more than 70 percent according to a study that the Federal Reserve Board released earlier this year—are actually still making their mortgage payments.[6] So, lenders would take enormous losses were they to do broad-based forgiveness of negative equity. They could narrow any debt-forgiveness program to include just those mortgages in default and likely to go into foreclosure, but then they would encourage the current borrowers to stop making their paying their mortgages and again suffer losses.
Of course, the U.S. government could incentivize debt forgiveness by paying lenders to do the write-downs. However, this idea is probably infeasible for political reasons—there has already been great public debate over whether such a program would be fair. True or untrue, there is a perception that many troubled borrowers came to be so because they were imprudent or gamed the system. Fairness issues aside, there are important efficiency questions associated with the debt forgiveness issue—is it worth it to use tens of thousands of dollars to save a single mortgage when that money could, for example, be put toward saving the job of a teacher in a fiscally challenged state?
Lessons and Directions for Future Research
I would like to finish off with the lessons I draw from the recent research on deleveraging as well as the broader experience of the U.S. economy over the last several years (slide 24).
One important take-away is that high leverage does seem to be holding back economic activity. Recall that when I say this, I mean that high leverage is having a damping effect on consumer spending that goes above and beyond the pure wealth effects associated with the plunge in home prices during the housing bust.
That said, the work I described was really only a starting point—there are some very important unanswered questions about the relationship between consumption and debt that we need to tackle. One priority is getting a better handle on the current quantitative importance of the debt overhang. Strong advocates of government debt forgiveness programs tend to argue such programs would be well worth it because excess household leverage is a central force holding back the economy. At face value, my own results suggested that while excess household leverage may be creating hardship for some families, the effect on the U.S. economy as a whole is only modest. But, as I noted earlier, limitations in my data source mean that you should take this sort of calculation with a large grain of salt.
A related question for future research concerns why high leverage seems to be associated with weaker consumption. As I noted earlier, there are several possible channels. Households may be paring back their consumption to pay down debt and bring leverage back into what they view as their comfort zone. Alternatively, highly leveraged households might not be choosing lower consumption so much as having it forced upon them because of difficulty obtaining new loans to finance consumption or refinancing old ones at lower interest rates. Distinguishing which of these channels are behind the finding that higher leverage is associated with weaker consumption is important, of course, because it informs U.S. policymakers about where they should direct their efforts.
Finally, let me offer a couple of specific thoughts about the tools policy analysts to have traditionally used to monitor household financial conditions.
The first is that, for the purposes of preventing a crisis like this in the future, we need better ways to identify the risks associated with household balance sheets. A central lesson of the past few years is that the tails of the distribution can matter, and that the traditional household financial indicators that many analysts were focusing on during the credit boom—such as the various aggregate debt and debt service ratios—simply do not offer much information about what is going on in these tails.
Furthermore, information about the distribution of debt may be necessary for understanding the risk being taken on by households but it is not sufficient. We need to learn more about how much debt represents too much debt for any given household.
U.S. policy analysts are, in fact, making much more use of micro data, such as mortgage records and credit bureau data, but it is important that such efforts continue even after the economy is fully healed. And, we should also consider whether it is enough that government agencies are using such measures internally or whether there is a case for releasing more information about the distribution of debt to the public such that the issues can be examined and debated openly, including in forums like this one.
My second thought about tools has to do with how we analyze the relationship between debt and consumption. The macro models traditionally used for forecasting aggregate consumer spending typically make limited use of balance sheet information, including just overall net worth or net worth divided into a couple of components. It is not clear that these models can be improved upon given that it is generally difficult to disentangle any negative effects of excess debt from the positive (and endogenous) relationship that arises from the fact that debt is often used to finance spending spurred by an unrelated development. This means that policymakers need to be complementing the purely macro approach to analyzing and projecting consumer spending, with more use of micro data, a thought that surely resonates with the attendees of this conference.
Thank you.
Related Content


Related Books


The Brookings Institution is committed to quality, independence, and impact.
We are supported by a diverse array of funders. In line with our values and policies, each Brookings publication represents the sole views of its author(s).


Commentary
The U.S. Household Debt Overhang
October 25, 2012