

This post updates with year-end 2022 data the External Wealth of Nations database [Excel download], which assembles data on external claims and liabilities of economies around the world. The database is described in more detail in a series of papers (Lane and Milesi-Ferretti 2001, 2007, 2018), and in a companion post. The data are annual for the period 1970-2022 and cover 212 countries and territories, plus the euro area and the Eastern Caribbean Currency Union (ECCU). The data update to 2022 is currently available for 174 economies (plus the euro area and the ECCU), including the 75 largest. The data are updated at regular intervals. The 2022 update will be completed for the entire sample at the end of 2023.
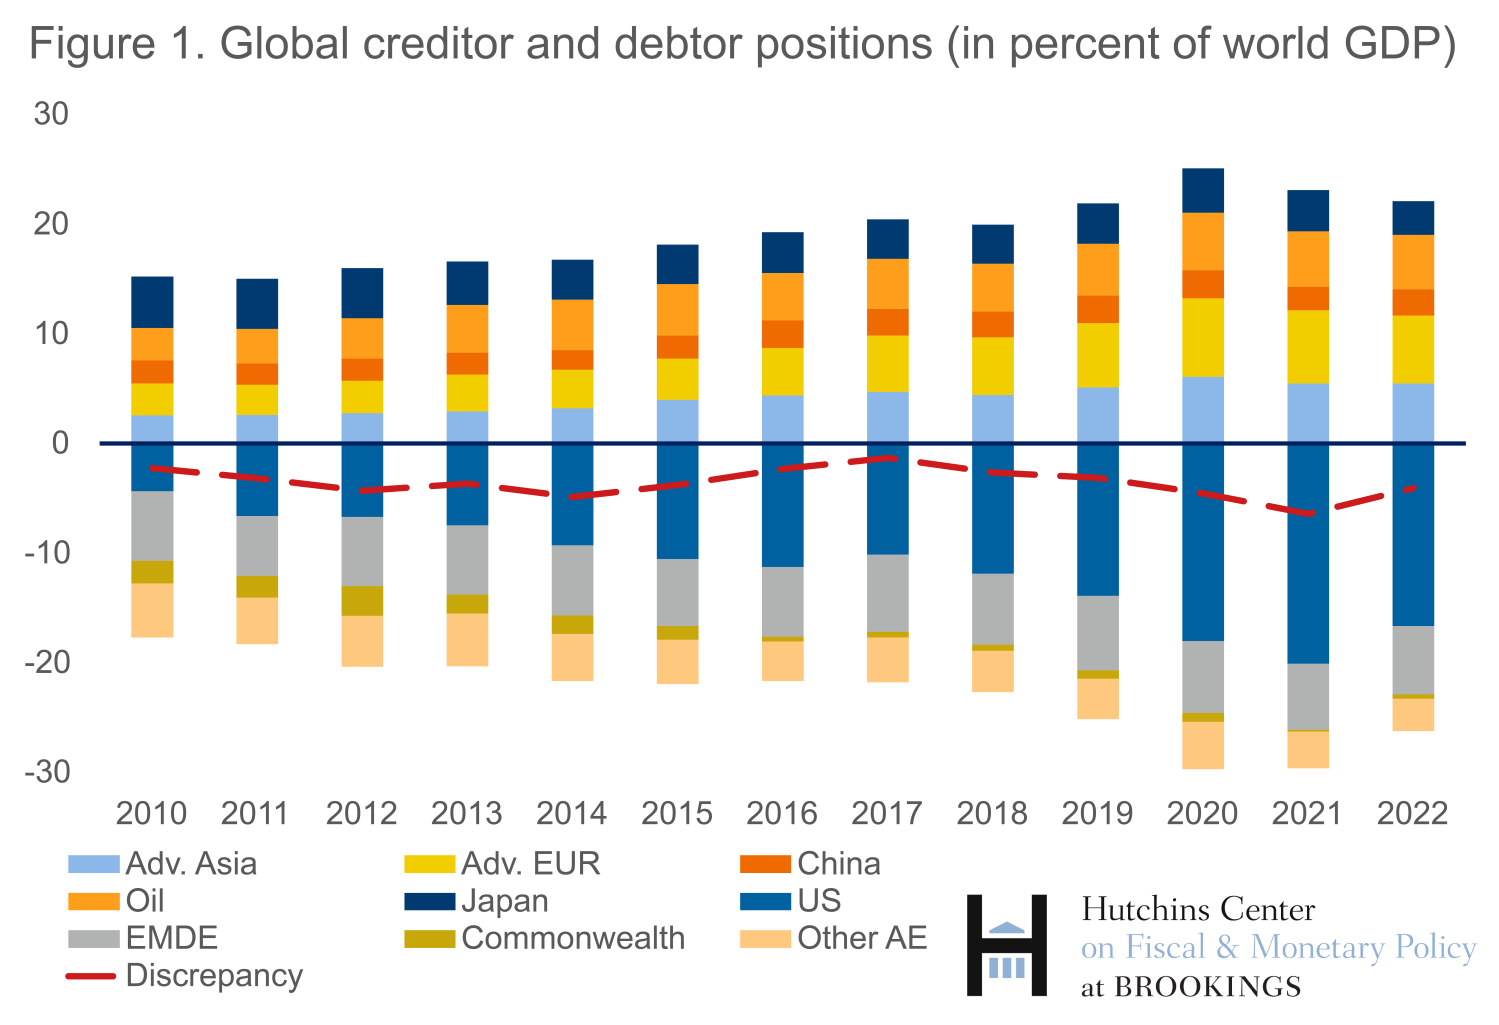
Global inflation, declining stock prices, and rising energy prices were the three major forces that shaped the evolution of external positions during 2022. Relatively high inflation contributed to reducing the ratios of net creditor and debtor positions in relation to GDP by increasing the value of the denominator. Declining stock prices worldwide reduced the creditor positions of countries with large holdings of foreign equity (for instance, countries with large sovereign wealth funds) and the liability positions of countries for which a sizable fraction of domestic equities are owned by nonresidents. Finally, high energy prices boosted the current account surpluses of energy exporters, such as several countries in the Middle East as well as Norway, contributing to net foreign asset accumulation. At the same time, higher energy prices worsened current account positions in energy importers, with opposite effects on the external position. The net effect of these shocks has been a compression in global creditor and debtor positions in relation to world GDP (Figure 1). A forthcoming paper by this author discusses in detail the factors explaining the evolution of global creditor and debtor positions since the global financial crisis of 2008-09 for all country groups in the figure above. In this post, we illustrate developments in 2022 using three interesting examples: the United States, Norway, and Taiwan.
United States
Net external positions measure the difference between the value of assets owned abroad by a country’s residents and the value of assets in a country owned by nonresidents. At the end of 2021, the U.S. had a net external debtor position exceeding 80% of its GDP. By the end of 2022, its net external liabilities had declined by $2.6 trillion (over 10% of 2022 GDP). In addition, nominal GDP growth in 2022 of over 9% reduced the ratio of net external liabilities to GDP by a further 7 percentage points, bringing the external position to 63.5% of GDP at end-2022. This value is still elevated, both by U.S. standards (it was exceeded only in 2020 and 2021) and is the highest both in absolute terms and in relation to GDP among all major economies. As discussed in a 2022 blog, there are mitigating factors. The U.S. net liability position reflects in part the high market valuations of U.S.-based firms (whose shares are held in part by nonresidents), but these valuations also contribute to boosting U.S. wealth (since U.S. residents still hold most of these shares). Furthermore, the valuation method for foreign direct investment may overstate the value of foreign investment in the U.S. At the same time, however, the net position in debt instruments remains highly negative, despite an improvement in 2022 due to declining bond prices. With higher interest rates servicing costs will rise.
Figure 2 illustrates the impact that international financial transactions, changes in exchange rates, and changes in asset prices (such as stock and bond prices) on U.S. external assets and liabilities between end-2021 and end-2022. Despite positive net purchases of foreign assets by U.S. residents and positive net purchases of U.S. assets by foreign residents, the value of both assets and, especially, liabilities declined sharply. The appreciation of the U.S. dollar against major partner currencies in 2022 reduced the dollar value of U.S. assets (gray bar) and the sharp decline in U.S. and global stock and bond prices reduced the value of outstanding assets and liabilities.
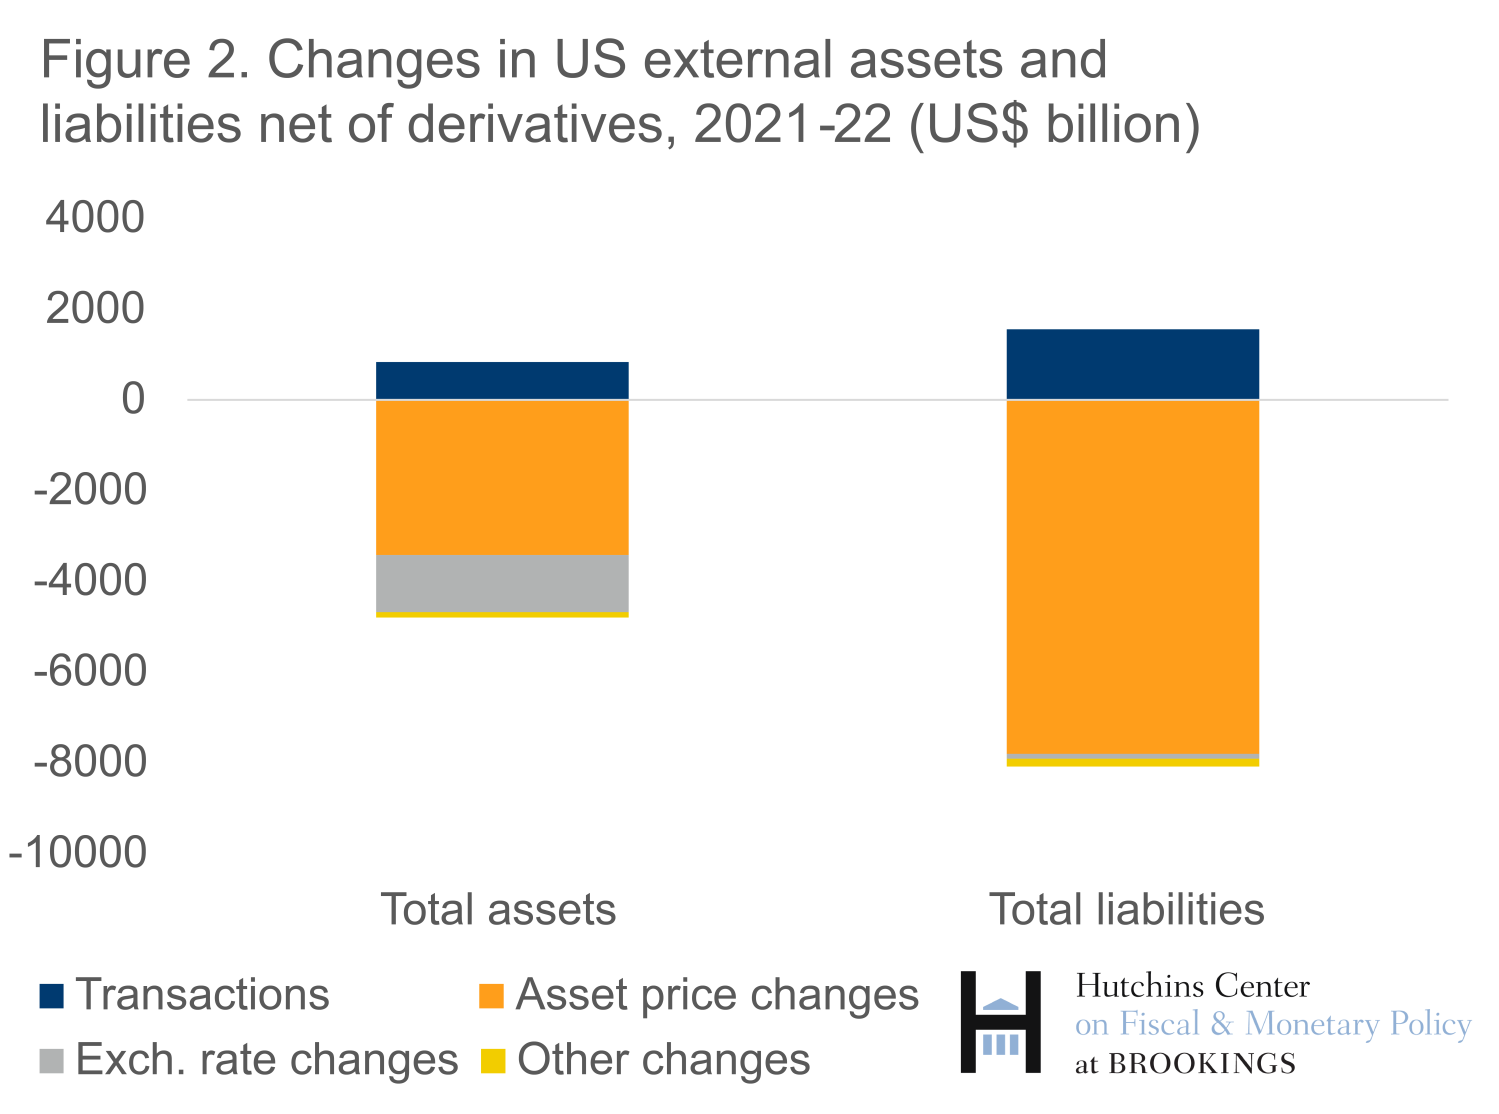
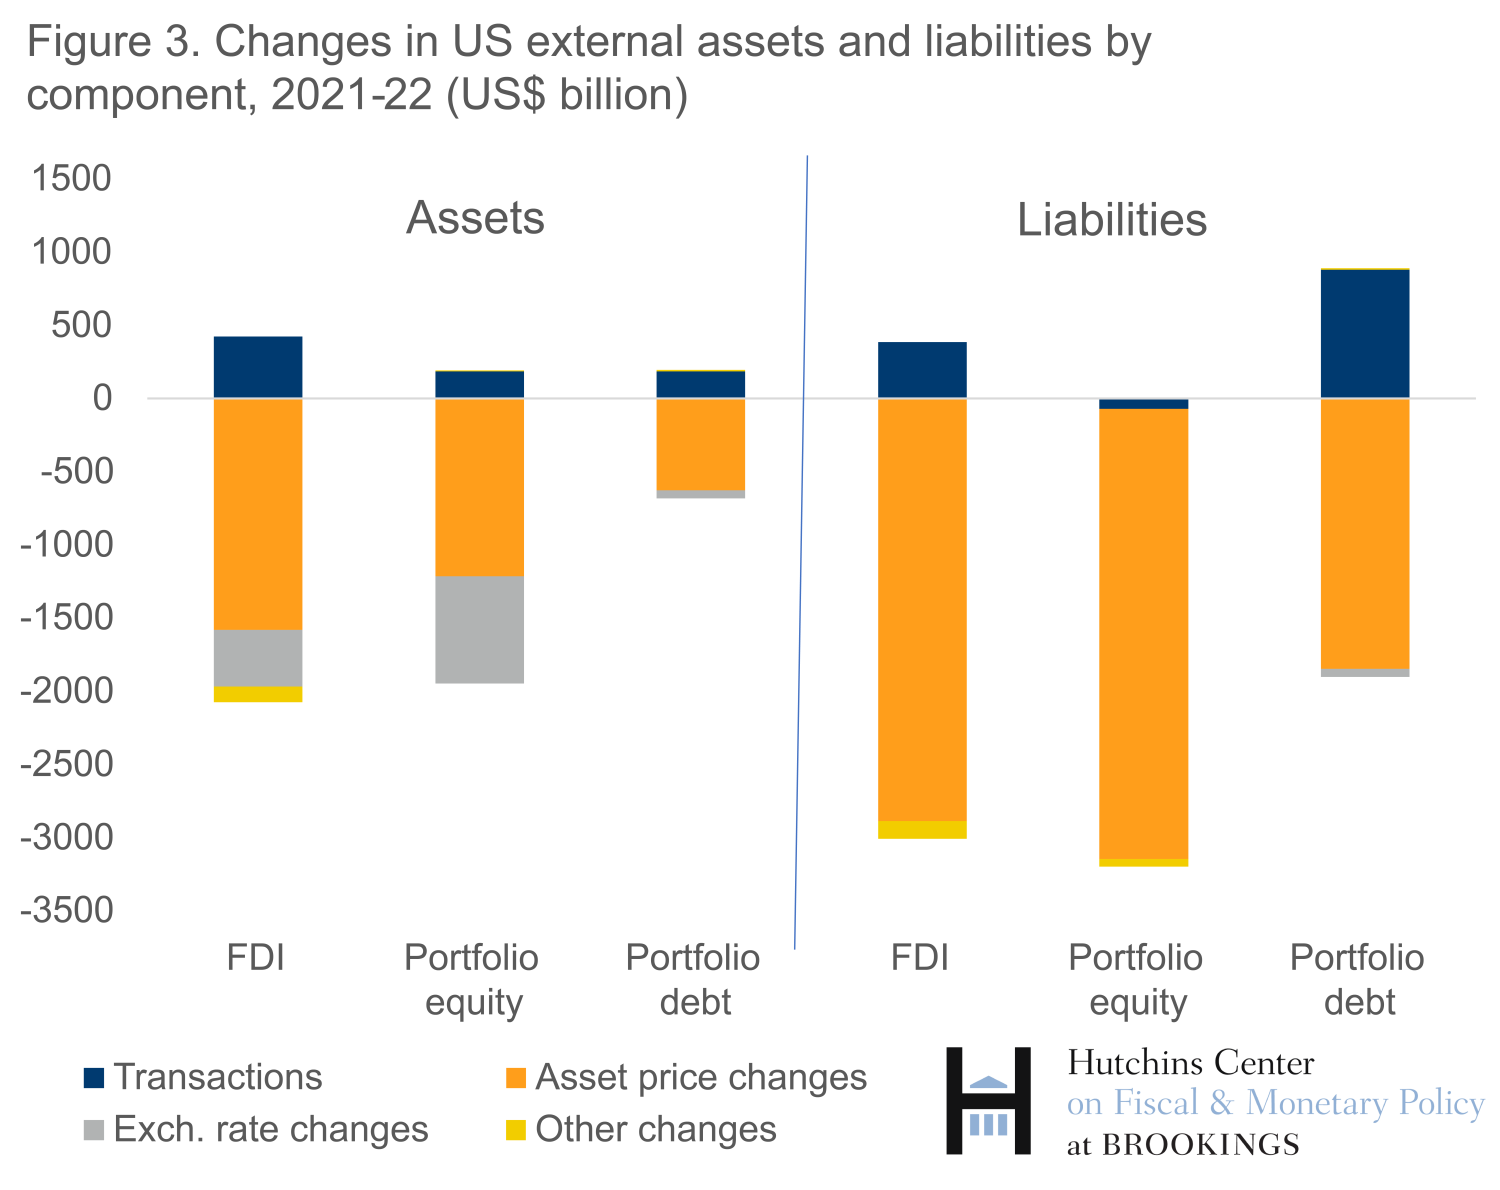
Figure 3 illustrates the extent of changes in valuation by component of the U.S. external portfolio. Because U.S. bonds held by nonresidents vastly exceed foreign bonds held by U.S. residents, the global decline in bond prices triggered by higher long-term interest rates reduced the value of U.S. liabilities by much more than the value of U.S. assets (3rd and 6th bar). Similarly, the decline in U.S. stock prices was a bit larger than the decline in partner country stock prices, and according to Bureau of Economic Analysis estimates foreign holdings of equity and foreign direct investment in the U.S. exceeded the corresponding U.S. holdings overseas in 2021. As a result, valuation changes reduced the value of U.S. liabilities in those categories by more than the value of U.S. assets.
Canada’s external position is closely tied to that of the U.S., since the lion’s share of its external assets are invested in the United States. As discussed in a blog last year, between 2010 and 2021 Canada’s external position benefited substantially from the rising market value of its U.S. holdings, particularly equity positions, but the 2022 decline in U.S. stock prices implied a deterioration of its net creditor position by $370 billion.
Norway
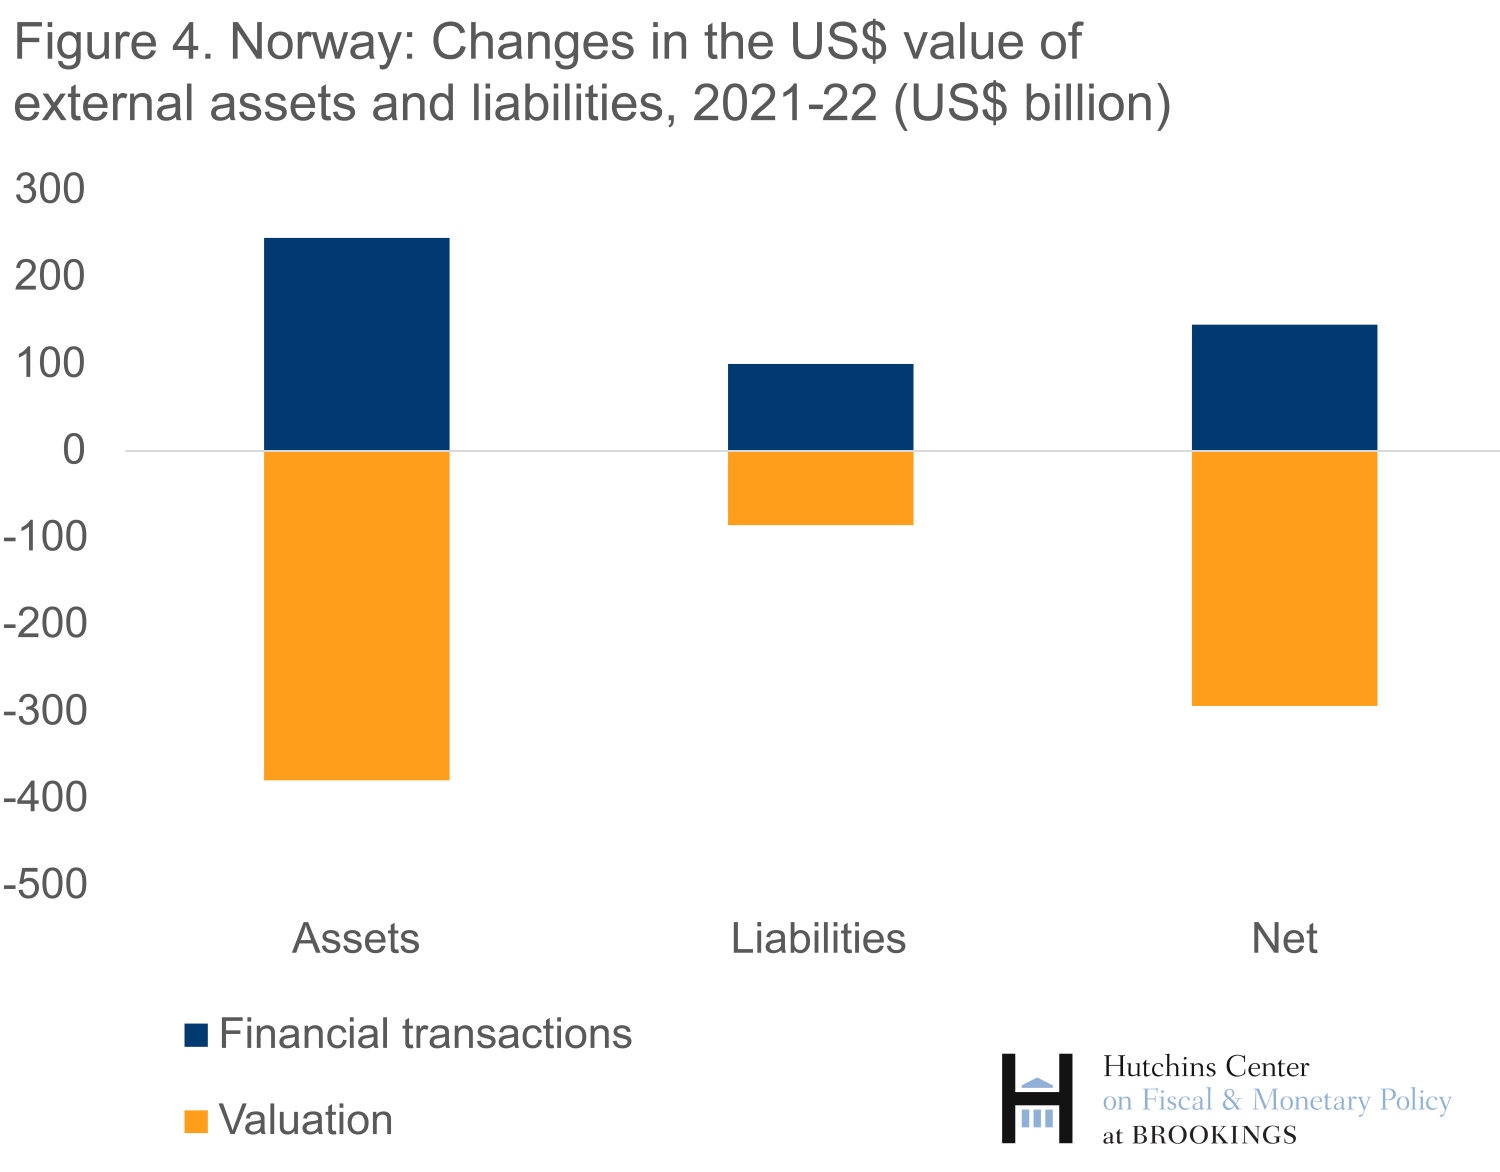
Norway is a large creditor because of its sizeable sovereign wealth fund, which invests the proceeds of oil and gas export revenues in international financial markets. The country’s net external creditor position at the end of 2021 exceeded $1.3 trillion. In 2022 the country ran a gigantic current account surplus: $175 billion, or 30% of GDP, buoyed by the increase in the price of oil and gas exports, which implied a further sizable accumulation of foreign assets.
However, the decline in world stock prices (20% according to the Morgan Stanley Capital International global index) reduced the value of its equity portfolio abroad by over $250 billion. As a result, its net creditor position actually declined in absolute terms by around $150 billion (Figure 4). 1 When calculated in relation to the size of the economy, the decline in the net creditor position was much larger. Nominal GDP increased sharply in 2022, reflecting general inflation but especially higher oil and gas prices, an important component of Norway’s GDP. As a result of a declining numerator and rising denominator, the net creditor position as a share of domestic GDP fell by close to 70 percentage points.
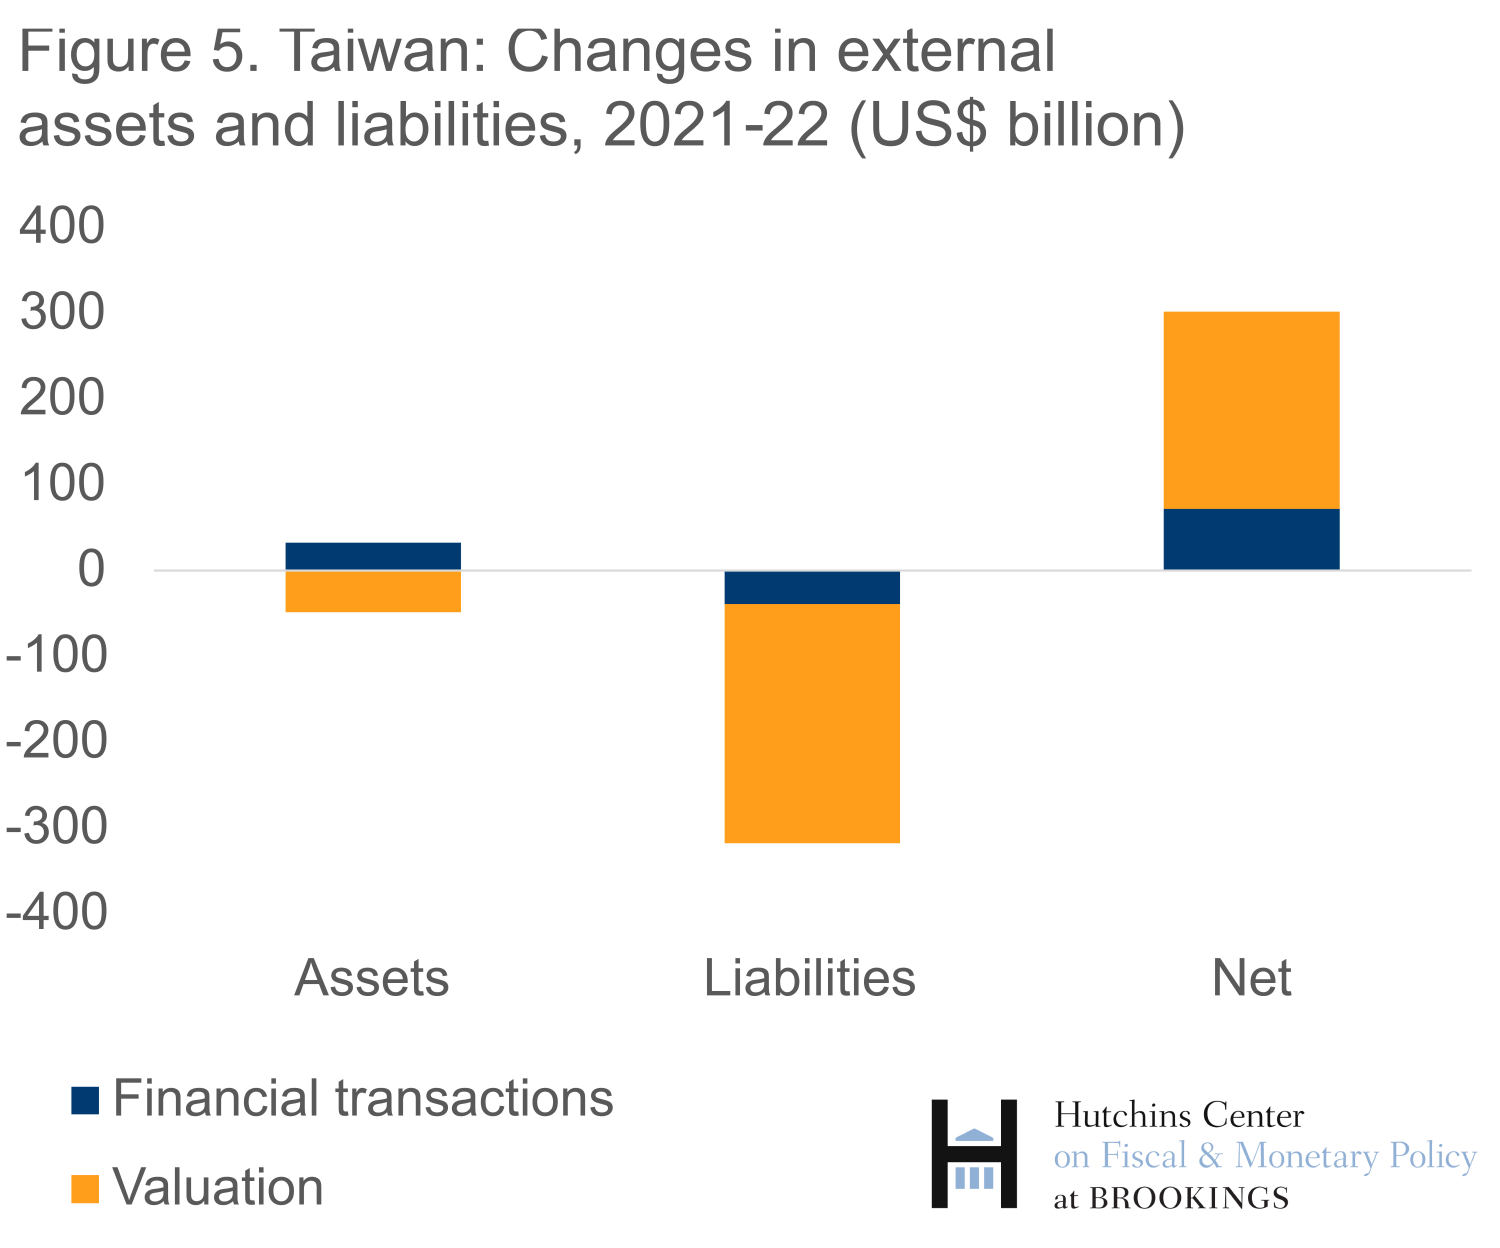
Taiwan
Taiwan is another large external creditor. Unlike most other large creditors, its net external position, which exceeded $1.4 trillion in 2021, improved by $300 billion in 2022, far in excess of its $100 billion current account surplus (Figure 5). The main reason was the decline in global equity prices, which pulled down the equity prices of Taiwan’s companies. Taiwan’s portfolio equity liabilities (the value of shares of Taiwanese companies owned by nonresidents) were around $830 billion at the end of 2021, or some 110% of GDP, much higher than the holdings of shares of foreign companies by Taiwanese residents. These foreign holdings of Taiwanese equity reflect to an important extent shares in TSMC, the leading producer of advanced semiconductors. TSMC’s market capitalization, above $600 billion at the end of 2021, is about one-third of the total capitalization of the Taiwan stock exchange and about 10 times the size of the next largest firm, Foxconn. TSMC’s share price in 2022 declined by over 30%, contributing substantially to the $300 billion decline in the value of Taiwan’s equity liabilities.
Related Content

Author
Note: This version of the dataset corrects an error in the data and metadata for Curaçao posted on October 17. The remaining data are unchanged.
-
Acknowledgements and disclosures
The Brookings Institution is financed through the support of a diverse array of foundations, corporations, governments, individuals, as well as an endowment. A list of donors can be found in our annual reports published online here. The findings, interpretations, and conclusions in this report are solely those of its author(s) and are not influenced by any donation.
-
Footnotes
- The decline in domestic currency, while still sizable, was smaller, because the krona depreciated by about 10% vis-à-vis the dollar, thus raising the domestic-currency value of its foreign assets in 2022.
The Brookings Institution is committed to quality, independence, and impact.
We are supported by a diverse array of funders. In line with our values and policies, each Brookings publication represents the sole views of its author(s).