Come October, the maximum benefit levels in the Supplemental Nutrition Assistance Program (SNAP, formerly the Food Stamp Program) will be based on the market basket costs of the 2021 Thrifty Food Plan. The result will be an increase of 21 percent — about 40 cents per person per meal — in the maximum SNAP benefit over the pre-pandemic amount. Because the 21 percent increase will go into effect at the same time that a temporary 15 percent boost in benefits provided under the American Rescue Act expires at the end of September, the actual increase that program participants will see will be smaller.
For the first time, purchasing power will increase as a result of implementation of a new Thrifty Food Plan (Thrifty), a model food plan calculated by the US Department of Agriculture (USDA) that is supposed to be based on the cost of purchasing a modest but healthy diet for a family of four. The real purchasing power of the Thrifty, which was last updated in 2006, has been unchanged since 1975, when its real value was tied to the 1962 Economy Meal Plan.
Prior updates to the Thrifty have been cost-neutral in order to keep its real value unchanged. Because real food costs for a typical family have increased, however, each Thrifty recalculation has skewed away from actual consumption patterns to a simulation far outside a reasonable, balanced, or purchasable diet. As a result, SNAP benefits have been inadequate.
In both the 2006 and 2021 Thrifty recalculations, the USDA determined that it was not possible to spend the same amount of money it cost in the 1960s (after adjusting for inflation) to purchase an adequate diet at minimal cost. Put simply, the math just didn’t add up, and something had to give. In 2006, the USDA decided that the nutrition standards would not be met in order to maintain cost-neutrality. This made the math work, but the resulting Thrifty was based on a market basket far different from what families actually ate and no longer provided sufficient resources to purchase an adequate diet.
In the aftermath of that decision, the 2008 Farm Bill clarified and the 2018 Farm Bill affirmed that the USDA has authority over the calculation of the Thrifty. Moreover, in the 2018 Farm Bill, Congress required the recalculation of the Thrifty by 2022 and every five years thereafter, declaring the Thrifty should be “based on current food prices, food composition data, consumption patterns, and dietary guidance.” In 2021, the USDA again determined that it was not possible to spend the same amount of inflation-adjusted dollars that it cost in the 1960s to purchase an adequate diet in 2021 and allowed the data to drive its update.
Calculating the SNAP Maximum Benefit
SNAP provides resources for eligible families to raise their food purchasing power and, as a result, improves their health and nutrition. SNAP is able to make these improvements efficiently by providing benefits on a debit card that households can use at more than 248,000 grocery stores and food retailers nationwide. While there is evidence that SNAP is effective across many dimensions—lifting millions out of poverty, supporting work, providing economic security, encouraging self-sufficiency, reducing food insecurity, and improving health and education outcomes—to date, the value of the SNAP maximum benefit has been insufficient to provide adequate nutrition assistance for eligible households.
The value of the SNAP benefits that a household receives is a function of three factors: (1) how much the USDA determines it minimally costs to achieve a healthy diet, (2) how much money the household has available to purchase necessities, and (3) what share of that available money the government expects a household to spend on groceries. Households with no net income (i.e. income after expenses like rental and child care costs) receive the SNAP maximum benefit for their household’s size. Those with positive net income see their benefit levels reduced by 30 cents for each dollar of net income. The SNAP maximum benefit for a household of a given size is based on the cost of the Thrifty for a household of four, with household size adjustments then incorporated.
While previously the Thrifty was recalculated infrequently and on an ad hoc basis, Congress now mandates that the USDA produce an update by 2022 and then regularly every five years thereafter. SNAP benefit levels are adjusted each October to reflect changes in the cost of the foods in the Thrifty over the past year; the benefit levels for the 12-month period starting each October are set equal to the cost of the Thrifty in the previous June.
Prior Thrifty Calculations: Rearranging Ingredients in the Same Size Grocery Cart
When the Thrifty Food Plan was first produced in 1975, and in each subsequent revision (in 1983, 1999, and 2006), its value was restricted in inflation-adjusted terms to the cost of purchasing a nutritionally adequate diet under the lowest-cost, most minimal of several food plans USDA issued back in 1962. As a result, past updates of the Thrifty were not allowed to result in any increase in the purchasing power of the SNAP maximum benefit, irrespective of what the data showed.
Figure 1 shows the average purchasing power of SNAP for 30 market areas in the continental United States from 1999 to 2010; if the Thrifty were sufficient to purchase the prescribed market basket, its purchasing power would be 100 percent. This figure, based on research by Erin Bronchetti, Garret Christensen, and Hilary Hoynes, illustrates that purchasing power was not at 100 percent and did not increase following the Thrifty recalculations in 1999 and 2006. Purchasing power did increase on a temporary basis for several years starting in 2009 when Congress adjusted the value of the SNAP maximum benefit during the 2009 recession under the American Recovery and Reinvestment Act (ARRA): a family of four initially saw a 13.6 percent increase in the SNAP maximum benefit.
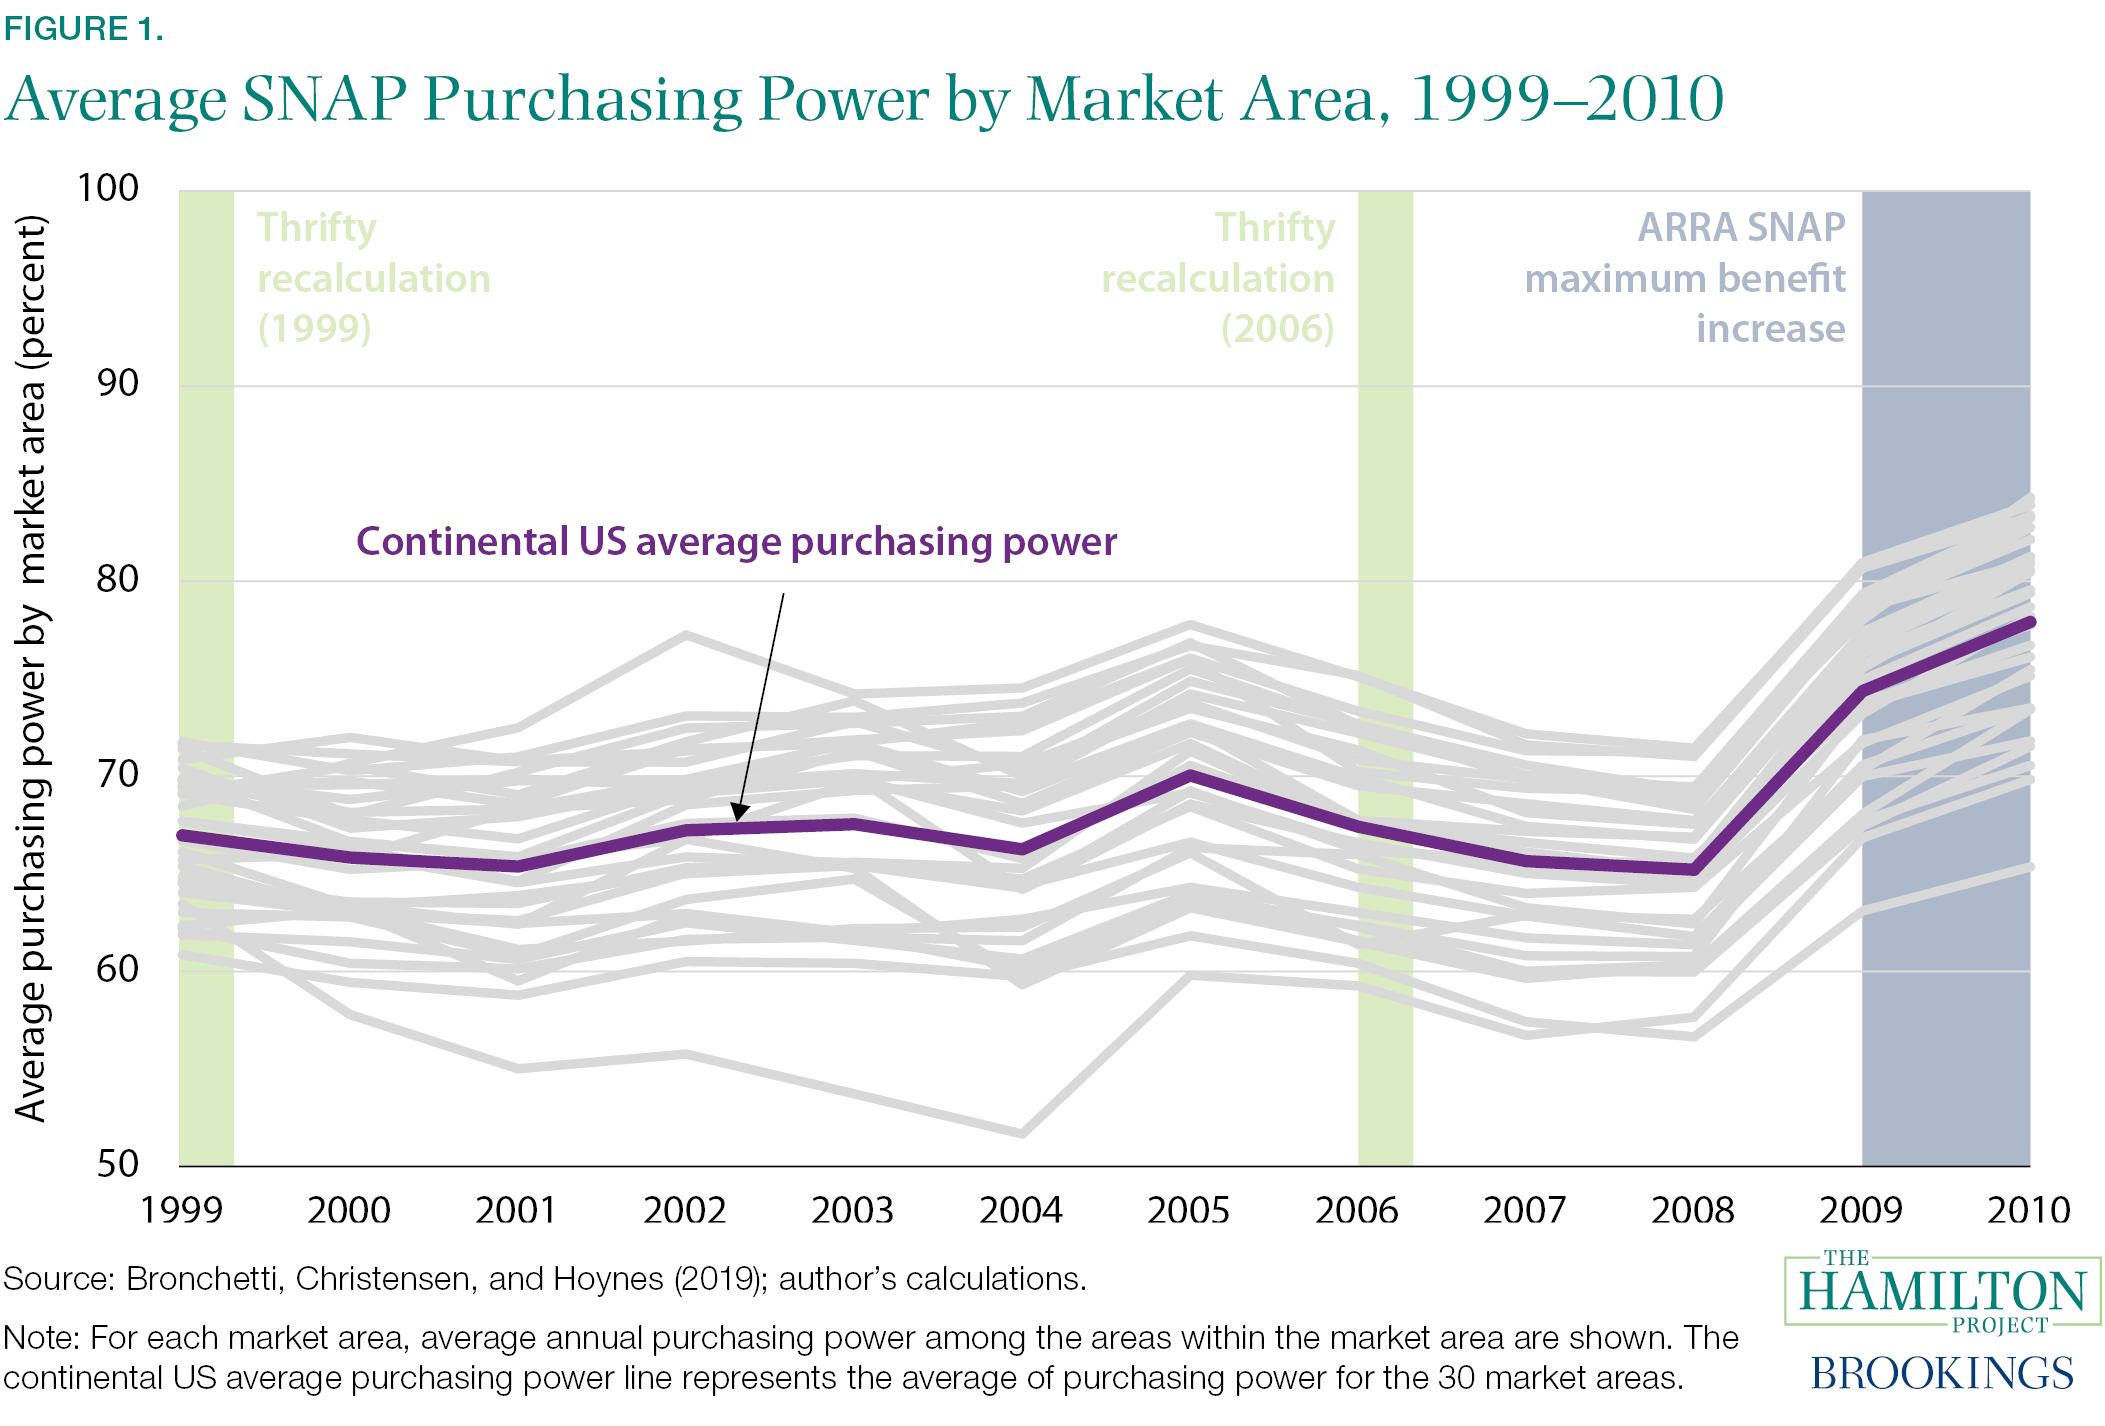
More recently, SNAP purchasing power increased when Congress enacted a temporary 15 percent maximum benefit increase in January 2021, and it will increase somewhat more in October 2021 when the 2021 Thrifty goes into effect. Based on the 2006 Thrifty, Elaine Waxman, Craig Gundersen, and Megan Thompson found that, in 2015, SNAP benefits could not cover the cost even of meals based on the inadequate Thrifty itself in 99 percent of counties in the United States. Waxman, Gunderson, and Olivia Fiol estimate that, following the 15 percent maximum benefit increase in January 2021, the benefit could cover the cost of a Thrifty-based meal in about 60 percent of counties. Following the publication of the 2021 Thrifty, those authors found that the new benefit will increase the share of counties in which SNAP benefits can cover the cost of a Thrifty-based meal to 80 percent of counties.
What SNAP Purchasing Power Buys
There are immediate as well as long-term consequences to food insecurity and inadequate nutrition. Children born into food-insecure households are at increased risk of birth defects, have less nutritious diets, and tend to be in poorer health – conditions which follow them for a lifetime. Food insecurity affects adults and older adults along the same dimensions and can result in poorer mental and physical health and nutrition.
The evidence is clear that SNAP purchasing power is related to critical measures of well-being, including food security. In places with higher food prices, household, adult, and child food insecurity rates are higher. Craig Gunderson, Elaine Waxman, and Amy Crumbaugh find that increasing SNAP purchasing power will cause a substantial decline in food insecurity among SNAP recipients. Similarly, Bronchetti, Christensen, and Hoynes estimate that increasing SNAP’s purchasing power by 10 percent can reduce food insecurity among children by 21.8 percent.
During the Great Recession, the SNAP maximum benefit increase reduced food insecurity and improved economic conditions for affected households. The ARRA benefit increase kept a million people out of poverty in 2010, above and beyond SNAP’s base benefit levels. Households with incomes below 130 percent of the federal poverty line saw their food insecurity rates decline by 2.0 percentage points relative to what was expected, while households with incomes generally too high to qualify for SNAP benefits saw their food insecurity rates increase relative to expectations. In addition, very low food security among children (meaning that children didn’t have enough to eat regularly) declined with the ARRA benefit increase and increased when these funds receded.
2021 Thrifty Calculation: A Bigger and Healthier Grocery Cart
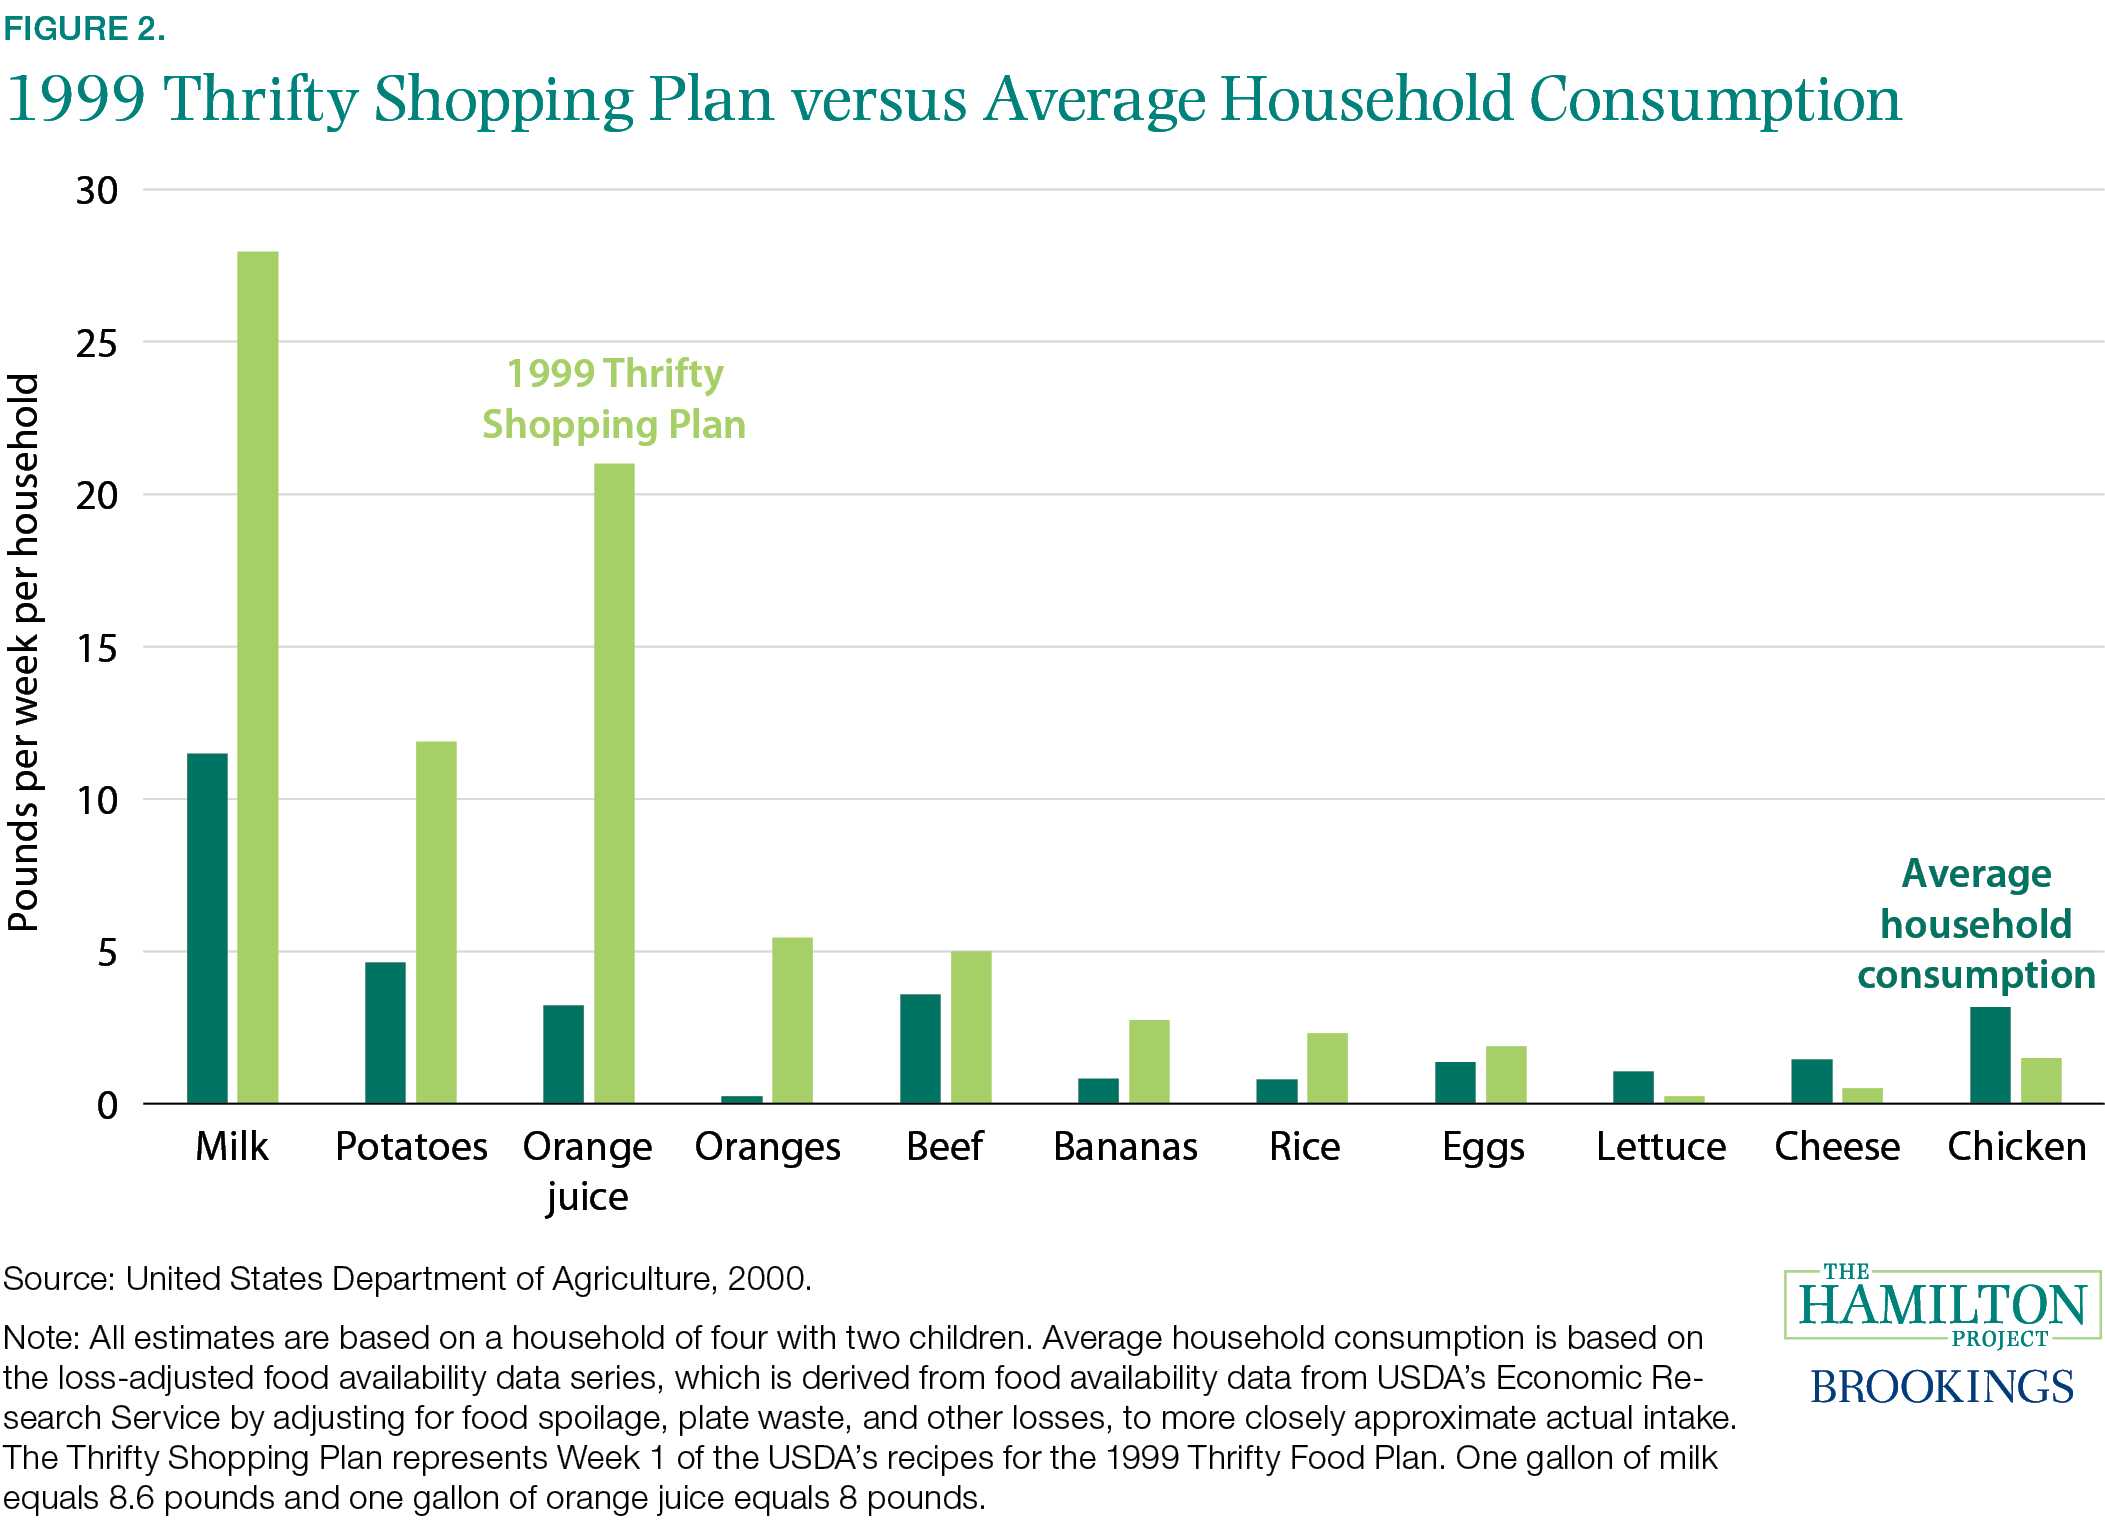
Because keeping the value of the SNAP maximum benefit cost-neutral was the starting point of prior updates even though those updates were supposed to maintain minimal nutrition standards (at least on paper), the underlying food market baskets have been deeply distorted for a long time relative to actual household food consumption patterns. Figure 2 (originally published in a Hamilton Project proposal by James Ziliak) shows how the 1999 Thrifty composition diverged from the actual consumption patterns of an average household at the time. For example, the 1999 Thrifty assumed that a family would purchase more than 28 pounds of milk and 20 pounds of concentrated orange juice, plus an additional five pounds of fresh oranges every week—far in excess of average household purchases. In addition, the Thrifty assumed unrealistic purchases of raw, unprepared ingredients, such as 12 pounds of potatoes per week (as shown in figure 4, the patterns were even more distorted under the 2006 Thrifty).
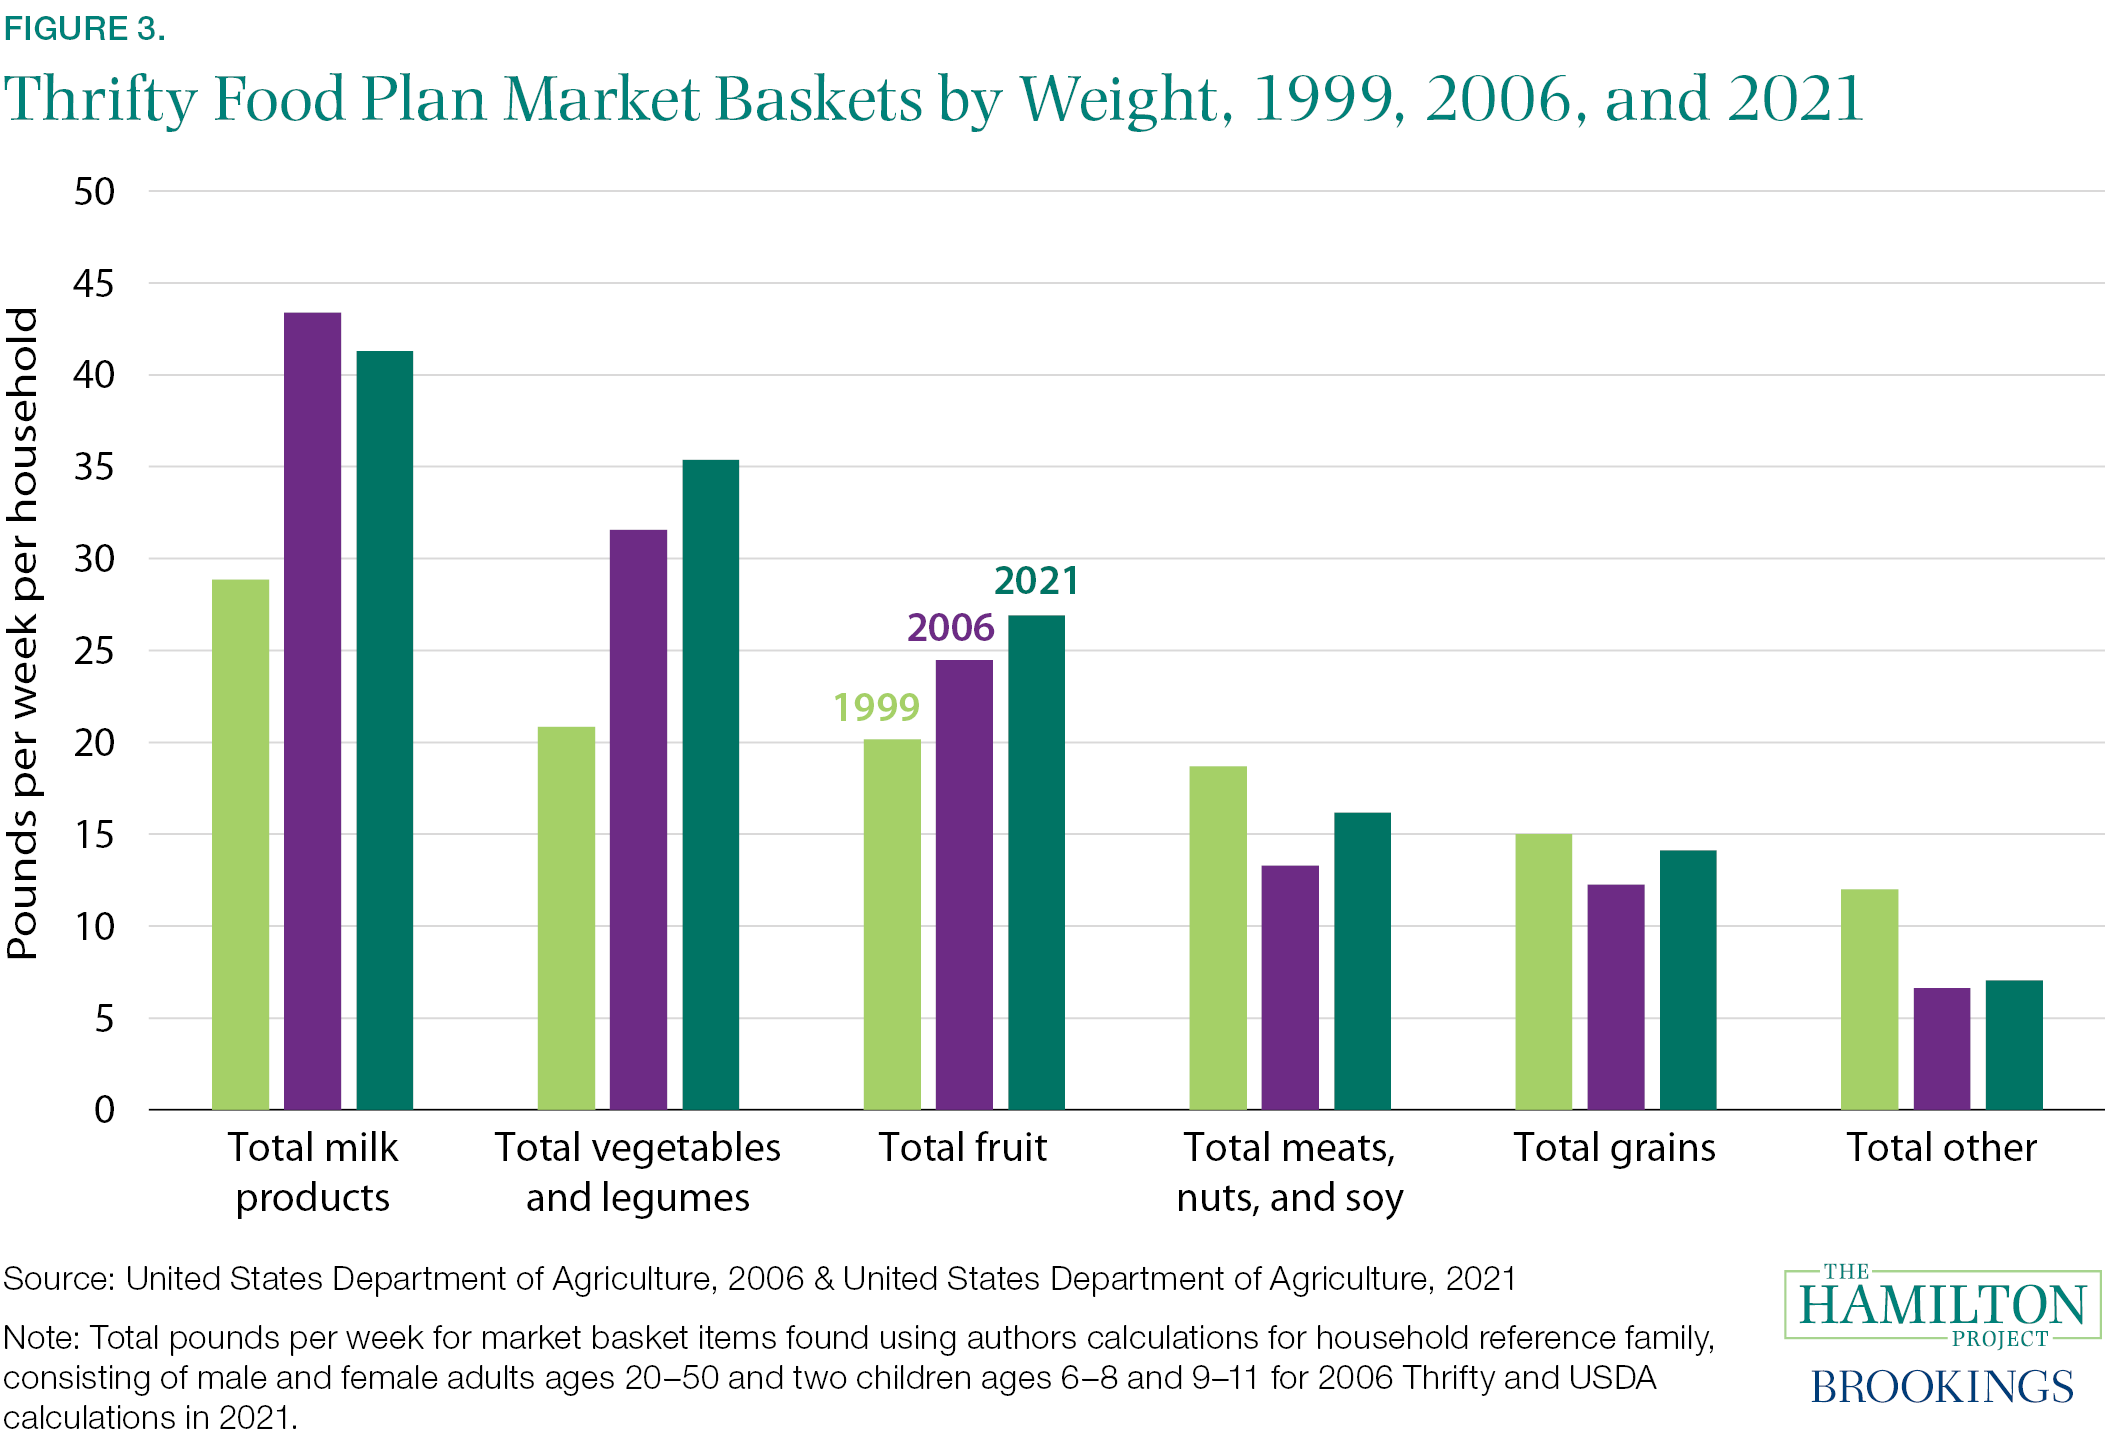
Following the 2018 Farm Bill, USDA worked to re-calculate the inputs into the Thrifty, including the current nutrition guidelines. Notable differences in the calculation include looking at the food costs that all consumers face and setting current consumption patterns based on how those who are above the median on the Healthy Eating Index eat. In combination with the relaxation of cost-neutrality, these updates have produced a Thrifty market basket that is substantially less distorted than past market baskets. Figure 3 shows the distribution of types of food for the 1999, 2006, and 2021 Thrifty calculations. In pounds, the 2021 Thrifty is larger than the 2006 for every category except dairy.
But total weight does not account for changes in the composition of the market basket within category or changes in the costs of the food items. Figure 4 shows detailed changes in the composition by weight of the Thrifty calculation. From left to right, the categories of items are arrayed by the size of the 2021 share; for example, starchy vegetables make up the largest share of the vegetables followed by red and orange vegetables. Unlike the 1999 Thrifty (figure 2 above) and the 2006 Thrifty, the composition of the 2021 Thrifty reflects nutrition inputs without the distortion of imposing cost-neutrality. Figure 4 shows that updated nutrition standards — regarding the amount and balance of whole grains, meats including seafood, and vegetables and legumes that are part of a healthy diet—all are reflected in the composition of the 2021 Thrifty market basket.
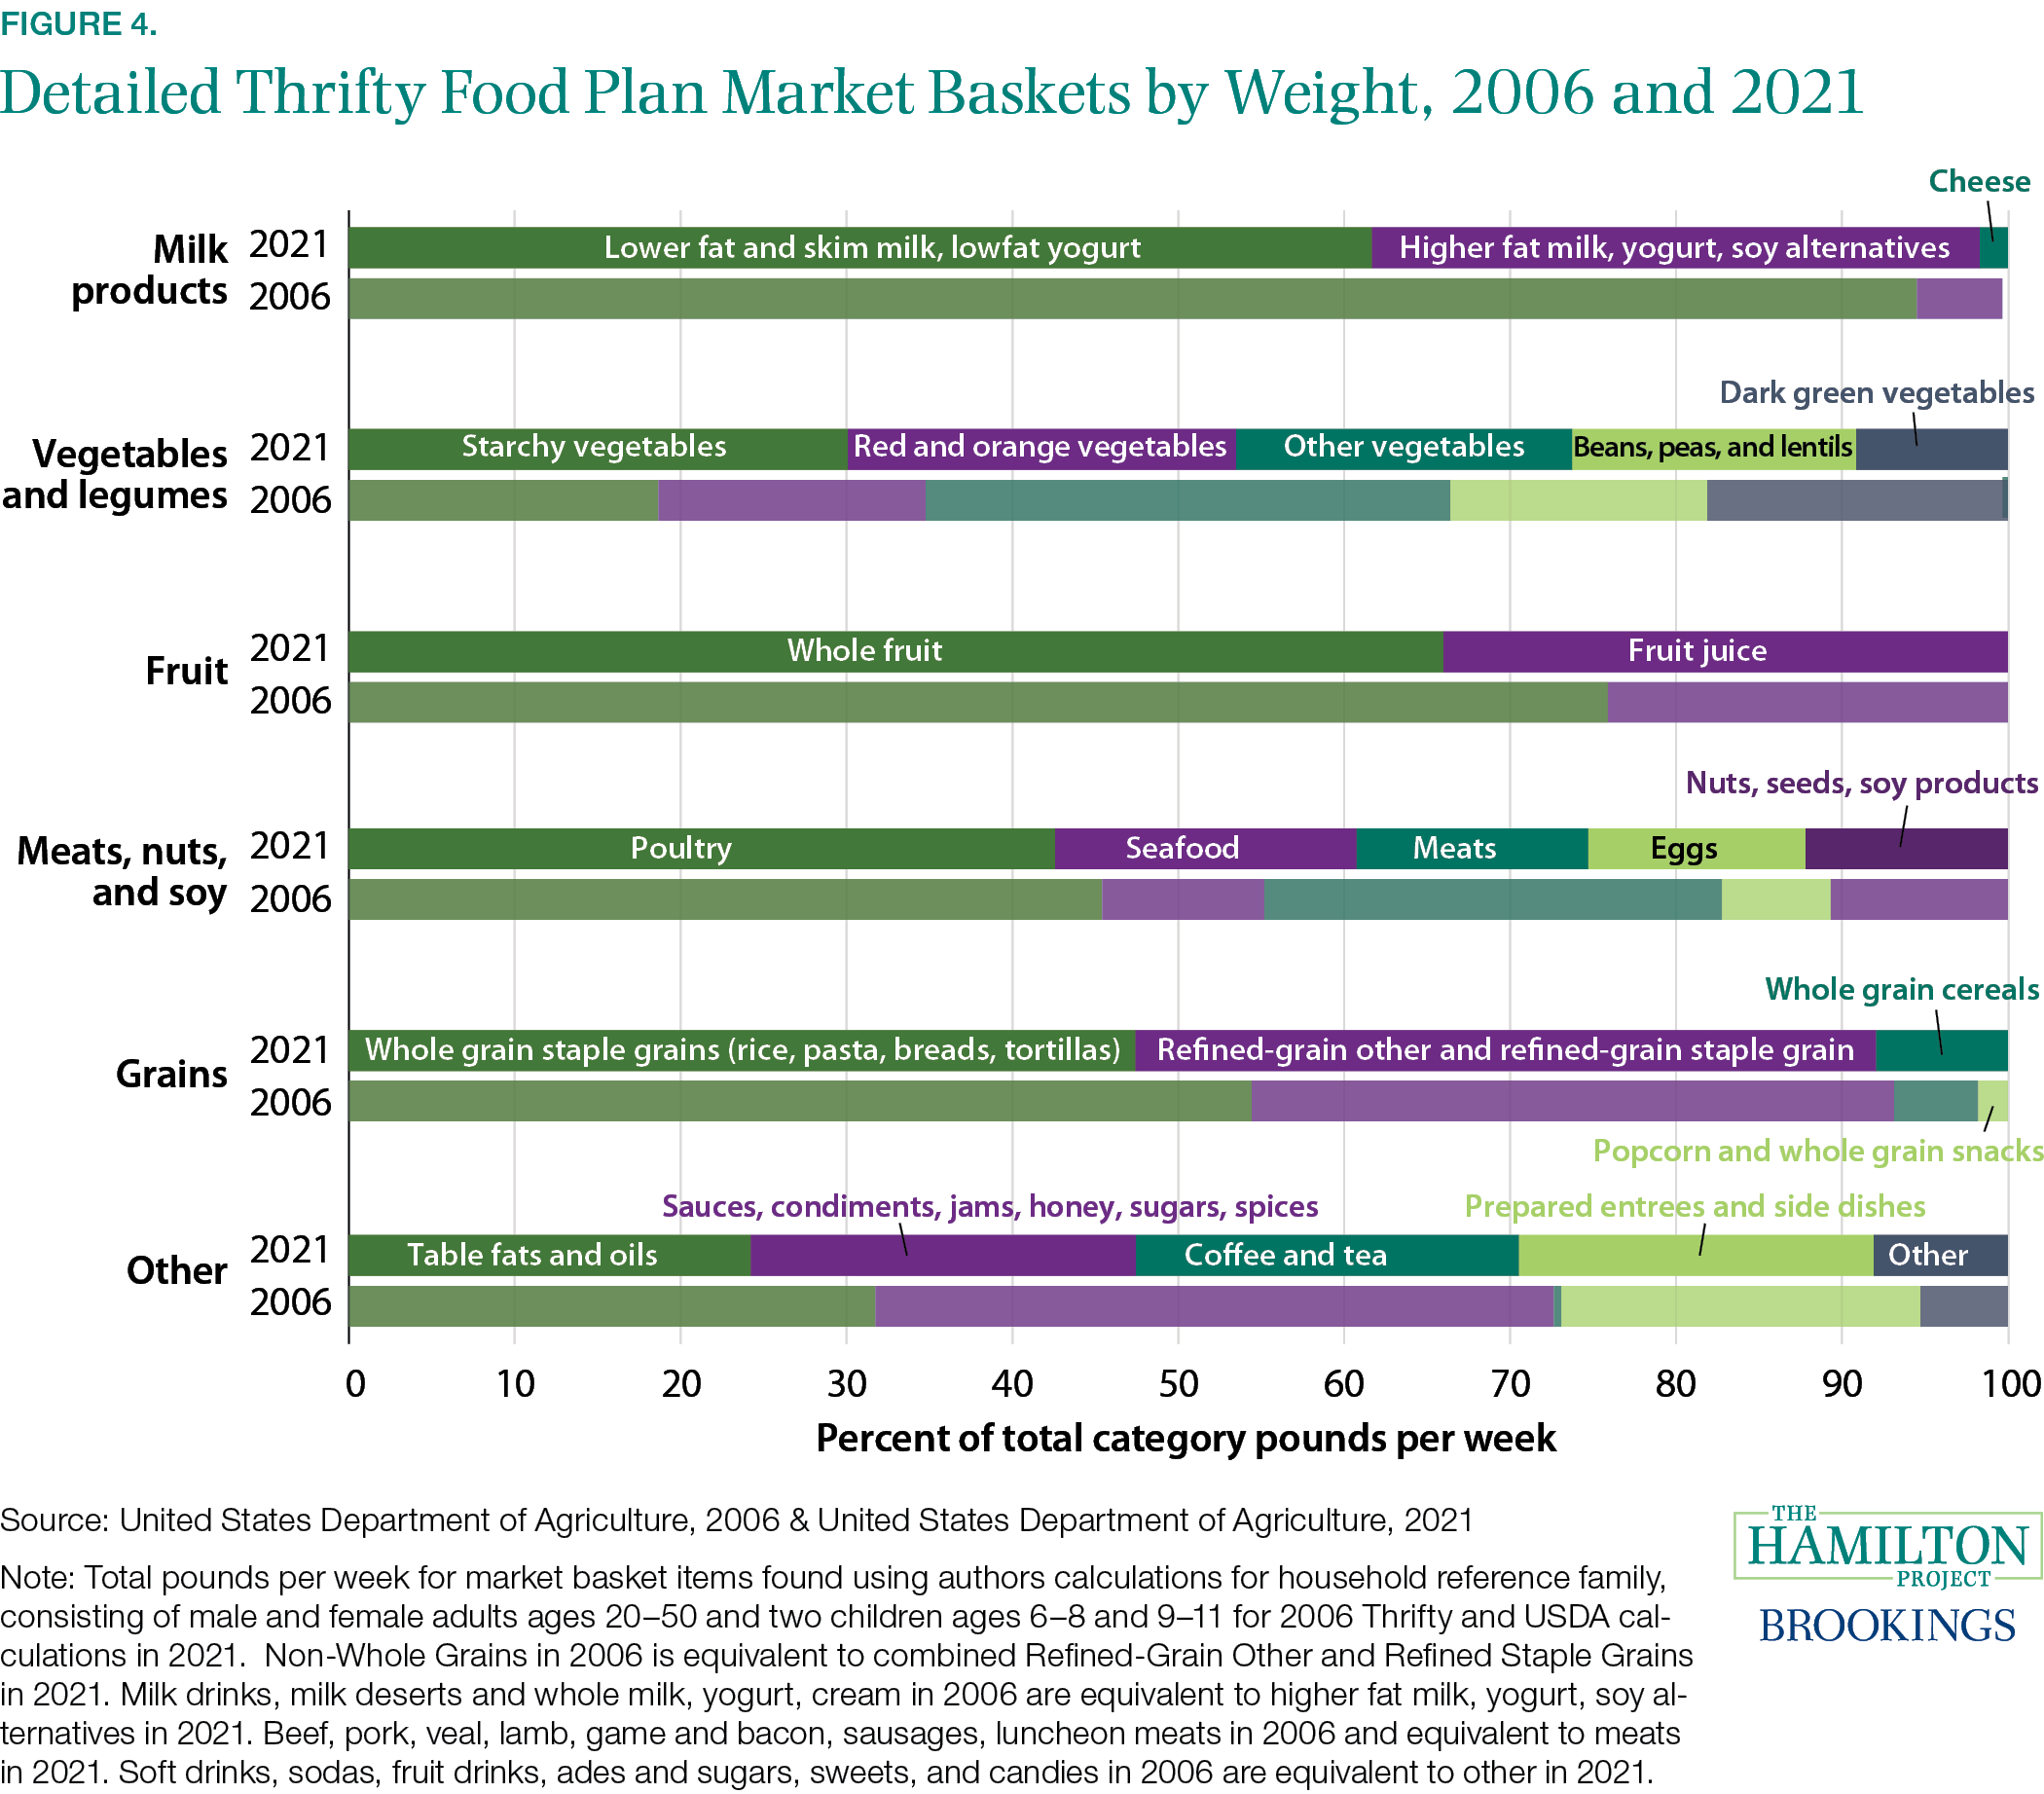
One particularly notable update is how the 2021 Thrifty handles dairy products and their alternatives. Prior Thrifty calculations relied heavily on dairy products as a source of nutrition. While it was unrealistic for any household to drink as much milk as was budgeted for, those who are lactose intolerant were likely to fall even farther short of the resources needed to meet their nutritional needs. The 2021 Thrifty improves in its accounting for non-dairy alternatives.
Conclusion
In the 2021 recalculation of the Thrifty, the actual cost of achieving a realistic nutritious diet has affected the value of the Thrifty for the first time. This analysis shows that modernizing and reconciling the four Congressionally-mandated inputs into the Thrifty—dietary guidance, food composition, consumption patterns, and food prices—and removing cost-neutrality have produced a more reasonable value that will better support food security, nutrition, health, and healthy development. The mathematical model was updated one penny at a time from the starting value of the June 2020 Thrifty until one could purchase an adequately nutritious diet for a given dollar value. The new Thrifty has been updated at the lowest cost possible (to the penny) that meets these criteria.
Through SNAP Emergency Allotments and the temporary 15 percent maximum benefit increase, SNAP purchasing power has been higher for all participating households since the onset of the COVID-19 pandemic. These changes have increased benefit adequacy and reduced food insecurity in recent months. As the maximum benefit increase expires, SNAP benefits based on the 2021 Thrifty will take effect and, in most states, SNAP Emergency Allotments will continue. Increasing the value of SNAP benefits is evidence-based, a long time coming, and will arrive just in time.
The Brookings Institution is financed through the support of a diverse array of foundations, corporations, governments, individuals, as well as an endowment. A list of donors can be found in our annual reports published online here. The findings, interpretations, and conclusions in this report are solely those of its author(s) and are not influenced by any donation.
Author

-
Acknowledgements and disclosures
The author thanks Kristin Butcher, Wendy Edelberg, Bob Greenstein, Brynne Keith-Jennings, Joseph Llobera, and Diane Schanzenbach for insightful feedback, Hilary Hoynes for sharing the data on SNAP purchasing power, and David Super and the Center on Budget and Policy Priorities Food Assistance team for edifying conversations. Ronnie Clevenstine provided superior research support in all aspects of this piece and Sara Estep, Moriah Macklin, and Elisabeth Raczek provided excellent research assistance.
The Brookings Institution is committed to quality, independence, and impact.
We are supported by a diverse array of funders. In line with our values and policies, each Brookings publication represents the sole views of its author(s).


Commentary
A healthy reform to the Supplemental Nutrition Assistance Program: Updating the Thrifty Food Plan
August 19, 2021