


One in seven households was food insecure in 2014 – meaning that at some time during the year the household had difficulty providing enough food for all their members due to a lack of resources. To explore the persistent and troubling problem of hunger in America, The Hamilton Project offers the following twelve facts on food insecurity, SNAP, and other nutrition support programs.
Introduction
The problem of hunger in America is troubling. One in seven households was food insecure in 2014—meaning that at some time during the year they had difficulty providing enough food for all of their members due to a lack of resources. 15 million children live in food-insecure households. Even more troubling, in 2014 just over 1 in 20 households—almost 7 million households—suffered one or more periods during which food intake of household members was reduced and normal eating patterns were disrupted because the household lacked money and other resources for food.
Read the full introduction »
To be sure, the phenomenon of food insecurity in the United States is not equivalent to the severe malnutrition observed in some developing countries. Nonetheless, it has far-reaching impacts on the health and well-being of an unacceptably large number of Americans adults and children. The common-sense notion that lack of access to food is harmful has been established by rigorous research. Children living in food-insecure households tend to have a lower health-related quality of life (Casey et al. 2005), higher rates of asthma (Mangini et al. 2015), less-nutritious diets (Fram et al. 2015), and behavioral problems that affect school performance (Whitaker, Phillips, and Orzol 2006).
Definitions
Food insecurity: Food-insecure households had difficulty at some time during the year providing enough food for all their members due to a lack of resources. In 2014, 14.0 percent of households were food insecure.
Very low food security: In addition to having the characteristics of food security, households that have very low food security also report that, at times during the year, the food intake of household members was reduced and their normal eating patterns were disrupted because the household lacked money and other resources for food. The surgeon general has set a goal to eliminate very low food security among children by 2020 (HealhtyPeople.gov 2016). In 2014, 5.6 percent of households experienced very low food security.
Food insecurity is measured using the U.S. Department of Agriculture (USDA 2015) 18-question U.S. Household Food Security Survey Module, implemented annually in the December Supplement (CPS-FSS) to the U.S. Census Bureau’s Current Population Survey (CPS). This survey tool asks a series of questions about households’ resources available for food and whether adults or children in the household adjusted their food intake—cutting meal size, skipping meals, or going for a day without food—because of lack of money for food. A household is considered to be “food insecure” if, due to a lack of resources, it had difficulty at some time during the year providing enough food for all of its members. The more-severe categorization of “very low food security” status describes those food-insecure households in which members’ food intake was reduced and their normal eating patterns disrupted at some point during the year because of a lack of resources for food. Food insecurity and very low food security are measured at the household level, though questions about adults and children are asked separately. In other words, a child may live in a food-insecure household, but be buffered from the direct effects of food insecurity by the adults in the household. The food insecurity measures are collected annually in December as a supplement to the U.S.Census Bureau’s Current Population Survey (CPS); the results are the Current Population Survey Food Security Supplement (CPS-FSS) data files.
Note that food insecurity is distinct from poverty. While the poverty rate measures the share of families with annual gross income below a particular threshold, the food insecurity rate reflects the resources available to purchase food. In thirty states and the District of Columbia the rate of food insecurity is higher than the rate of poverty. While the rate of food insecurity declines as household income increases, its reach extends farther up the income distribution than many would guess: two-thirds of food-insecure households have annual incomes above the federal poverty level (FPL). And because many households may be food secure one year but not the next, an even larger share of households has had some experience with food insecurity than any single-year snapshot suggests.
There is an important role for the safety net in insuring households against food insecurity. The largest of the federal nutrition assistance programs, the Supplemental Nutrition Assistance Program (SNAP; formerly called the Food Stamp Program), is highly effective, lifting millions of people out of poverty and increasing the resources they have available to purchase food.
In addition, because it is designed to expand and contract according to need, SNAP serves as an important macroeconomic stabilizer. Furthermore, several studies have found that SNAP reduces the likelihood that a household will experience food insecurity or very low food security (Ratcliffe, McKernan, and Zhang 2011; Schmidt, Shore-Sheppard, and Watson 2012; Shaefer and Gutierrez 2013). Moreover, evidence from safety net expansions—such as the temporary benefit increase under the American Recovery and Reinvestment Act of 2009 (ARRA) and a pilot program that provided additional benefits to families of children during the summer months when school meals were not available—shows reductions in rates of food insecurity and very low food security. Recent studies have shown that SNAP improves health outcomes and households’ financial well-being, and even improves the later-life outcomes of individuals who had access to the program as children.
A guiding principle of The Hamilton Project is that long-term prosperity is best achieved by fostering economic growth and broad participation in that growth. This necessitates increasing economic security—which in turn can increase economic growth by enabling people to invest in their education or that of their children, and by helping families get back on their feet quickly after unexpected shocks. In this spirit, The Hamilton Project offers the following 12 facts on food insecurity, SNAP, and other nutrition support programs.
Chapter 1: The Problem of Food Insecurity in the United States Today
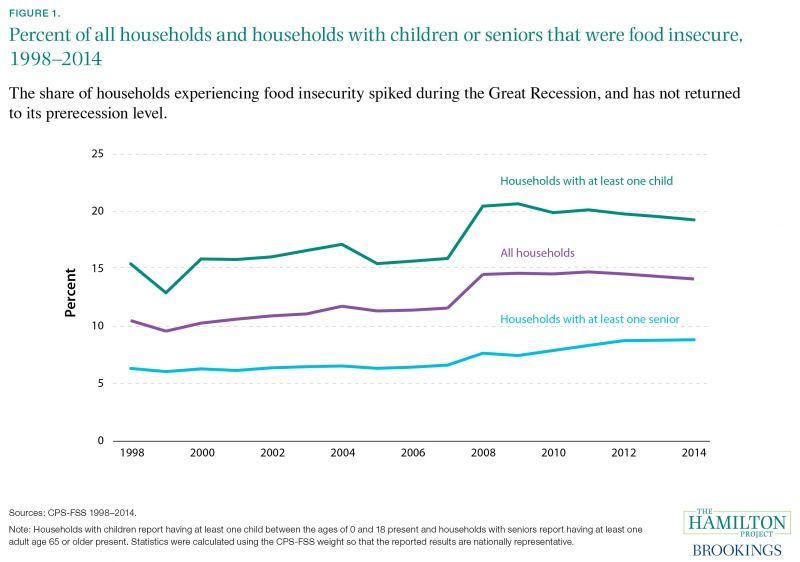
Fact 1: In 2014 almost one in five households with children were food-insecure.
In 2014 more than 15.3 million children—or more than one in five—lived in a food-insecure household (Coleman-Jensen et al. 2015) in the United States. This is a marked increase from the years prior to the Great Recession, when an average of 12.9 million children lived in a food-insecure household.
The USDA defines a household as food insecure if it reports that it had difficulty at some time during the year providing enough food for all of its members due to a lack of resources. This broad measure of food insecurity includes households that report a reduction in the quality, variety, and desirability of diet but little or no reduction in food intake, as well as households that experience very low food security—that is, who report disruptions in eating patterns and reductions in food intake (Coleman-Jensen et al. 2015). This latter measure, which accounted for 5.6 percent of households in 2014, is sometimes used as the preferred metric for hunger experienced in the United States (Chilton and Doar 2015; Cook and Jeng 2009).
Almost one in seven households—and almost one in five households with children—reported difficulty providing enough food in 2014 for all of their members (Coleman-Jensen et al. 2015). Households with children have a higher rate of food insecurity than households overall and households with seniors; this elevated rate persists despite those households’eligibility for additional nutrition support through the subsidized school meals programs and Special Supplemental Nutrition Program for Women, Infants, and Children (WIC).
After the onset of the Great Recession all household types saw sharp increases in rates of food insecurity, with households with children experiencing the largest increase. From 1998 to 2007 an average of 15.7 percent of households with children, 10.8 percent of households overall, and 6 percent of households with seniors were food insecure. The average from 2008 to 2014 was roughly 4 percentage points higher for households overall and for households with children, and about 2 percentage points higher for households with seniors. These changes amount to millions more Americans living in food-insecure households. Despite recent improvements in the economy, food insecurity rates are still higher than they were prior to the Great Recession, potentially reflecting higher rates of poverty and increased costs of other necessities such as housing.
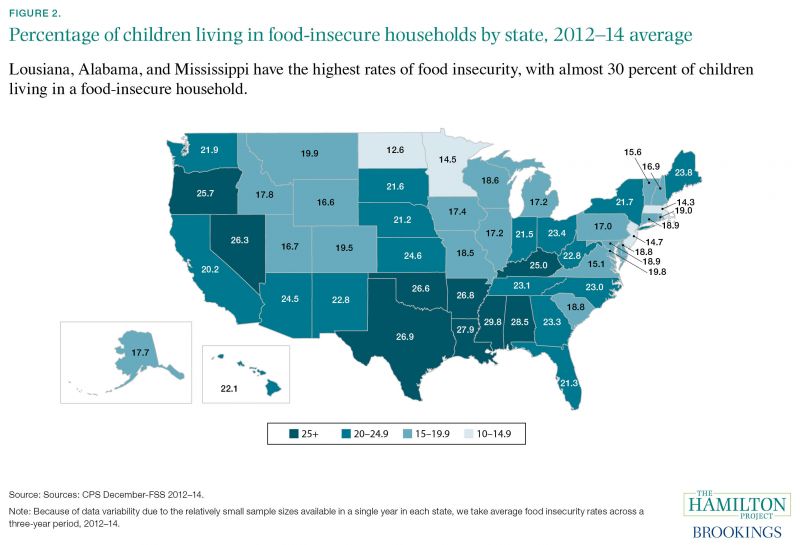
Fact 2: In nine states, one in four children lives in a food-insecure household.
In every state a higher share of children than the equivalent share of adults lived in a food-insecure household (Coleman-Jensen et al. 2015). However, the 15 million children and 29 million adults who lived in food-insecure households in 2014 were unevenly distributed across states. Figure 2 shows the average annual percentage of children living in food-insecure households over the period 2012–14. In half of states plus the District of Columbia, at least 20 percent of children lived in a food-insecure household, and in nine states the share of children who lived in a food-insecure household was at least 25 percent.
Since the Great Recession began in 2007, 41 states have seen the percent of children living in food-insecure households increase; in 28 states, the increase was greater than 4 percentage points (CPS 2005–14). The states with the highest rates of food insecurity are Louisiana, Alabama, and Mississippi, where almost 30 percent of all the children in these states live in a food-insecure household. In only two states—Iowa and Wyoming, as well as the District of Columbia—has the percent of children living in food-insecure households decreased by more than 4 percentage points since 2008.
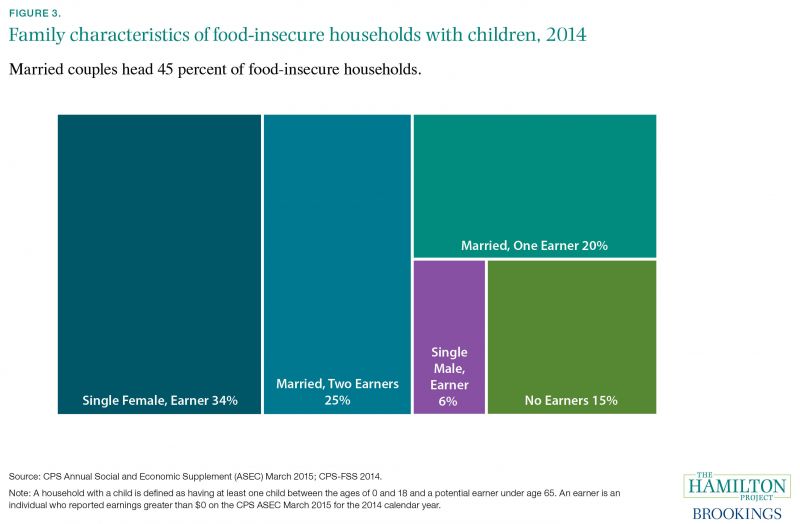
Fact 3: About 85 percent of food-insecure households with children are headed by adults who work.
The vast majority of food-insecure households with children are working households: over 85 percent of households with children reporting food insecurity in 2014 also reported at least one adult who earned an income in 2014. Food-insecure households with children were slightly more likely to be headed by married couples (46.9 percent) than single mothers (44.6 percent). Among every type of household reporting food insecurity—i.e., households headed by married couples, single mothers, or single fathers—at least 75 percent of households had an earner during the year they experienced food insecurity. Nonetheless, the income generated by work over the year was not sufficient to protect those working families from food insecurity.
Employment provides many benefits to households and children, yet working necessarily reduces the amount of time that an earner has available to do other tasks, including shopping for and preparing food. This time constraint may increase the monetary cost of food and, in turn, increase the likelihood that a family experiences food insecurity. A number of studies find that working mothers report using food preparation strategies that take less time and cost more, such as relying more on convenient meals, spending less time preparing food, and preparing fewer family dinners (Bauer et al. 2012; Cawley and Liu 2012).
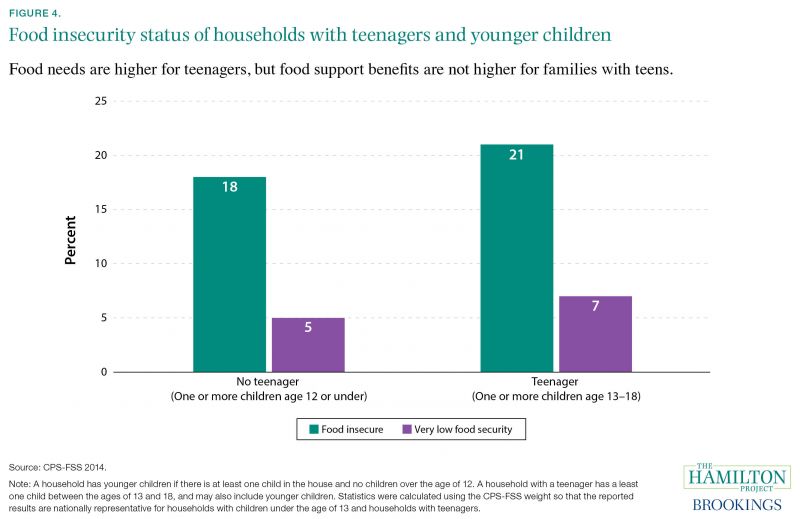
Fact 4: Households with a teenager are more likely to experience very low food security.
As any parent of teenagers knows, food consumption increases during the teenage years (Docter and Breuner 2012; Stang and Story 2005). This is reflected in U.S. dietary guidelines, which estimate the calorie needs of teens to be on par with that of their parents, and more than three times the needs of younger children (U.S. Department of Health and Human Services [DHHS] 2015). It is also apparent in measures of food intake and food spending, both of which increase when children enter their teenage years (Anderson and Butcher 2016).
Households with teenage children experience higher rates of food insecurity than do households with only younger children. Among households with teenagers, over 20 percent were food insecure—2 percentage points higher than the rate among households with younger children. The rates were similar whether the teenage child was male or female. Rates of very low food security also increase markedly when a teenager is present—by about 1.5 percentage points, or 25 percent. After holding other factors constant, Anderson et al. (forthcoming) found that adding an additional teenager to a household increases by about 50 percent the probability that children in a family experience very low food security.
SNAP benefits do not vary by child age, and feeding a family of four with two teenage boys according to the USDA’s Thrifty Food Plan would cost $50 per month more than the maximum SNAP benefit available to the family (USDA 2016a). Recent evidence shows that modest funding increases in food support programs can greatly reduce food insecurity, especially among households with teenagers (see Fact 11). School meals programs specify higher calorie recommendations for meals served to middle and high school students (USDA 2012), but high school students are less likely than younger children to participate in school meals.
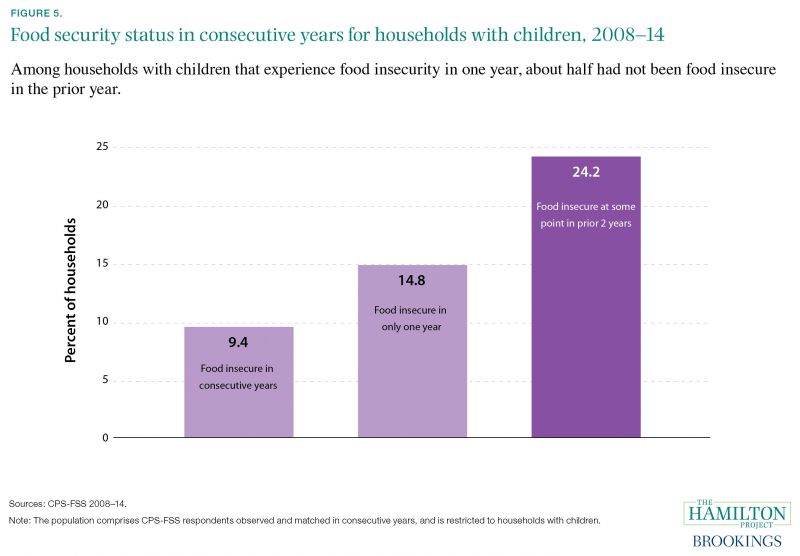
Fact 5: Annual snapshots mask the extent of the food insecurity problem.
Annual rates of food insecurity mask the extent of the food insecurity problem. Using the Current Population Survey, we can follow large numbers of households across two consecutive years, allowing us to compare food security status over time. In consecutive years during the post-recession period 2008–14, over 24 percent of households with children experienced food insecurity in one or both years: 9 percent of household experienced food insecurity in consecutive years, and an additional 15 percent of households experienced food insecurity in only one of the two years.
Suring the temporary periods when those families experience food insecurity, there still may be negative impacts on their children. For example, one study found a decline in cognitive development and health status among toddlers who lived in households that were food secure when the child was nine months old but had become food insecure by the child’s second birthday (Hernandez and Jacknowitz 2009).
For many households, food insecurity appears to be a temporary challenge. Around 40 percent more households reported being food insecure in the past two years than reported being food insecure last year. To the extent that food insecurity is a temporary or sudden experience, policies to address it must also be quick to respond.
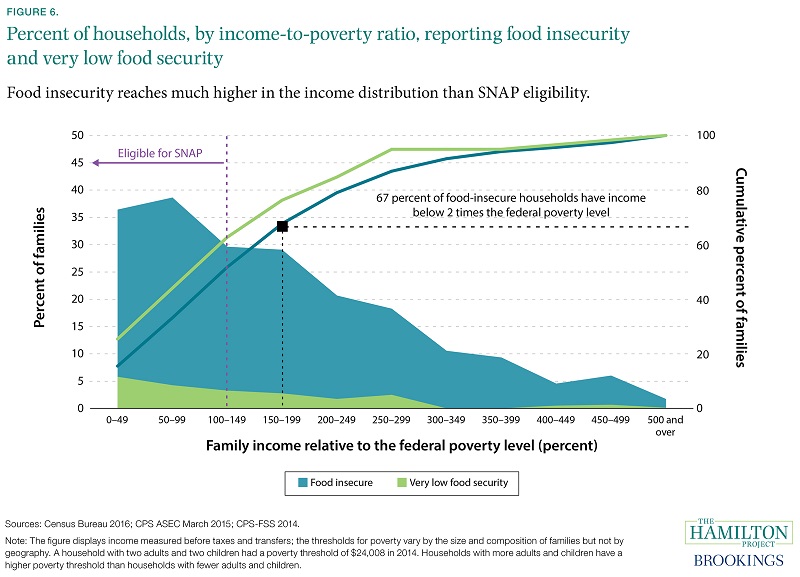
Fact 6: One third of food-insecure households have annual incomes of at least two times the federal poverty level.
Food insecurity, often thought to be a characteristic of poverty, is actually dispersed widely over the income distribution, though food insecurity does decline as a household’s income increases. Notably, a large share of food-insecure households live above the federal poverty level (FPL) with incomes that are above the reach of SNAP and other food support programs. One-third of food-insecure households have reported incomes between 100 and 200 percent of the FPL and another third have reported incomes above 200 percent of the FPL—a level at which households are typically not eligible for SNAP or subsidized school meals. Many of these families have incomes above the reach of the EITC as well, which phases out near 185 percent of the FPL (Urban-Brookings Tax Policy Center 2016).
Among families with annual incomes below the FPL, more than 35 percent experience food insecurity—much higher than those with incomes reported between two and three times the FPL (20 percent), and those with incomes more than three times the FPL (less than 10 percent).
Very low food security is even more concentrated than food insecurity among the poor. The highest rate of very low food security is reported among the poorest households, or those living below half of the FPL (about $12,000 for a family of four).
Chapter 2: The Important Role of the Safety Net
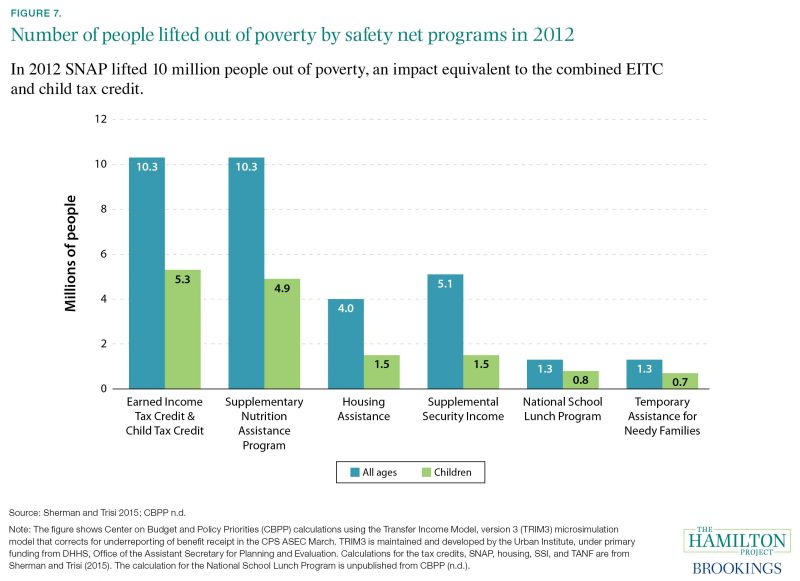
Fact 7: The social safety net lifts tens of millions of people out of poverty.
In 2012 safety net programs lifted almost 50 million people—including over 10 million children—out of poverty, as defined by the Supplemental Poverty Measure (Sherman and Trisi 2015). The largest reductions in poverty among children can be attributed to SNAP, the Earned Income Tax Credit (EITC), and the child tax credit. After adjusting for the underreporting among social program beneficiaries in the Current Population Survey, it is estimated that SNAP lifts more than 10 million people out of poverty, including around 5 million children. Other programs such as housing assistance, Temporary Assistance for Needy Families (TANF), the National School Lunch Program (NSLP), and Supplemental Security Income (SSI) lift a smaller but still substantial number of children out of poverty.
Recent research has documented strong, long-term impacts from investing in certain antipoverty programs aimed at children. Programs such as the EITC that supplement the earnings of low-income working families have been shown to increase children’s test scores (Dahl and Lochner 2012), thereby raising their expected earnings when they reach adulthood (Chetty, Friedman, and Rockoff 2014). These studies suggest that the benefits of poverty alleviation will accrue over the long run.
Fact 8: SNAP investments have long-term payoffs.
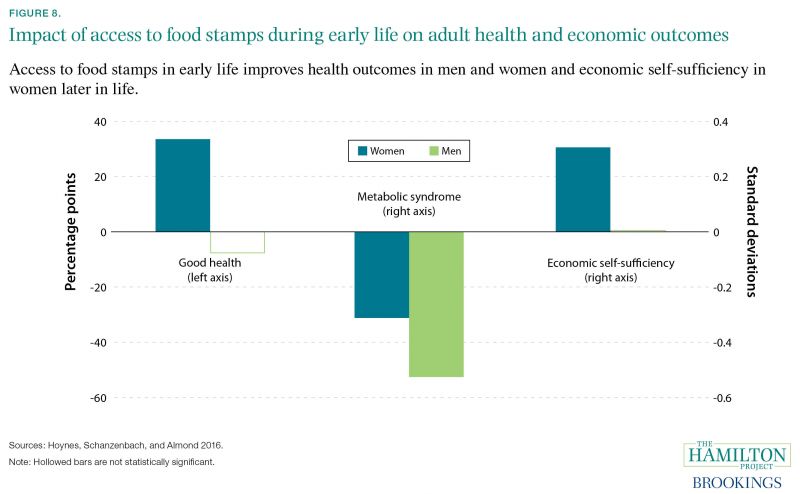
A new study by Hoynes, Schanzenbach, and Almond (2016) finds long-term positive effects from consistently providing access to the Food Stamp Program (now called SNAP) during early life. Taking advantage of the relatively long rollout period when the program was originally introduced, the study compares children who lived in different counties within a state and who were born at different times to measure the long-term impacts of access to the program. Access to the Food Stamp Program at early ages—starting before birth in cases where the mother received food stamps during pregnancy, and continuing through age five—leads to a number of positive long-run health and economic outcomes.
As shown in figure 8, access to the Food Stamp Program over this age range has substantial positive impacts on later health, lowering women’s and men’s incidence of metabolic syndrome—a health measure that includes diabetes, high blood pressure, obesity, heart disease, and heart attack—by 0.3 and 0.5 standard deviations, respectively. Women are also 34 percentage points more likely to report excellent or very good health if they had access to food stamps from before birth through age five.
These gains also extend to economic outcomes. Women with access to the Food Stamp Program over the full early life period have much higher economic self-sufficiency—a measure that includes completed education, employment status, earnings, and financial success—than those who did not. Furthermore, access to food stamps increased high school graduation rates by more than 18 percentage points.
Access to food stamps and the NSLP also seems to improve educational outcomes among older children (ages 6 to 18) as well, which may indicate that better nutrition helps students gain more from school, setting them on a path toward greater self-sufficiency (Hinrichs 2010; Hoynes, Schanzenbach, and Almond 2016).
Fact 9: Nutrition programs vary in their reach to low-income households.
The four largest nutrition programs in the United States are the Supplemental Nutrition Assistance Program (SNAP), the Special Supplemental Nutrition Program for Women, Infants, and Children (WIC), the National School Lunch Program (School Lunch), and the School Breakfast Program (School Breakfast). Combined spending on these four programs was $97 billion in 2015, with SNAP accounting for $74 billion (USDA 2016b). Eligibility for each program is means-tested and targeted to specific populations, such as children enrolled in a school that participates in the SBP and the NSLP.
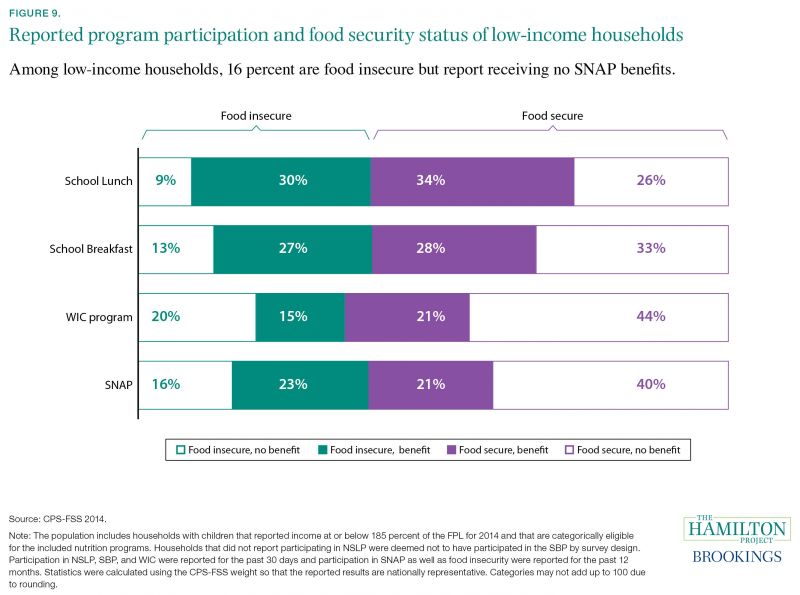
Figure 9 describes the overlap of nutrition program participation and food security status for households with children and annual incomes at or below 185 percent of the FPL. Each row is limited to households that meet the categorical eligibility criteria for the program; that is, it is limited to households with a school-aged child eligible for School Breakfast or School Lunch, or to households with a child under age five eligible for WIC. Households are grouped into four populations: food insecure and reporting no program benefits, food insecure but reporting program benefits, food secure and reporting program benefits, and food secure and reporting no program benefits.
The NSLP has the largest reach among these programs, and is available in nearly all public schools. As the figure illustrates, 64 percent of low-income households report participating in the free or reduced-price school lunch program. Of participants, almost half are food insecure despite participating in the program. Nine percent of low-income families with children are food insecure but report receiving no subsidized school lunch. Participation is similar but slightly more muted for the school breakfast program.
WIC has the lowest participation rate among the top four nutrition programs, and the highest percentage of eligible households reporting both food insecurity and no program participation. This could be due in part to how WIC participation is reported in the CPS, where respondents are asked whether they received WIC in the past month; by contrast, SNAP participation is reported for the past 12 months. Among households with annual incomes at or below 185 percent of the FPL, 44 percent report participating in SNAP. This estimated participation rate may be understated for at least two reasons. First, SNAP eligibility is typically limited to households with monthly incomes at or below 130 percent of the FPL, so a portion of the low-income sample may be ineligible for SNAP. Second, participation in safety net programs appears to be systematically underreported in the CPS (Meyer, Goerge, and Mittag 2014). With these caveats in mind, one-sixth (16 percent) of low-income households were food insecure but reported that they did not receive SNAP.
The fact that many children who receive benefits remain food insecure does not imply that the programs are ineffective. Families most in need of food assistance are most likely to enroll in nutrition programs, but for some the additional resources are still inadequate to end their food insecurity. For example, school meals are available only when school is in session, and food insecurity rates rise for children during the summer when the benefits are not provided (see Fact 11).
More troubling is the share of households that are food insecure and eligible for nutrition programs but do not participate. More work is needed to understand why this nonparticipation occurs, and whether policies can improve take-up among the population most at risk of food insecurity.
Fact 10: Increases in SNAP benefits coincided with decreases in very low food security among recipients.
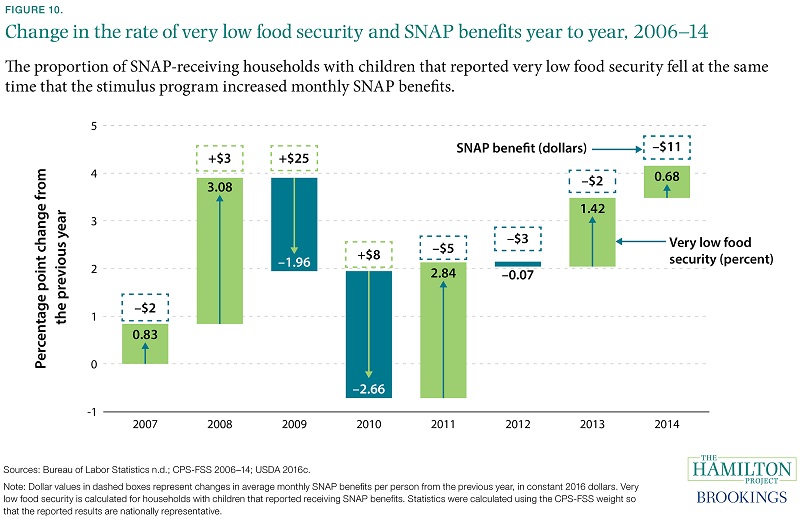
Figure 10 shows changes in the rates of very low food security and in the average per person monthly SNAP benefits from year to year. In the immediate wake of the Great Recession, the rate of very low food security increased for households receiving SNAP. Among SNAP households with children, very low food security increased by nearly 1 percentage point in 2007 and 3 points in 2008 over the prior year’s level, while monthly benefits levels went down by $2 and then up by $3.
However, in response to the Great Recession, ARRA temporarily increased maximum SNAP benefit levels by 13.6 percent. Per person average monthly benefit levels increased $25 from 2007 to 2008 and an additional $8 from 2008 to 2009 (in inflation-adjusted 2016 dollars). The ARRA benefit increase coincided with the only substantial decreases in very low food insecurity among households with children in the past eight years. When benefit levels were at their highest and the recession was at its peak, the incidence of very low food security among SNAP-receiving households with children fell to prerecession levels.
After the decline in rates of very low food security in 2009 and 2010 that coincided with a SNAP benefit increase, rates of very low food security increased again when benefit levels decreased in 2011 by $5 per month over the previous year. By 2014 rates of very low food security were 4 percentage points higher than they were in 2006. There were more households with children participating in SNAP who had very low food security in 2014 than there were at the end of the recession in 2009.
Fact 11: Summer nutrition benefits can substantially reduce very low food security.
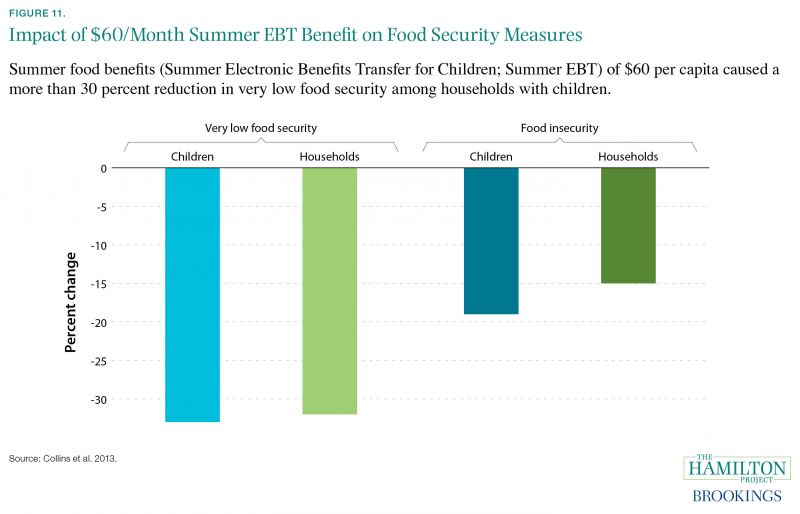
Although the school meals programs serve as the front line of defense against food insecurity for children, food insecurity rises when students lose access to those programs during the summer months (Nord and Romig 2006). To address this problem, the USDA created an experimental pilot program called the Summer Electronic Benefits Transfer for Children (Summer EBT) to provide additional benefits during the summer months that can be used at food stores (Collins et al. 2013). In 2012 USDA implemented a demonstration project as a randomized trial to test the impact of a $60 per summer month benefit—or about the combined monthly cost of a student participating in the SBP and the NSLP.
The results of the pilot program show that additional benefits caused a dramatic reduction in the share of households and children that experienced food insecurity or very low food security. In particular, the share of households reporting very low food security over the summer declined by one third. Furthermore, the share of children who directly experienced very low food security also declined by a third. The broader measure of food insecurity was also substantially reduced in children by around 20 percent. The $60 per month Summer EBT benefit also helped parents to provide their children with healthier food options. Compared to the control group that did not receive benefits, Summer EBT recipients consumed a healthier diet, including 13 percent more fruits and vegetables, 30 percent more whole grains, and 10 percent more dairy products.
In a subsequent demonstration project the following summer, USDA found that a smaller benefit of $30 per month had nearly equal impacts on reducing hunger, but was less effective at reducing the broader measure of food insecurity (Collins et al. 2014).
Fact 12: Beyond food security, SNAP improves households’ financial well-being.
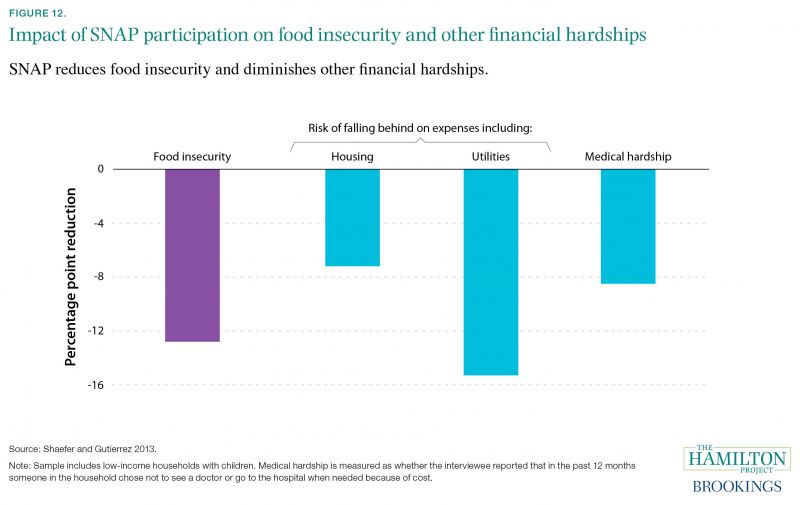
In addition to reducing food insecurity, SNAP participation may also reduce households’ risk of suffering financial hardships. Shaefer and Gutierrez (2013) use variation in state-level policies that affect SNAP access to study the impact of SNAP participation on a variety of outcomes. They find that receiving SNAP reduces the likelihood of food insecurity by 13 percentage points.
SNAP also has spillover impacts on other aspects of families’ financial well-being. Households have more resources available for other essential expenses, such as housing, utilities, and medical bills. Shaefer and Gutierrez (2013) estimate that SNAP participation reduces the risk of falling behind on rent or mortgage payments by 7 percentage points and on utility bills (gas, oil, and electricity) by 15 percentage points. Participants are also less likely to experience medical hardship: SNAP participation decreases the likelihood of forgoing a necessary visit to a doctor or hospital by 9 percentage points.
Related Content


Related Books


The Brookings Institution is committed to quality, independence, and impact.
We are supported by a diverse array of funders. In line with our values and policies, each Brookings publication represents the sole views of its author(s).