Even amid a coronavirus outbreak that is prompting fear of a worldwide economic downturn, it’s worth reflecting that the United States has achieved a record-long economic expansion over the past decade-plus. The nation’s GDP has grown in every quarter since the middle of 2009, and the labor market has added jobs in every month since September 2010.
However, GDP and job growth on their own are not sufficient markers of economic health. As our annual Metro Monitor illustrates, economic success involves a combination of growth, prosperity (increasing average value of an economy), and inclusion (improved well-being for everyone)—trends that differ dramatically in their trajectory and magnitude across the nation’s major metropolitan areas. This year’s Monitor tracks the performance of America’s metro area economies in these three respects, from the dawn of the Great Recession in 2008 through 2018 (the latest year of available data).
Metro Monitor has expanded to include more metro areas and a new dimension of inclusion
Since its inception, Metro Monitor—along with many other Brookings Metro research publications—has tracked the conditions of the nation’s 100 largest metropolitan areas, and ranked their performance accordingly. For some time, these 100 metro areas corresponded to places with populations of at least 500,000, and together housed about two-thirds of Americans and generated three-quarters of the nation’s GDP.
Today’s economic and political climate, however, encourages greater focus on the well-being of midsized metro areas. Many of these smaller regions—86 nationwide, with populations between 250,000 and 500,000—are experiencing very different economic dynamics than larger regions. They are also geographically widespread, covering 37 states, including regions such as the far Upper Midwest and stretches of the Southeast that do not possess large metro areas.
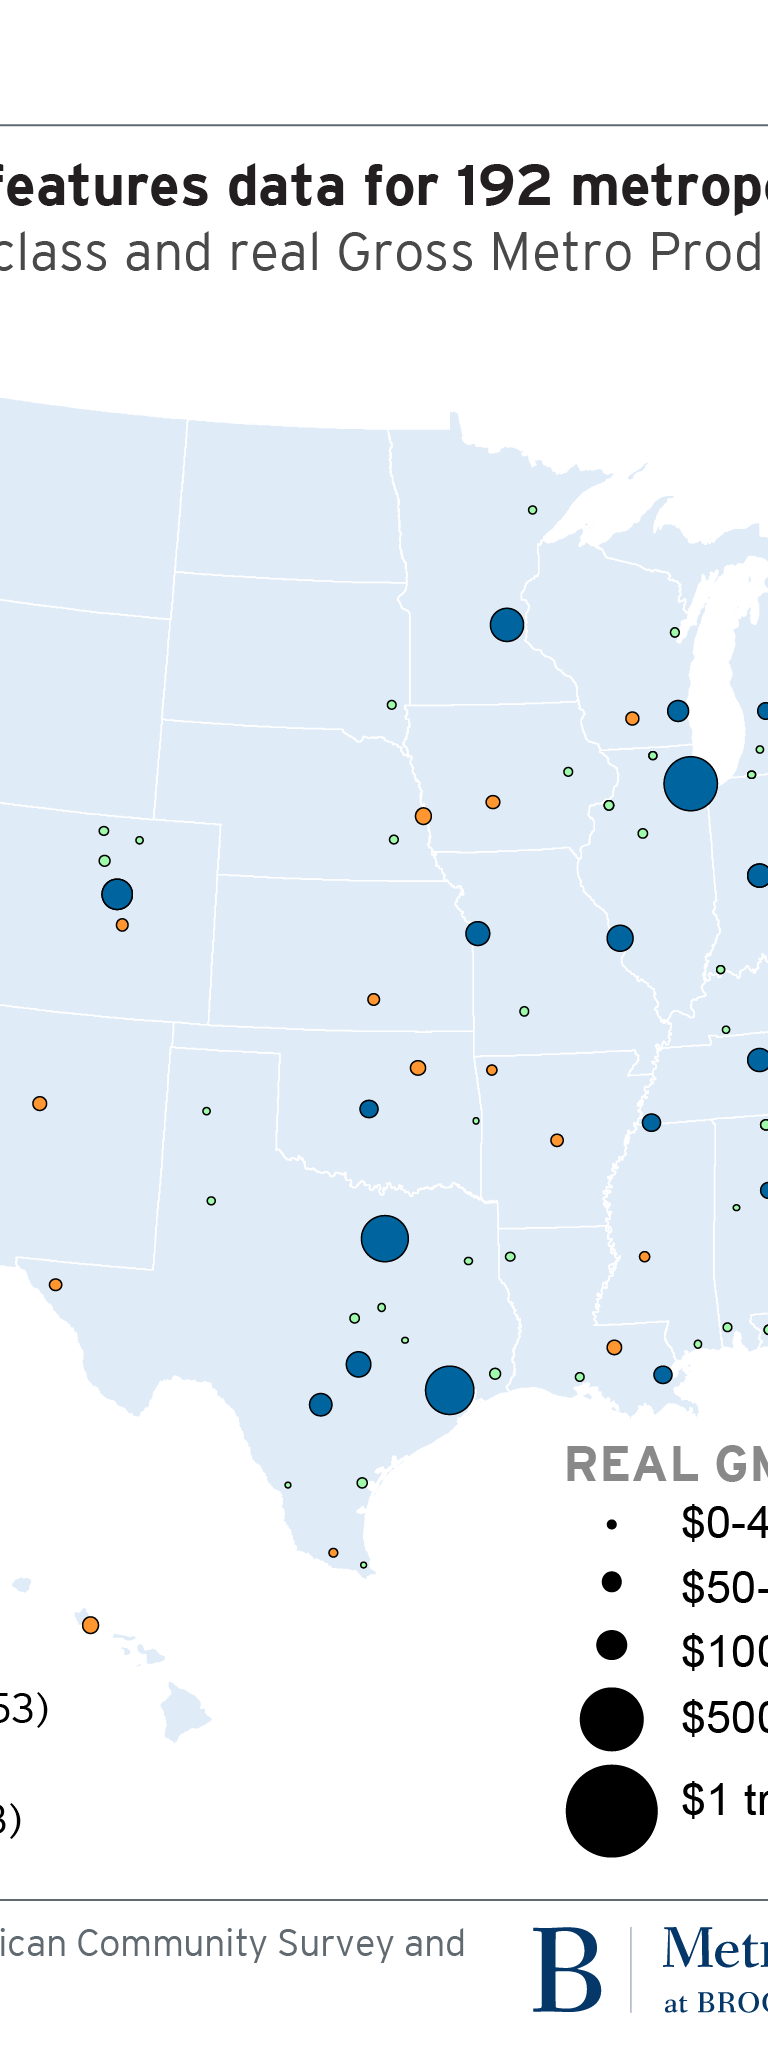
As such, this year’s Metro Monitor features data for 192 metro areas, divided into three categories: 53 very large metro areas with populations exceeding 1 million; 53 large metro areas with populations between 500,000 and 1 million; and the aforementioned 86 midsized metro areas. In contrast to prior years, when each metro area was ranked among the 100 largest, Metro Monitor now ranks each metro area’s performance within its own size class. With size becoming an increasingly important determinant of economic opportunity, this approach promotes more relevant benchmarking among similarly situated metropolitan areas.
In addition, the 2020 Metro Monitor tracks a new dimension of economic inclusion. In 2019, we added racial inclusion metrics, which tracked the degree to which long-standing economic gaps between white people and people of color in each metro area were expanding or shrinking over time. This year, we examine the additional dimension of geographic inclusion, which tracks whether local dynamics are widening or narrowing gaps between the most advantaged (top 20%) and least advantaged (bottom 20%) neighborhoods in each region across three economic inclusion indicators: employment rate, median income, and relative poverty rate. Because they frequently overlap with race, reducing these geographic gaps can promote underserved communities’ access to jobs, high-quality services, and sustainable investment. (A future blog post will delve more deeply into geographic inclusion findings from this year’s Monitor.)
On growth, prosperity, and overall inclusion, very large metro areas posted better long-term outcomes than large and midsized metro areas
Our colleagues Mark Muro and Jacob Whiton have periodically chronicled America’s growing economic divergence, including the degree to which job growth has increasingly concentrated in a smaller set of very large metro areas. That pattern is evident in growth, prosperity, and overall inclusion outcomes across all three metro area size classes between 2008 and 2018.

On the three growth indicators—changes in GDP, jobs, and jobs at young firms (a proxy for entrepreneurship)—very large metro areas overall outpaced large metro areas, which in turn outpaced midsized metro areas. The same pattern prevailed for prosperity indicators, including changes in average annual wages, output per job (productivity), and output per capita (standard of living). And in overall inclusion, the same positive relationship with metro area size characterized changes in the adult employment rate and median earnings.
Only in their relative poverty rate did midsized and large metro areas achieve more (albeit modest) progress over the decade than very large metro areas. It may be that very large metro areas’ progress in median earnings left more of their workers below half that median (our definition of relative poverty), versus in smaller metro areas where earnings increases were smaller.
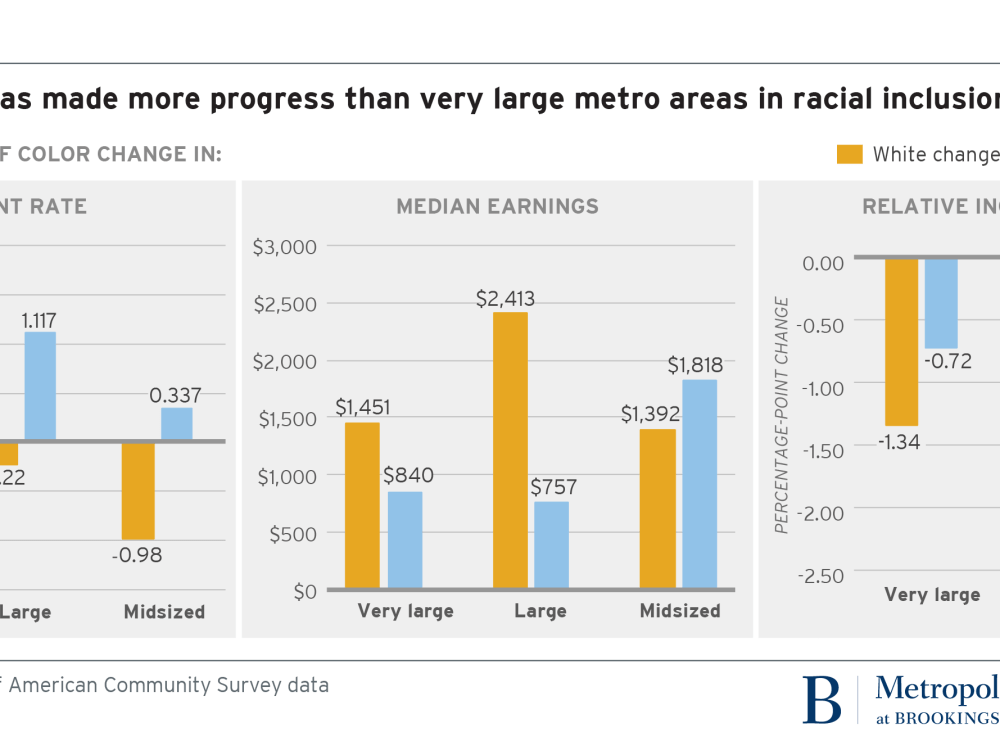
On racial inclusion, midsized metro areas made more progress than very large metro areas
Very large metro areas’ success did not, however, extend to racial inclusion. While no metro area size class performed all that well with regard to reducing economic gaps between white people and people of color from 2008 to 2018, midsized metro areas tended to make more progress than others.
Midsized metro areas began in 2008 with a larger racial employment rate gap than very large metro areas (6.8 versus 5.8 percentage points), but narrowed that disparity more over the subsequent decade, very similar to the trend in large metro areas. Midsized metro areas were the only size class to achieve a reduction (modest, at $430) in the median earnings gap between white workers and workers of color. And unlike very large metro areas, midsized and large metro areas managed to slightly narrow the racial relative poverty rate gap, to under 5 percentage points by 2018.
Of course, racial gaps can narrow even as other indicators rise or fall. For instance, the employment rate for white people and people of color rose in very large metro areas from 2008 to 2018, while the rate rose very modestly for people of color and fell for white people in midsized metro areas.
In many of the fastest-growing very large metro areas, racial gaps increased over time
The lack of progress on racial inclusion among very large metro areas seems to relate to those areas’ growth and prosperity dynamics. Specifically, the very large metro areas with the strongest growth and prosperity outcomes actually lost ground on racial inclusion, experiencing widening gaps in economic outcomes between their white and nonwhite populations.
Among the 10 very large metro areas that ranked highest on growth from 2008 to 2018, five also ranked among the top 10 for prosperity. San Francisco, San Jose, Calif., and Austin, Texas were among that group. Those same places, however, ranked among the weakest-performing very large metro areas on racial inclusion. Dallas, Houston, and Orlando, Fla. also registered strong growth but weak racial inclusion outcomes.

Only very large metro areas displayed this negative relationship between growth and prosperity on the one hand and racial inclusion on the other. The fastest-growing midsized metro areas—such as Boulder, Colo., Kennewick, Wash., and College Station, Texas—didn’t necessarily have better or worse racial inclusion outcomes than other metro areas. It may be that in physically large metro areas, residential or labor market segregation by race poses greater obstacles to ensuring that all groups benefit from a rising tide.
By contrast, faster-growing very large metro areas saw more substantial declines in economic gaps across neighborhoods. In those regions, fast growth may have changed the economic character of neighborhoods over the decade through processes such as gentrification, which could raise average outcomes in formerly disadvantaged communities.
Notwithstanding these patterns, a handful of very large metro areas—including Denver, San Antonio, and Raleigh, N.C.—bucked the trend by achieving strong progress across all five Metro Monitor dimensions from 2008 to 2018. A future post will explore the factors that may have contributed to their success, as well as the lack of success in metro areas such as Las Vegas, New Orleans, and Jacksonville, Fla., whose performance was consistently weaker.
For now, these top-line results affirm the critical role that local factors—economic structure, institutions, culture, and policy—continue to play in driving inclusive growth outcomes in our nation’s major metro areas.
Sarah Crump provided excellent underlying graphics and data assistance.
The Metropolitan Policy Program at Brookings would like to thank the Kresge Foundation and the Shared Prosperity Partnership for their generous support of this analysis.
Author

The Brookings Institution is committed to quality, independence, and impact.
We are supported by a diverse array of funders. In line with our values and policies, each Brookings publication represents the sole views of its author(s).


Commentary
Metro Monitor 2020: Prosperity is increasing in America’s largest metro areas, but not for everyone
March 5, 2020