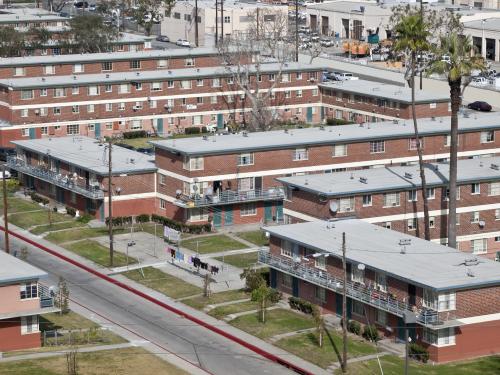
Where families live has profound implications for their access to opportunity. Our neighborhoods are the entry points to schools, transportation, jobs, health care, parks, and other local amenities. Where we live also determines who we interact with day to day, from professional networks and classmates to casual social interactions. To allow people of all races equal access to local housing markets, the 1968 Fair Housing Act prohibits discrimination by landlords, mortgage lenders, real estate agents, and other housing-related intermediaries. Studies have shown that racial segregation has declined across many U.S. cities over the past 50 years, moving away from the “chocolate city, vanilla suburbs” pattern that dominated 20th century metros. However, my recent research finds that there are still stark differences in where people of different races live.[1]
Using tract-level census data for 24 large metro areas, my co-authors and I examined whether neighborhood race conforms to the traditional 20th century pattern of non-white (largely black) city centers and white suburbs. We also observed to what extent a neighborhood’s racial and economic makeup matches its surrounding neighborhoods, independent of distance to city centers. Results show substantial sorting across neighborhoods by race and income. The maps below illustrate some of these patterns for four metropolitan areas: Atlanta, Detroit, Los Angeles and Washington D.C. These metros differ in their underlying spatial structure – notably the share of metro jobs located in the central city versus suburbs and natural geographic features – as well as racial composition. While specific patterns vary across metro areas, and by ethnic group within metro areas, some common themes emerge.
 Note: Ratio of tract poverty (race) to MSA poverty (race).
 Note: Ratio of tract poverty (race) to MSA poverty (race).
Black families live closer to city centers – but mostly on “their” side of town
On average, neighborhoods near their city’s central business district (CBD) have larger shares of poor and black residents, and in some cities, larger shares of Hispanics. Asians tend to live farther from their CBD. But distance doesn’t tell the whole story: the maps reveal asymmetric patterns of location by race. For instance, in Atlanta neighborhoods just south of the CBD are more heavily black than neighborhoods just north of the CBD. A similar pattern exists throughout the city of Atlanta and the surrounding suburbs. In Washington D.C., the divide is east-west, with blacks dominating the eastern side of the District of Columbia as well as the adjacent suburb of Prince George’s County, Md.
 Note: Ratio of tract poverty (race) to MSA poverty (race).
Geographic scale matters: How far must you walk to meet someone of another race?
The most commonly used racial segregation metric, the dissimilarity index, measures the concentration of races within small geographic areas, typically census tracts (approximately 5,000 residents). Tract-level dissimilarity indices tell us what share of how one racial group would have to move to another tract in order to achieve a uniform distribution of races across a metro area. But the maps reveal that racial concentration exists across census tracts, as well as within them: census tracts form larger clusters of racially similar areas. Two different larger scale spatial patterns are apparent. Heavily black census tracts tend to form a few very large blocs within metro areas: the southern half of Atlanta, a central chunk of Detroit, South Central Los Angeles, and the eastern half of Washington D.C. By contrast, while largely Hispanic and Asian tracts also cluster with similar tracts, they tend to form smaller clusters scattered across the metro areas. An exception is Los Angeles, where majority Hispanic tracts form a large bloc in the center/northeast of the metro.
 Note: Ratio of tract poverty (race) to MSA poverty (race).
The scale of racial clustering matters because the size of relatively homogeneous clusters affects our daily experience of segregation – whether we encounter primarily people of our own race near our homes and in the activities of daily life. Blacks not only live in more segregated tracts, but concentrated black tracts are more isolated from other racial groups at a larger geographic scale.
Black, Hispanic and Asian families that “got a piece of the pie” are “movin’ on out”
Correlation analysis reveals that for all three non-white population groups, household income is a strong predictor of within-metro location (Table 1). For most of the 24 metro areas in our sample, median household income of blacks, Hispanics, and Asians is positively correlated with distance to city centers. However, in most metro areas, the income of white households is not correlated with proximity to the CBD. These findings are consistent with previous research indicating that since the legal desegregation of housing markets, black and Hispanic middle class families have moved to the suburbs, leaving their poorer neighbors in central cities. The lack of a consistent relationship between white income and within-metro location may reflect the relatively recent trend of affluent white households moving close to city centers, even as many middle-income whites continue to live in the suburbs.
| Table 1: Income rises with distance to CBD for non-white families | ||||
|---|---|---|---|---|
| Notes: Tract-level correlation coefficients between household income by race/ethnicity and tract distance from the CBD. All MSAs includes 24 metro areas from all Census regions. | ||||
| Correlation between distance and income among: | ||||
| MSA | Whites | Blacks | Hispanics | Asians |
| Atlanta | -0.09 | 0.45 | 0.18 | 0.25 |
| Detroit | 0.40 | 0.48 | 0.25 | 0.54 |
| Los Angeles | 0.20 | 0.30 | 0.36 | 0.33 |
| Washington DC | -0.02 | 0.53 | 0.14 | 0.22 |
| All MSAs | 0.06 | 0.36 | 0.20 | 0.30 |
Implications for improving racial integration and economic inclusion
Nearly 50 years after the Fair Housing Act, the U.S. has not achieved racial integration.
Stark racial differences in residential location are visible to the most casual observer. Our results concur with other research concluding that differences in income alone cannot explain the degree of racial sorting in housing markets. Whether racial sorting reflects individual preferences by households of all races, or continuing institutional barriers in housing markets to non-white families, it is unlikely that existing laws will be sufficient to eliminate racial segregation. The U.S. Department of Housing and Urban Development’s Affirmatively Furthering Fair Housing (AFFH) rule, adopted under the Obama administration, outlines a more active federal role in combating racially exclusionary practices of local governments. However, the AFFH rule is too new to judge its effectiveness – or whether the Trump administration plans to enforce it.
“Inner cities” aren’t synonymous with poverty or race. Place-based policies trying to alleviate poverty and racial disparities should reflect that.
Traditionally, U.S. urban policy has mostly consisted of channeling federal funds to large cities, with the intent of supporting economic and community development in poor neighborhoods. Programs such as Community Development Block Grants (CDBG), Low Income Housing Tax Credits (LIHTC), and New Markets Tax Credits are allocated mostly by community income and population size. However, not all central city residents are poor or non-white – and not all poor and minority families live in central cities. Addressing racial disparities, alleviating poverty, and supporting urban development are three distinct goals. More thoughtful targeting of federal policies might help us achieve these goals.
[1] Thanks to my co-authors Jeff Larrimore, Ellen Merry, Barbara Robles, Anna Tranfaglia and Arturo Gonzalez for their contributions to the paper on which this blog is based. The opinions and analysis expressed here are solely my own and do not indicate concurrence by the Board of Governors of the Federal Reserve System or the Federal Reserve Bank of Philadelphia.


Commentary
Metro areas are still racially segregated
But it’s more complicated than “chocolate city, vanilla suburbs”
December 8, 2017