While Americans travel for a variety of reasons, there’s arguably no more important trip each day than their commute to work. Each year, the U.S. Census Bureau updates its national statistics on commuting habits. These statistics—which extend down to large cities—enable consistent benchmarks about how the American commute may be changing or simply staying the same.
Here are the biggest takeaways from the latest 2016 American Community Survey (ACS) data.
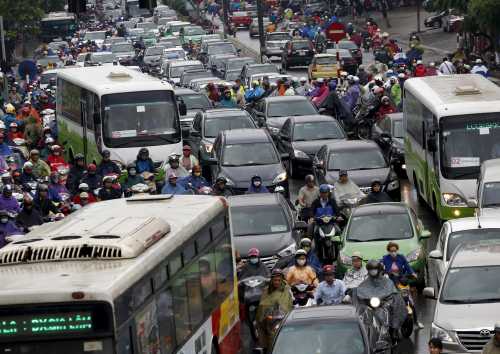
American commuters still largely depend on cars
It’s impossible to look at American commuting habits and not report the obvious: Americans are still largely dependent on the automobile. Over 76 percent of Americans drive alone to work every day, while another 9 percent carpool with someone else. Considering that ACS counted 150 million workers in 2016, that’s at least 115 million cars and trucks hitting American streets every day. It’s no wonder congestion is so pervasive during morning and afternoon rush hours.
These driving rates come at a real cost to American households. Owning and maintaining a private vehicle is expensive, and one of the reasons transportation is the second-highest average expense after housing. With median incomes stalled in inflation-adjusted terms—and many metro areas seeing even deeper inclusion challenges—driving represents a significant cost burden for many.

Nationally, commuting shares are stubbornly persistent
America’s deep commitment to driving is also nothing new. Looking at ACS estimates between 2007 and 2016, no transportation mode saw its share of total commuters change more than 1.5 percentage points. Even with all the roads widened, transit lines built, ride-hailing services launched, and bike share systems introduced, we’re still looking at the same fundamental distribution of commuter choice.

Now, this doesn’t mean the same number of people are taking each mode. As the U.S. population continues to increase and more people are working, the number of commuters is also up. So even though driving rates dipped slightly, there are still more cars on the road. The same applies to bikes and transit, too.
Crucially, as more commuters drive to work, their fuel-inefficient cars remain one of the gravest threats to environmental sustainability. Just last year, the U.S Energy Information Administration reported that transportation became the economy’s number one polluting sector. Simply put, if Americans can’t get out of their cars—or their cars continue to be combustion-based rather than making the switch to electrified engines fueled by renewables—there’s no way cities, states, or the country can reach their carbon-reduction targets.
However, cities are beginning to lead shifts away from driving
While national commuting habits may be persistent, cities prove that mode shift is possible.
This includes driving rates. Over the last decade, 21 of the country’s 50 most-populated cities saw a significant drop in driving.* Seattle has earned major headlines for seeing it’s residents’ solo driving rate drop below 50 percent, while Oakland, Calif., Washington, D.C., and Nashville, Tenn. saw their solo driving rates fall by at least 3 percentage points. However, not every city reduced their solo driving. Los Angeles’ solo driving rate ticked-up by 2 percentage points, while Miami and Houston approached 4 percentage point increases. Considering their deep commitment to transit from the ballot booth and mayor’s office, the Los Angeles story will be fascinating to watch over the next decade.
On the flip side, it’s not your imagination—there really are more cyclists in many big cities. Significant rate increases occurred in 22 of 50 cities, with only one city (Las Vegas) witnessing a decrease. Relative bike hubs like Portland, Ore. and Boston also keep pushing up the demonstrated ceiling for urban bike commuting, especially if public policy supports a safe and networked biking environment. Along with walking increases and working from home, these non-driving modes increased in all but three big cities.

Cities faced a more mixed picture for public transit, with seven cities seeing a significant increase in transit commuting rates, but 12 seeing a significant decrease. Nor were all results what one would expect. Even with dynamic investment via FasTracks, Denver’s transit share dropped. Meanwhile, Jacksonville, Fla. saw an uptick without sizable new capital projects.
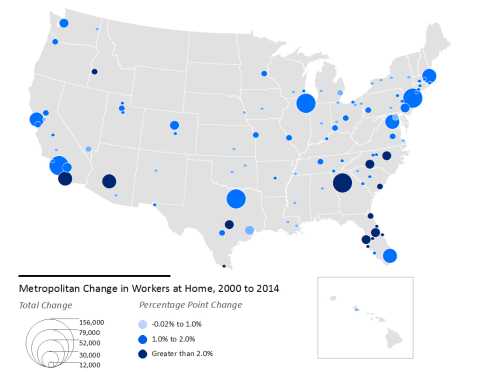
Working from home continues its upward climb
We’ve written about it before, our colleague Rob Puentes called it out in a recent column, and Justin Fox did the same this year—more and more Americans are working from home. The immediate explanation here is the virtuous mix of wide broadband availability, prevalent video software, and relaxed telecommuting policies. But keep in mind that the ACS counts anyone who works from home in these numbers, not just those who digitally login to a job. In other words, we’re likely seeing more telecommuters, the changing nature of work, and probably the two combined for many.
What’s certain is the pervasiveness of the trend: 32 of 50 cities saw a significant increase in work from home rates. That included big jumps in high-tech hubs like Austin, Texas, advanced service hubs like Charlotte, N.C., and even freight hubs like Memphis, Tenn.
We need better data to capture mode shift in the digital era
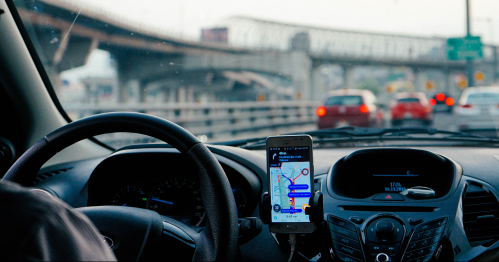
But in exploring these numbers, there is a whole category of questions that we simply cannot answer: how has the explosion in smartphone-related applications changed commuting habits? For example, current research shows that ride-hailing spikes during off-peak commuting hours, suggesting many users are not ride-hailing for work. That means ACS simply can’t tell us anything about them. And for those who do ride-hail to commute, ACS collapses taxi and motorcycles under one category—assuming ride-hailing users would even choose taxis as the comparable choice.
This is just the tip of the iceberg, however. ACS is an incredible asset for commuting research, full stop. But the majority of all trips are not commutes, and we simply don’t have the same kind of annual, geographically-extensive databases to tell us much about non-work trips. In an era when bike sharing and ride-hailing are expanding rapidly, when smartphone penetration continues to grow, and more of America’s innovation economy turns to new mobility solutions—including a future with autonomous vehicles—it’s imperative for public agencies from the federal level down to develop new resources to track change in future travel behavior.
*Estimates denoted as a statistically significant change reflect the results of a statistical significance test at the 90% level.
METHODOLOGICAL NOTE: Because metropolitan area definitions change between decades and 1-year ACS data doesn’t include all counties due to population limitations, it’s not possible to include perfectly comparable, continuous metropolitan data for the period. However, cities do stay roughly consistent and enable such local longitudinal analysis via the 1-year ACS data.
Photo credit: San Francisco Bicycle Coalition/Flickr
Related Content
Author

The Brookings Institution is committed to quality, independence, and impact.
We are supported by a diverse array of funders. In line with our values and policies, each Brookings publication represents the sole views of its author(s).


Commentary
America’s commuting choices: 5 major takeaways from 2016 census data
October 3, 2017