From year to year, most workers tend to stick to their same commutes. The vast majority continue to drive alone to work, with a few workers gradually relying more on buses, bikes, or their own home offices, as we recently revealed from the new Census commute data in the 2014 American Community Survey compared to 2013.
Over time, though, the American commute is shifting in increasingly novel ways, especially at the metropolitan level. Going back to 2000, many workers are opting out of traditional modes of transport like cars and switching to other modes.
The continued surge in remote working offers perhaps the most widespread evidence of these changing commute patterns, helping lower costs and take cars off the road. From 2000 to 2014, nearly 2.4 million more people—or 13 percent of all new commuters—are working at home to bring their national total to 6.5 million. Moreover, the share of workers at home has risen from 3.2 percent to 4.5 percent, surpassing the rate of growth in all other commuting categories and building off a series of emerging work patterns in the public and private sector.
This pattern is nearly universal across the country. With the exception of Omaha, all metro areas experienced a gain since 2000 in the share of people working from home, topped by Raleigh, Boise, and Austin, which each realized a jump of 3 percentage points or more. There’s a bit of a regional pattern to the growth, too, with the largest gainers primarily in the South or West.
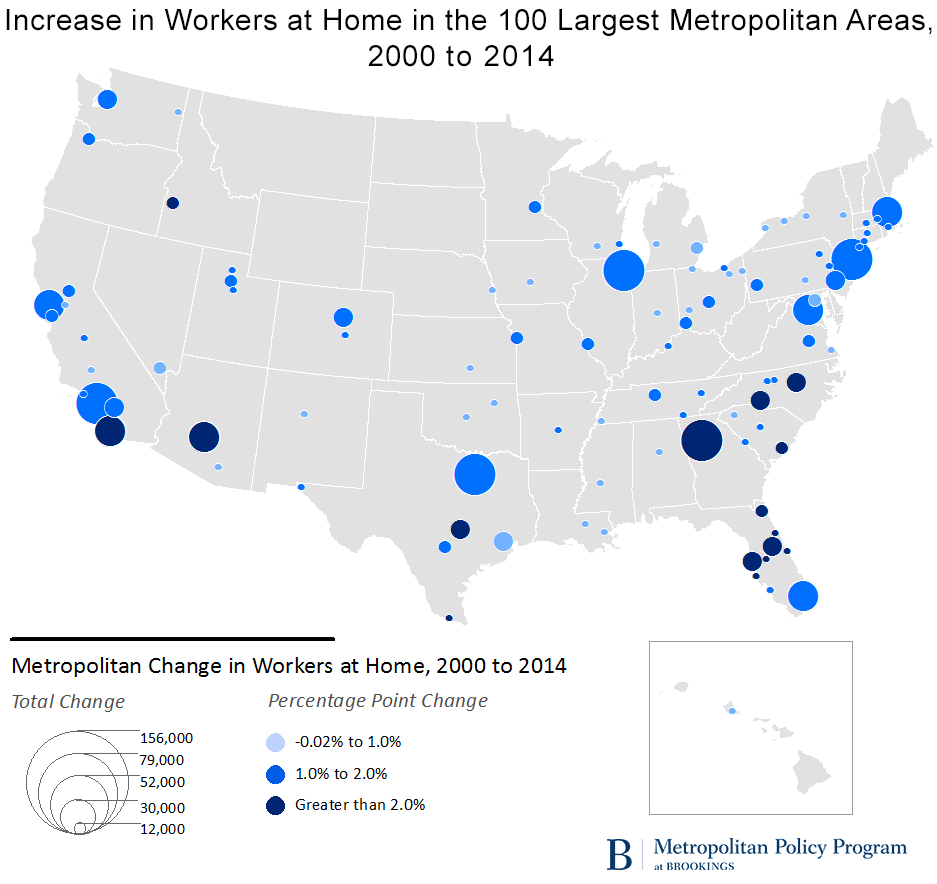
Source: Brookings analysis of decennial census and American Community Survey data
In addition to working at home, many commuters are also seeking alternate transportation options in the form of transit and biking, in particular. Since 2000, almost half of the 100 largest metro areas have increased their levels of public transportation commuting, with the biggest gains concentrated in transit-rich places like New York, Washington, and San Francisco. While the gains are a bit smaller, shares also grew in larger metro areas making major transit investments, like Charlotte and Minneapolis, and smaller metros with an enormous university presence, like Madison and Syracuse.
Biking, however, has made even more impressive strides. From 2000 to 2014, 92 of the 100 largest metro areas increased their share of bike commuters—headlined by Portland—and 28 have realized a statistically significant gain since 2007 alone. Of course, national bike commuting rates still rest at only 0.6 percent, so there is still huge room for growth as metro areas pursue bike-focused infrastructure and transition to multimodal roadway design.
While driving remains the dominant force in most of our commutes—even as declines of 5 percentage points or more have occurred in some markets since 2000—there is a growing penchant for a wider variety of transportation modes. Combined with stalled driving rates per person, it’s imperative that transportation and land use planners recognize these changes as they design and build infrastructure for the next generation.
The Brookings Institution is committed to quality, independence, and impact.
We are supported by a diverse array of funders. In line with our values and policies, each Brookings publication represents the sole views of its author(s).


Commentary
Since 2000, American commuters more likely to work from home or use alternate modes
September 28, 2015