The authors prepared this piece as part of Infrastructure Week 2017. This national collection of events, meetings, and publications serves to convene leaders inside and outside government about infrastructure’s contributions to the broader economy. To learn more, visit http://infrastructureweek.org/
“We’re going to rebuild our infrastructure, which will become, by the way, second to none. And we will put millions of our people to work as we rebuild it.” From the very first night of his election win, President Trump was clear about his intention to usher in a new era in American infrastructure. Since assuming office, the president and his cabinet continue to use the figure of $1 trillion over ten years to demonstrate the scale of their vision.
By any measure, one trillion dollars is a lot of money. Given the well-documented maintenance and modernization backlogs in a range of infrastructure sectors, federal attention is welcome. Infrastructure spending has the added benefit of helping to support millions of good-paying jobs.
But just how historic would a $1 trillion federal infrastructure program be?
Despite the allure, judging the historic nature of this figure is impossible without more context. This analysis provides additional background by using historical data from the Office of Management and Budget (OMB) on federal spending on physical infrastructure over the past eight-plus decades. The exercise confirms that while a $1 trillion infrastructure program would rank among the larger sustained periods of federal spending in relative terms, it would likely fall short of record spending under the New Deal.
Methodology and Approach
While there are several recent analyses tracking levels of federal infrastructure spending, changing budget classifications and differences in infrastructure categorizations make it difficult to conduct long-term comparisons. The Congressional Budget Office, for instance, is frequently cited for federal transportation and water infrastructure spending, but these data do not capture a broad range of federal activities, including energy and housing, that align with the 2017 conversation. Similarly, a variety of other organizations like the World Economic Forum and OECD, and media outlets like the Economist and Wall Street Journal typically concentrate on a more limited time horizon.
To get a more complete understanding of physical infrastructure spending at the federal level, this analysis uses the “physical resources” superfunction data from historical OMB budgets, which have greater consistency over a longer period of time. This category exists from 1940 through 2017, and includes the categories President Trump and his cabinet have mentioned as part of their ideal package: energy; natural resources and environment; transportation; and community and regional development. Since this analysis is also primarily interested in direct capital spending, it excludes the sizable Commerce and Housing Credit within this budget category.
This analysis views these levels of federal spending relative to earlier New Deal era programs in the 1930s, such as the Public Works Administration. The enormous size and number of federal infrastructure projects during this period figure prominently in the nation’s collective mindset. There are the epic visual reminders like the Hoover Dam, but there are also the less visible, but still significant efforts such as rural electrification and municipal water systems. Since OMB did not report data in the 1930s, this analysis required manually going through historic budgets and economic literature to construct comparable measures. While it is difficult to precisely define infrastructure investment during this decade, particularly given fluctuations in federal spending and economic output, this analysis attempts to highlight the relative height of spending during the New Deal. To do so, it includes peak spending in 1933 and average spending across 1933 to 1937. The figure below highlights an example of what spending just before the peak in 1933 looked like (and how they visualized the data).
Example of Historical Federal Budget Data, 1925

To enable comparisons across eight decades of data, the analysis uses historic GDP data from the Bureau of Economic Analysis to express infrastructure spending as a share of total economic output. Viewing spending as a share of economic activity provides a clearer idea of the relative importance of infrastructure, even when compared across multiple countries. Moreover, to compare aggregate spending amounts over time, the analysis has also been adjusted for inflation using Consumer Price Index data. To run future scenarios over the next decade, the analysis assumes consistent annual growth rates in GDP of 2.5 percent and infrastructure baseline spending of 2.8 percent.
Although details are still forthcoming, the president has not explicitly said that all of this infrastructure investment will come from federal coffers. The administration’s narrative makes the case that some amount of federal spending—perhaps as much as $200 billion—would leverage up to $1 trillion most likely through partnerships with states and cities, as well as private and institutional investors.
While the federal infrastructure program is the main analytical focus here, it is by no means the only investor in national infrastructure. In fact, different types of infrastructure often depend on a variety of actors for design, governance, finance, and delivery. When it comes to transportation and water infrastructure, for example, states and localities are responsible for three-quarters of all public spending, with public-private partnerships growing in importance to get projects done. For its part, the private sector is the lead investor in a number of different infrastructure sectors such as telecommunications, freight rail, and energy. Still, the federal government today plays a critical role in financing infrastructure investment, which historical perspective can help us better understand.
Historical Comparisons
Federal infrastructure spending has grown steadily since the 1940s. When adjusted for inflation, real federal spending on physical resources—including energy, natural resources, transportation, and community development—is nearly six times higher today than it was in 1940, and more than double what it was in 1970. Notable spikes in federal spending are apparent during the Interstate Highway Era of the late 1950s, the introduction of more comprehensive environmental and community development efforts during the 1970s, and the passage of the American Recovery and Reinvestment Act in 2009. Real federal spending over this 75-year period averages around $102 billion annually.

However, these aggregate comparisons are misleading from a historical standpoint. When taking into account the rising cost of materials and other inputs to construction, the federal government’s buying power has diminished over time. These aggregate totals also fail to illustrate the growing importance of operation and maintenance expenses, which are increasingly falling on the shoulders of states and localities. This analysis also does not consider the quality of the federal investments in terms of their different impact on the economy. For example, a 2004 Department of Transportation report found that investments in Interstate Highways made during the 1970s generated an 18 percent return, in contrast to a 5 percent return for 1980s investments, and only a 1 percent return for the 1990s.
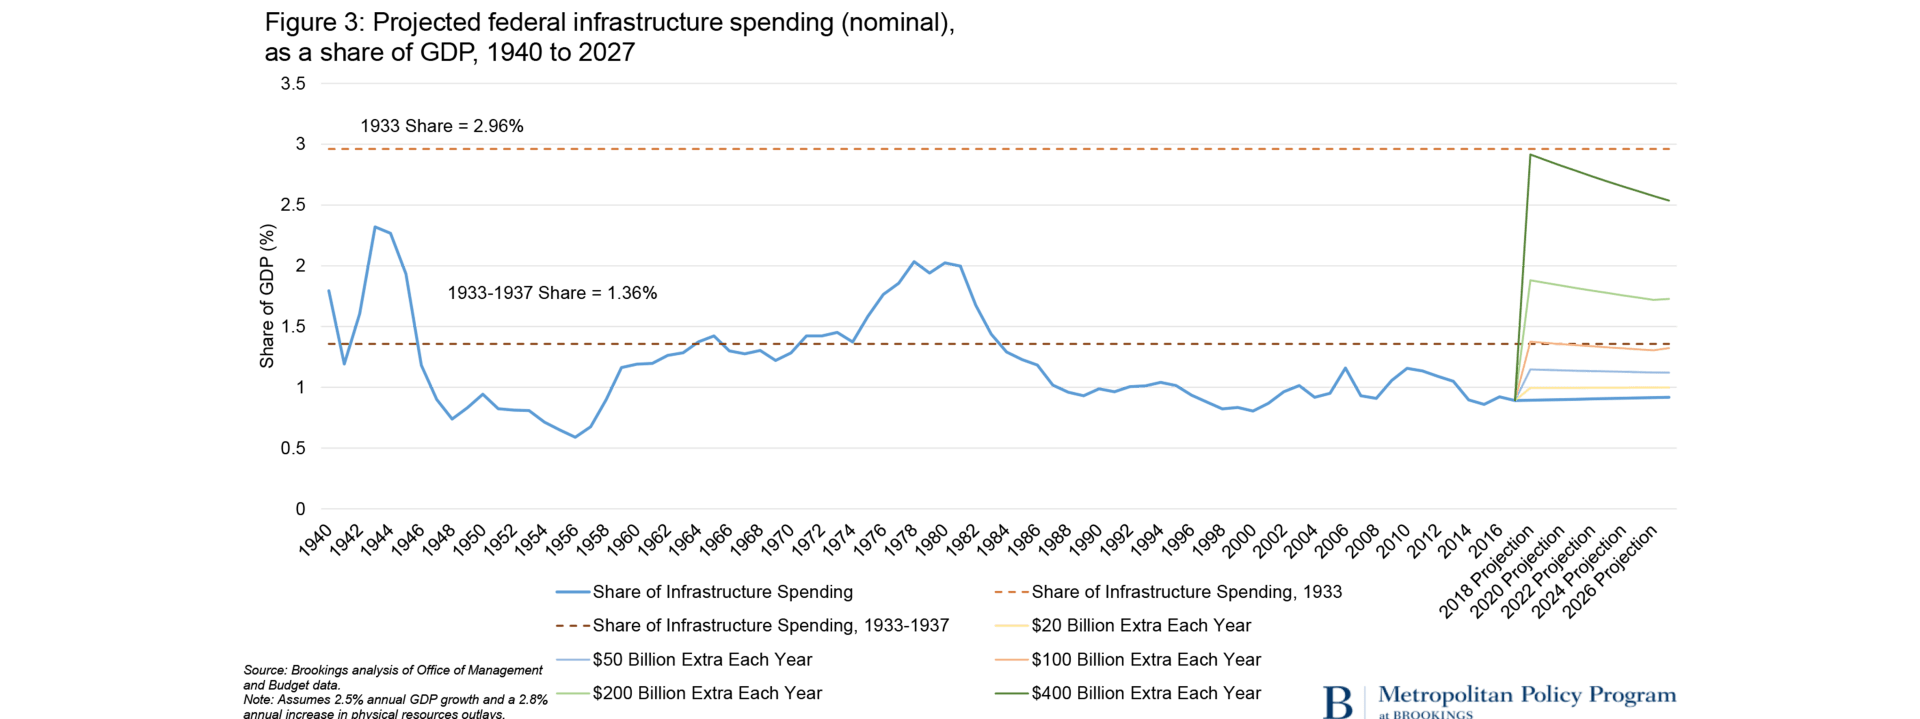
In this way, a more useful measure is to look at federal infrastructure spending as a share of the country’s GDP. It is easy to see several spikes in federal spending, particularly one started during the Interstate Highway Era of the late 1950s, but the spending share generally hovers between 1.0 and 1.5 percent of GDP. The longest sustained peak was the 1974 to 1983 period, where federal coffers supported new water resource projects alongside the continued highway build-out.

That spending share lags historical highs. In particular, when the Public Works Administration was launched in 1933, the federal government began to assume an unprecedented role in infrastructure spending, which peaked at about 2.96 percent of GDP. While it is methodologically challenging to precisely track this share of spending over the years that followed—mainly due to changes in budget classifications—it represents the “height” of federal infrastructure spending in many ways. That height has yet to be matched, even when using the broadest definitions of infrastructure at the federal level. Average New Deal infrastructure spending was considerably lower, but was higher than any other period besides the late-1970s boom.
Would President Trump’s proposal to spend $1 trillion over the next ten years on infrastructure restore New Deal-era investment levels? The chart below compares five different federal infrastructure spending scenarios and how they might affect its share of GDP over the next decade. To do so, it uses 2017 infrastructure spending as a baseline and then adds different annual amounts based on each scenario. (Note that for comparison, this analysis also assumes all spending is counted as direct investment by the federal government, even though Cabinet members have suggested that an 82 percent tax credit would drive most of this investment via the private sector.)
In Congress, the political chess match needed to pass a $1 trillion federal infrastructure plan will be far from easy. If Congress approved $20 billion extra each year over the next decade— a total of $200 billion, corresponding to some administration comments—that would only increase federal infrastructure spending’s GDP share to around 1 percent. It would take a surge to $100 billion each year, as was proposed by Senate Democrats in January, to reach the New Deal average from 1933 to 1937. However, not even $200 billion extra each year over the next decade would restore spending effort to the highest levels during the New Deal. This analysis shows that it would take upwards of $400 billion extra each year over the next decade—or $4 trillion in total—to meet a comparable benchmark and exceed it over the remaining years.
The particular timing of any proposal, of course, could end up shifting these effects. Although few details exist on how and when any additional federal spending would take place, it is possible that an accelerated timeline could make it easier to reach New Deal levels. For instance, $1 trillion in federal infrastructure investment over two years, rather than a decade, would represent a near 3 percent GDP share. Sustained support at this level, though, would require enormous up-front borrowing and would be nearly impossible to spend quickly.
Major Takeaways and Conclusion
While this analysis only provides a quick snapshot of historical federal infrastructure spending with many caveats, it illustrates the magnitude involved in any potential plan moving forward. The Trump administration and Congressional leaders have signaled the importance of infrastructure to the economy—and the need to strengthen it through additional public or private support—but getting any federal plan across the finish line will not be easy. A $1 trillion plan would require a herculean effort to execute, and—while it would mark a sizable uptick in federal spending—there’s no guarantee it would bring the country back to the record-setting levels during the New Deal.
The New Deal represented a signature point in time for federal investment in America’s built environment. It helped pave hundreds of thousands of roads, construct hundreds of runway miles at emerging airports, and harness the abundant water resources of the Tennessee Valley. An equivalent federal effort today would require spending an additional $400 billion per year on infrastructure, approaching current annual spending on national defense.
Considering the hurdles that the Trump administration’s investment proposal will face, we likely won’t see a new New Deal in our near future. Instead, cities, states, and the private sector will continue assuming a more prominent role supporting infrastructure. Whether supported through state gas tax increases, tax referenda at the metropolitan scale, new bond issuances in cities, or direct private investments, new infrastructure investment will need to occur regardless of what happens in Washington.
Many thanks to Annie Rice for her research assistance on this post.
Related Content

Authors


The Brookings Institution is committed to quality, independence, and impact.
We are supported by a diverse array of funders. In line with our values and policies, each Brookings publication represents the sole views of its author(s).


Commentary
How historic would a $1 trillion infrastructure program be?
May 12, 2017