Wherever you are right now, look around–I guarantee you’re surrounded by consumer items. What device are you reading this on: a smartphone, tablet, laptop, or desktop computer? What about the furniture in your home or office? Or how about the clothes you’re wearing? All of these products represent goods that someone designed, manufactured, and transported, and every single one of them represents, in a small way, the trade networks that help define our everyday existence.
When discussing trade, national-level trade predominates. From vaunted academic research to monthly updates on international trade balances—assuming the federal government isn’t shutdown—there are many ways to measure and analyze trade between countries. Ultimately, these are mostly revised techniques and updated reports using the same international scope—-new reports on the same stuff.
But national trade statistics only tell part of the story.
Today we’ve released the initial new research from our Metro Freight series, which offers a comprehensive look at how metropolitan areas trade goods. The analysis marks the first time every U.S. metro area can measure both their domestic and global trade relationships and compare them to their peers. With metro areas already generating an outsized share of national economic output, and global trade growing at over 400 percent since 1990, it’s vital that metro areas understand how goods trade works from their vantage point. This research offers that view.
And as it turns out, measuring trade at the metropolitan scale tells a more nuanced and varied story than traditional international reporting would suggest.
First off, trade is not equally distributed—the 100 largest metro areas are the country’s chief trade drivers. They exchange over $12 trillion in goods each year, representing 60 percent of domestic and international trade combined. This includes trading powerhouses like New York and Houston, but also smaller metros like San Jose and New Orleans whose economies specialize in buying and selling goods. Even within the traditional confines of international trade the 100 metros are more globally-oriented than the rest of the country, proving our largest metros are the chief sites of global interactivity.
Including domestic trade also better captures what U.S. metro areas make, especially with regard to advanced industries (abbreviated as AI). The 100 metros run a $52 billion surplus in AI products, which require heavy R&D investment and a highly-skilled workforce. The surpluses have breadth, too: 81 metros run a surplus in at least one of the five related commodities. In an especially interesting twist, some goods where the U.S. consistently runs an international deficit, like electronics, the 100 metros actually trade at a domestic surplus. When limiting trade reporting to border crossings, we miss key economic exchanges like these within our borders.
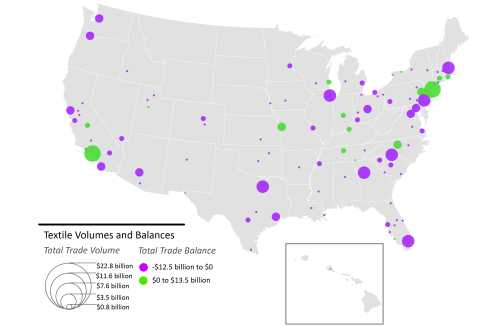
Large metro areas are also critical consumers. To power their industries and feed their households, large metros rely on natural resource-related goods from smaller metros, rural areas, and foreign markets. Agriculture, energy, textiles, and wood products trade at a combined $603 billion deficit. This speaks to the vital relationship between rural and big city America, and confirms classic and modern economic geography theories. It also raises important questions about how we interpret goods trade balances when many of our metropolitan economies are specifically geared towards the production of services.
In the end, this initial work aims to spark new conversations with public and private sector leaders about the role of goods trade in metropolitan economies. The results can have far-reaching implications on how we make economic development plans, how we build the infrastructure that facilitates trade, and how national and local interests can share responsibilities in these critical areas. We’re excited to get those conversations started.
Related Content


Related Books


Author

The Brookings Institution is committed to quality, independence, and impact.
We are supported by a diverse array of funders. In line with our values and policies, each Brookings publication represents the sole views of its author(s).


Commentary
Redefining Goods Trade, Metro by Metro
October 22, 2013