Poverty is typically defined in terms of a lack of adequate income, especially in U.S. policy debates. But the experience of poverty goes well beyond household finances, and can include a lack of education, work, access to healthcare, or distressed neighborhood conditions. These additional dimensions of poverty can be layered on top of income poverty; they can also put those who are not income-poor at a disadvantage.
In a new report published today, we look at poverty across multiple dimensions for adults aged 25 to 61, using the 2014 American Community Survey. We look in particular at differences in how different dimensions of disadvantage overlap, or cluster together for people in different racial categories. We find stark race gaps in the risks of overlapping disadvantage in five dimensions (as this accompanying interactive shows):
- Low household income (below 150 percent of the federal poverty line)
- Limited education (less than a high school degree)
- Lack of health insurance
- Low income area (PUMA poverty rate exceeds 20 percent)
- Household unemployment
Big race gaps in multidimensional poverty
Almost half of the U.S. population suffered from at least one of the five disadvantages in 2014. The proportion suffering from many dimensions of poverty is lower—but far from trivial. For instance, there are more than 3 million black adults and 5 million Hispanic adults facing at least three disadvantages:
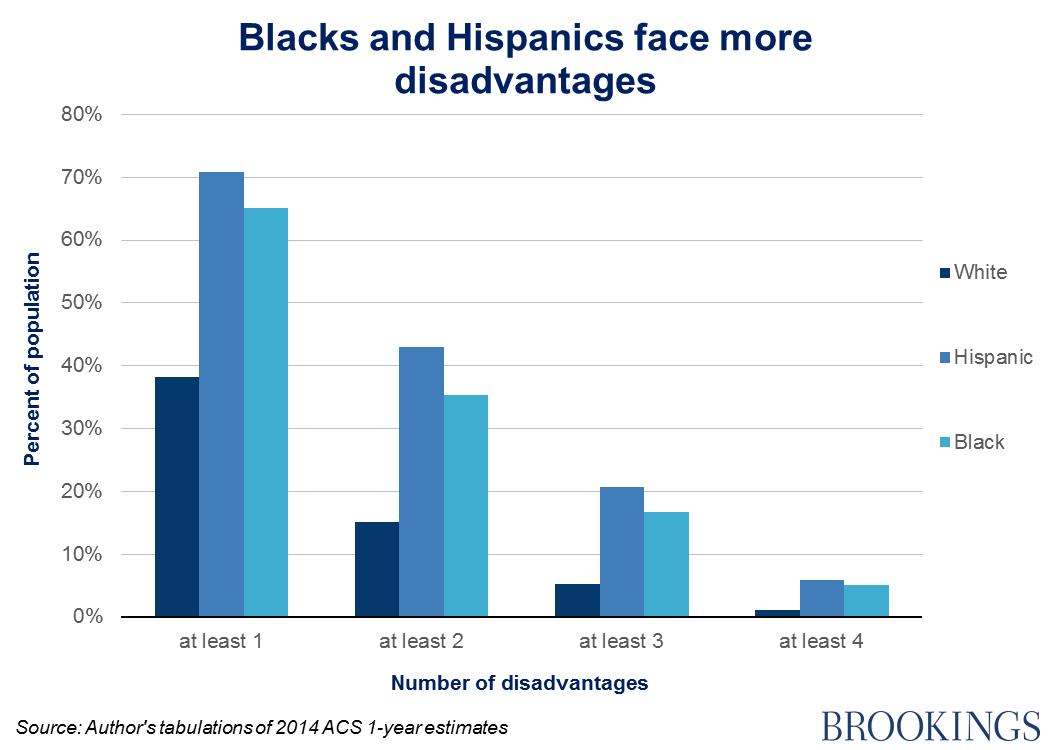
Most white adults don’t suffer any of the five disadvantages. Most Hispanic and black adults do. Only 38 percent of white adults face at least one disadvantage, versus almost 70 percent for Hispanic and black residents. Furthermore, among the white adults that do experience at least one disadvantage, most don’t experience any additional disadvantages. By contrast, most black and Hispanic adults with at least one disadvantage suffer at least one additional disadvantage.
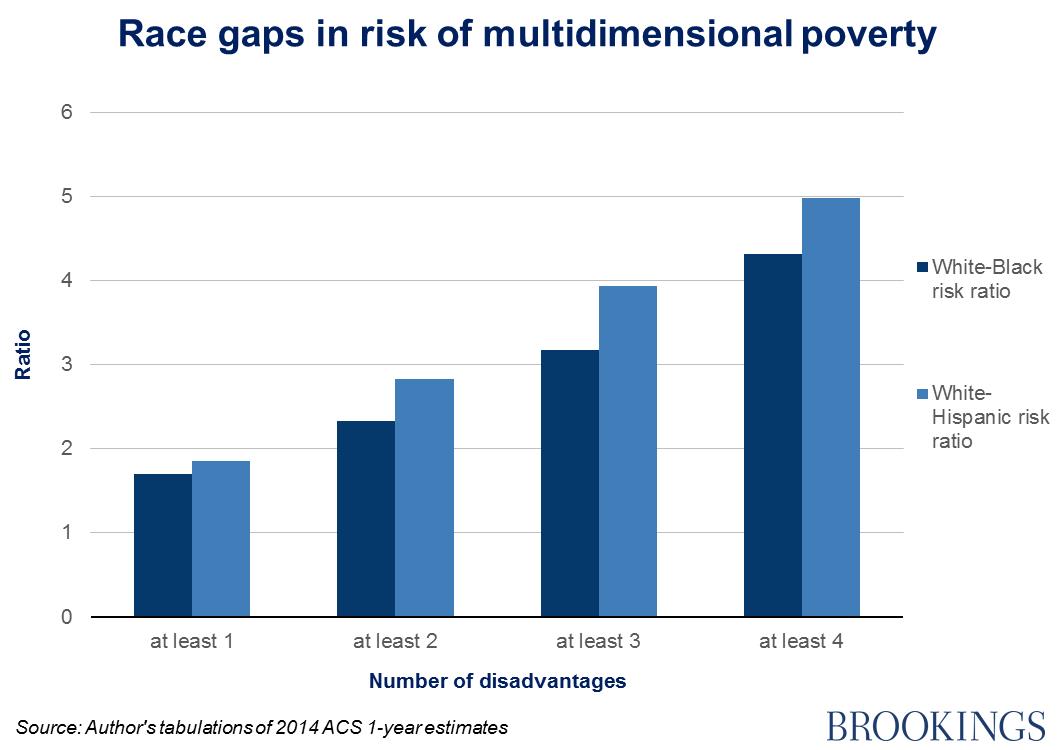
Another way to show patterns by race is to comparing the relative risk of black or Hispanic adults being disadvantaged on multiple dimensions, compared to whites. As the disadvantages grow in number, so the race gaps widen:
Different kinds of poverty faced by black and Hispanic adults
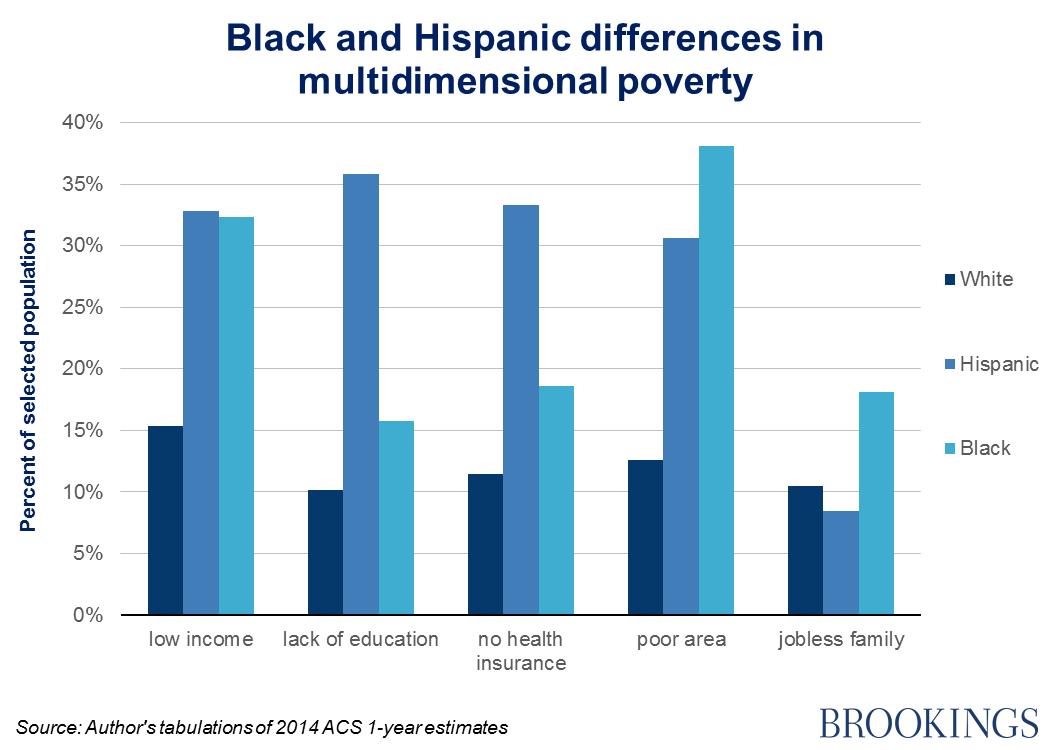
There are important differences between people in different racial categories, however. Black residents are more likely to live in a poor area and/or a jobless family than Hispanics, who are more likely to lack a high school education and/or health insurance:
Needed: Broader conceptions of poverty
Scholars and policy-makers inspired by the capabilities-based approach of Amartya Sen are advancing broader approaches to measures of poverty and well-being. Some nations including Mexico have formally adopted a multidimensional measure. Others such as France and England are giving more weight to non-monetary forms of disadvantage. The U.S. has made strides in addressing the many shortcomings of the official poverty measure through the creation of the much more nuanced Supplemental Poverty Measure. But it is still an income-only yardstick.
A more multifaceted approach to measuring poverty, like the one offered here, reveals some of the insights that can be gained in the U.S. by framing the issue more broadly—from revealing the deep racial and ethnic disparities that exist to shedding light on the differing dimensions of disadvantage experienced from one group to the next.
In our next paper, to be published next week, we examine the geography of multidimensional poverty, assessing how patterns of disadvantage shift across U.S. metro areas and rural communities, including by race. Understanding how disadvantages vary and the different ways they cluster together by race and place will provide a more nuanced picture of poverty in America today.
The Brookings Institution is committed to quality, independence, and impact.
We are supported by a diverse array of funders. In line with our values and policies, each Brookings publication represents the sole views of its author(s).


Commentary
How 5 dimensions of poverty stack up, and who’s at the greatest risk
April 14, 2016