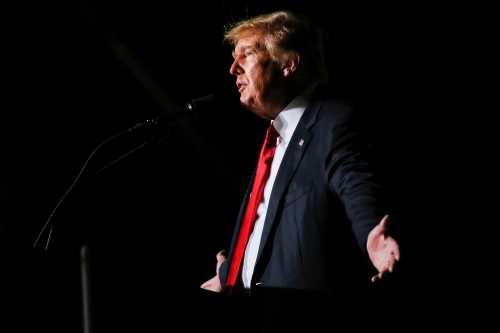
Now that Donald Trump has won the presidency, he may yet become a unifying figure in his party. Who knows! But, as you may recall, just a few weeks ago, he seemed downright radioactive to many members of the GOP. Especially in the wake of the infamous Billy Bush video being released, many Republicans took the extraordinary step of publicly distancing themselves from him, saying that they intended to vote for somebody other than their party’s nominee for President (or at least abstain from voting). Now that Trump has won, if it turns out that his reputation as a grudge-keeper holds true when he is President these de-endorsements may prove costly. But it’s also possible that they helped some members—who tend to know their districts better than pundits sometimes give them credit for—keep their jobs.
Including both Republican House members and Senators facing reelection in 2016 (i.e., excluding the two-thirds of senators who did not face reelection this cycle), there were 33 Trump de-endorsers, as shown in Table 1. That compares with 166 Trump endorsers, and 40 members who registered as neither. In a year in which most Republicans held their seats, Trump anti-endorsers clearly lost at a higher rate than Trump’s endorsers.
|
Table 1 – Wins and losses for Republican Trump endorsers and anti-endorsers (among both House and Senate candidates) |
|||
| Trump endorsers | Trump anti-endorsers | Neither | |
| W | 164 | 28 | 39 |
| L | 2 | 5 | 0 |
| Total | 166 | 33 | 39 |
(Sources: Trump endorsers, Trump anti-endorsers)
Of course this difference is driven by correlation, of several interrelated factors, rather than causation. Members in anti-Trump districts and states had the most to gain from distancing themselves from Trump, but they were also likely to be facing generally anti-Republican electorates. Since this was hardly a wave election for Trump—nearly 53 percent of all voters chose another candidate, including a greater number who voted for Hillary Clinton than for him—a good many Republicans did have a lot to lose by being tied to Trump, and therefore something to gain from disavowing him. The election’s result does nothing to change that.
For House members from relatively blue districts, this is almost certainly the right story. Of the 10 anti-endorsers who came from districts that Romney lost in 2012, three ended up losing their seats this year—Robert Dold (IL-10), David Jolly (FL-13), and Cresent Hardy (NV-4). The same is true of Senator Kelly Ayotte of New Hampshire, who quite pointedly portrayed herself as someone who could act as a check on Trump in Congress in the final weeks of the campaign. It’s probably fair to say that distancing themselves from Trump was necessary, but insufficient, for these candidates to have kept their seats.
On the other hand, seven members from blue districts managed to hold their seats, and their Trump anti-endorsements may well have been crucial. Notably, Representatives John Katko (NY-24), Carlos Curbelo (FL-26), and David Valadao (CA-21) each successfully defended seats in districts where Mitt Romney lost by more than 10 points in 2012.
A number of Trump anti-endorsers came from quite safe red districts, and it is probably fairer to say that they reached the decision to de-endorse in spite of potential electoral costs of doing so rather than out of any strategic consideration. With the possible but unlikely exception of Freedom Caucus member Representative Scott Garrett (NJ-5), whose purplish northern New Jersey district seems to have rejected him because of policy positions they perceived as too extreme, none of these red district or red state Trump anti-endorsers paid the price of their seat this week. Whether they will come to wish they had held their tongues once Trump takes office in January, we will have to wait and see.
For a full accounting of the performance of Trump anti-endorsers, see tables 2 and 3 below. For the House, Trump’s margin of victory in their district is not provided because presidential results by congressional district are not yet available.
| Table 2 – Performance of House Incumbent Anti-Endorsers | ||||
| Name | State | District | 2016 House Margin of victory | 2012 Romney Margin of Victory |
| Robert Dold | IL | 10 | -5 | -16.4 |
| John Katko | NY | 24 | 22 | -15.9 |
| Carlos Curbelo | FL | 26 | 11.8 | -11.5 |
| David Valadao | CA | 21 | 17.2 | -11.1 |
| David W. Jolly | FL | 13 | -3.8 | -10.7 |
| Cresent Hardy | NV | 4 | -4 | -10.7 |
| Frank Lobiondo | NJ | 2 | 22.3 | -8.1 |
| Ileana Ros-Lehtinen | FL | 27 | 9.8 | -6.7 |
| Mike Coffman | CO | 6 | 8.9 | -5.1 |
| Erik Paulsen | MN | 3 | 13.8 | -0.8 |
| Rodney Davis | IL | 13 | 19.4 | 0.3 |
| Fred Upton | MI | 6 | 22.2 | 1.4 |
| Barbara Comstock | VA | 10 | 5.8 | 1.6 |
| Jaime Beutler | WA | 3 | 19.4 | 1.7 |
| Steve Knight | CA | 25 | 8.6 | 1.9 |
| Patrick Meehan | PA | 7 | 19.4 | 1.9 |
| Will Hurd | TX | 23 | 1.7 | 2.6 |
| Charles Dent | PA | 15 | 20.4 | 2.9 |
| Scott Garrett | NJ | 5 | -3.3 | 3.1 |
| Justin Amash | MI | 3 | 21.9 | 7.3 |
| Adam Kinzinger | IL | 16 | 100 | 7.7 |
| Ann Wagner | MO | 2 | 21 | 15.7 |
| Tom Rooney | FL | 17 | 27.6 | 16.3 |
| Jeff Fortenberry | NE | 1 | 39.2 | 16.6 |
| Martha Roby | AL | 2 | 9.2 | 26.5 |
| Mike Simpson | ID | 2 | 33.7 | 31 |
| Kay Granger | TX | 12 | 42.6 | 35.1 |
| Mia Love | UT | 4 | 10.1 | 37 |
Source for 2012 presidential results by congressional district
| Table 3 – 2016 Performance of Senators Up For Reelection Who Anti-Endorsed Trump |
||||
| Name | State | 2016 Senate Margin of victory | 2016 Trump Margin of Victory | 2012 Romney Margin of Victory |
| Kelly Ayotte | NH | -0.1 | -0.2 | -5.6 |
| Rob Portman | OH | 21.4 | 6.8 | -3 |
| John McCain | AZ | 12.3 | 4.4 | 9.1 |
| Lisa Murkowski | AK | 33.2 | 5.2 | 14 |
| Mike Lee | UT | 40.8 | 19 | 48.1 |
Related Content
Authors
The Brookings Institution is committed to quality, independence, and impact.
We are supported by a diverse array of funders. In line with our values and policies, each Brookings publication represents the sole views of its author(s).

Commentary
Did Republicans’ Trump endorsements affect their election chances?
November 10, 2016