When teachers leave teaching, where do they go next? Are they getting good jobs outside of education? Or are subsequent jobs more of a lateral move? Or do teachers who quit teaching also quit working?
School districts that lose teachers lose their investment in training those teachers, whether the teachers quit teaching or whether the teachers move to another district. To a significant extent, districts to which teachers transfer in get a benefit at the expense of the sending districts. In contrast, when teachers move to another profession, public schools as a whole lose out. (At least to the extent that it’s the better teachers leaving.)
Chalkboard reader Dr. Joe O’Reilly, of the Mesa, Arizona school district, asked if I could put together any data to help sort this all out. I have put together a few such numbers. To set the stage, here’s a chart taken from data from the “Teacher Follow-up Survey” (TFS) of the School and Staffing Survey, which is administered to school teachers nationwide every four years by the U.S. Department of Education.
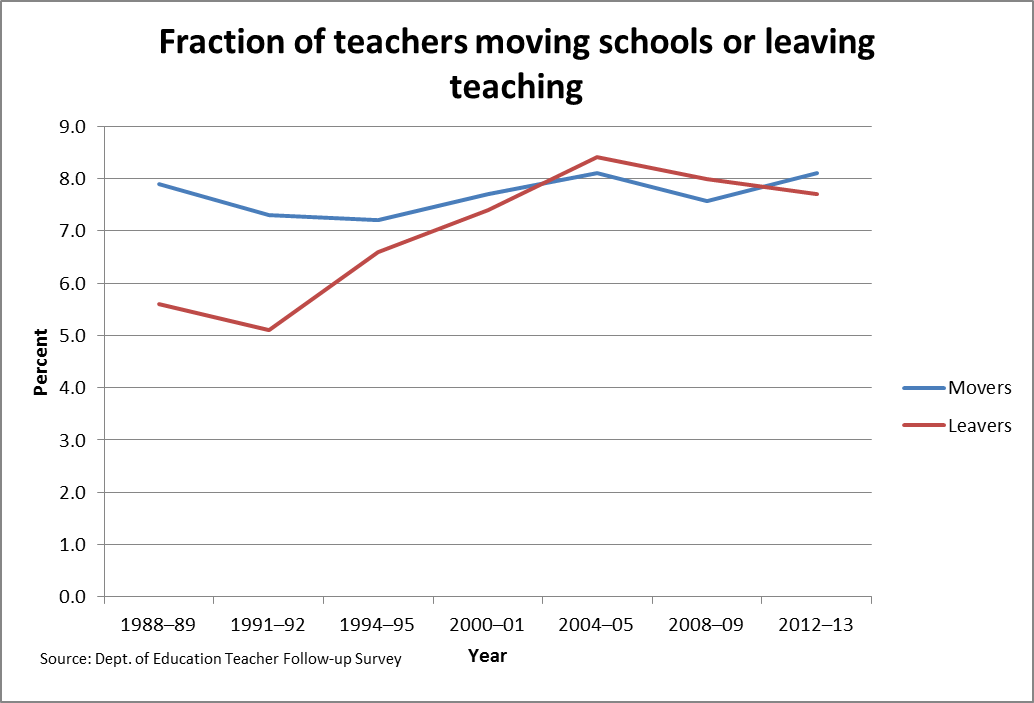
We see in the chart that about 16 percent of teachers exited a school in recent years, combining both exits represented here. Roughly half of that 16 percent move to another school. (Some of these “movers” end up in a different school in the same district.) This fraction of teachers switching schools hasn’t changed much over time.
If that eight percent represented equal-sized back-and-forth trades between districts, it might not be of great concern. I suspect, however, that some districts regularly lose more than their share of experienced teachers while others (wealthier? “easier” to teach students) are net gainers. (Boyd, et. al. wrote “…schools with better working conditions and higher salaries bid away the better qualified teachers from difficult-to-staff schools.”[1]
The other eight percent leave teaching. The fraction of teachers leaving the profession entirely has noticeably risen. Unless one thinks that we’ve seen a major increase in the tendency of weak teachers to move onward—and I can’t imagine that such a major increase is likely—then this trend is a matter of some concern.
TFS also offers us some information about what teachers who left teaching did next, as shown in the next chart.
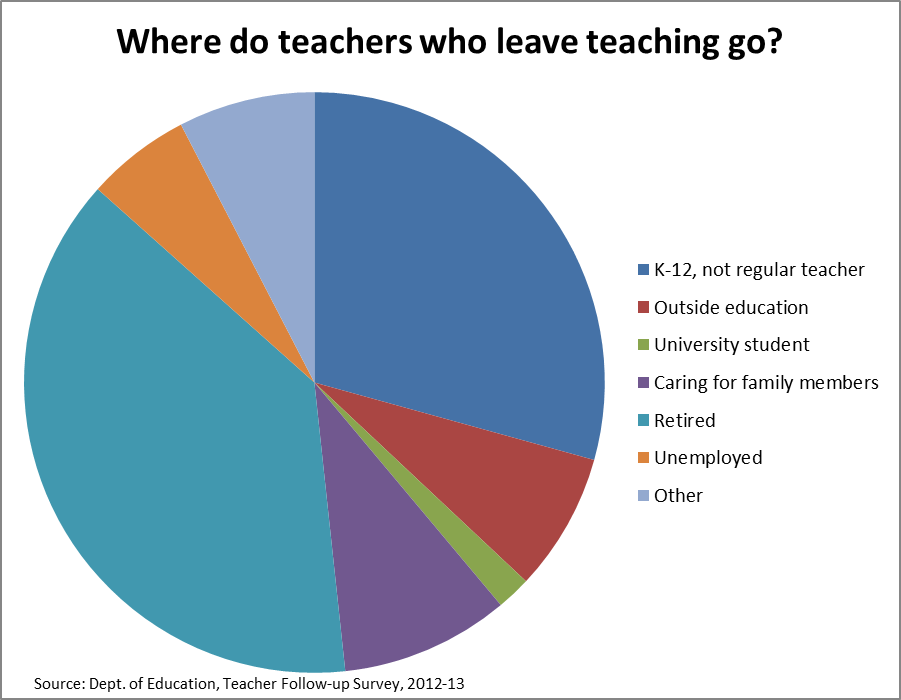
Basically, two-thirds of leavers either take a non-teaching job in K-12 or move into retirement. Neither of these “destinations” raises a concern about teachers finding more attractive careers on the outside. (Although there probably is something wrong when the only way a master teacher can get a significant raise while staying in education is to quit teaching.) Another nine percent leave to care for a family member and a small number go back to school—also probably not of great concern.
We’re left with a relatively small number of teachers who leave education for alternative work. This number is on the order of two percent per year. While the number is small, if you’re running a school district you still might want to have a better idea of where the leavers are leaving to. To get a bit of a handle on this I turned to the Current Population Survey, putting together data for 2010-2015, and asked where leavers went who were working and not in some kind of K-12 position. With the caution that the sample was pretty small—I found only 332 respondents—the next table gives the breakdown of the “larger” categories.
Destination occupations of teachers who left education
| Destination occupation | Percent |
|---|---|
| Lawyers, Judges, magistrates, and other judicial workers | 6.93 |
| Physicians and surgeons | 6.63 |
| Postsecondary teachers | 4.22 |
| Retail salespersons | 3.61 |
| Secretaries and administrative assistants | 3.01 |
| Social Workers | 2.71 |
| Managers, all other | 2.41 |
| Customer service representatives | 2.11 |
| Other education, training, and library workers | 1.81 |
| Personal and home care aides | 1.81 |
| Child care workers | 1.51 |
| First-line supervisors/managers of retail sales workers | 1.51 |
| Cashiers | 1.51 |
| Receptionists and information clerks | 1.51 |
| Human resource workers | 1.2 |
| Artists and related workers | 1.2 |
| Cooks | 1.2 |
| Janitors and building cleaners | 1.2 |
| Marketing and sales managers | 0.9 |
| Farmers, ranchers, and other agricultural managers | 0.9 |
| Construction managers | 0.9 |
| Business operations specialists, all other | 0.9 |
| Counselors | 0.9 |
| Social and human service assistants | 0.9 |
| Religious workers, all other | 0.9 |
| Miscellaneous legal support workers | 0.9 |
| Speech-language pathologists | 0.9 |
| Registered nurses | 0.9 |
| Recreation and fitness workers | 0.9 |
| Sales representatives, wholesale and manufacturing | 0.9 |
| Door-to-door sales workers, news and street vendors, and related workers | 0.9 |
| Bookkeeping, accounting, and auditing clerks | 0.9 |
| Interviewers, except eligibility and loan | 0.9 |
| First-line supervisors/managers of production and operating | 0.9 |
You will see why I put “larger” categories in quotes. Those who leave teaching go to an incredibly wide variety of different jobs. It is notable that the first three destinations—lawyers, doctors, and professors—are all lucrative or prestigious jobs. Past that point, the destination jobs are all over the map.
Pulling this all together, we have a four-point answer to Dr. O’Reilly’s query.
- Schools lose about one teacher out of six each year. If you’re a principal or an HR director that’s a huge burden, without respect for where the teachers may be going.
- A fair number of teachers, about one out of 12, do leave the profession each year. The bulk of moves might be characterized as “about what we would expect,” i.e. teachers retire, take other education positions, or are taking care of a family member.
- Among the modest number of real career changers, there isn’t much of a pattern as to what sort of jobs teachers move to. But…the data isn’t great. The sample is small and we observe teachers for only a single year after leaving teaching. Leading to…
- Chalkboard readers might well chime in here. Do you have anecdotal evidence about where teachers go next? Does your district do exit interviews? Are you a teacher…or former teacher…with friends who’ve made the jump? Share what you know in the comments section and we can all enlighten each other.
Data sources:
Teacher Follow-up Survey: U.S. Department of Education, National Center for Education Statistics, Teacher Follow-up Survey (TFS), “Current and Former Teacher Data Files,” 2012-13; Teacher Attrition and Mobility: Results from the 2008-09 Teacher Follow-up Survey, U.S. Department of Education, National Center for Education Statistics (NCES 2010-353). https://nces.ed.gov/surveys/sass/tables/TFS1213_2014077_cf1n_001.asp ;
http://nces.ed.gov/surveys/sass/tables/TFS1213_2014XXX_f1n_006.asp
Current Population Survey 2010-2015, “Steven Ruggles, Katie Genadek, Ronald Goeken, Josiah Grover, and Matthew Sobek. Integrated Public Use Microdata Series: Version 6.0 [Machine-readable database]. Minneapolis: University of Minnesota, 2015.”
[1] Boyd, Grossman, Lankford, Loeb, and Wycoff, “How Changes in entry and requirements alter the teacher workforce an affect student achievement,” Education Finance and Policy, Vol. 1, No. 2, 2006.


Commentary
What do teachers do when they leave teaching?
May 9, 2016