The onset of the pandemic changed movement patterns across the world. Business closures, lockdowns, and movement restrictions forced people to spend more time at home and less time at work or running errands. Yet the nature of these interventions varied by level of human development: According to a recent report by the United Nations Development Program, “COVID-19 and Human Development: Assessing the Crisis, Envisioning the Recovery,” countries with low and medium values on the Human Development Index have been much less likely to implement lockdowns, school closures, and movement restrictions than countries with high or very high levels. Newly released data from Google now enables researchers to quantify how these movement patterns have changed and compare trends across regions.
The anonymized data show how the frequency and duration of visits to places have changed since January and February (what Google defines as the “baseline”). The dataset divides visits to places into six categories: retail and recreation, grocery and pharmacy, parks, transit, workplace, and residential. Figure 1 shows how mobility in residential areas has changed since the onset of the pandemic. One can see that Botswanans began spending more time at home in March, even before Botswana announced a nationwide lockdown on April 2, as more and more African countries began to announce their first coronavirus cases. In fact, when the first lockdown went into effect, residential mobility had already increased 10 percent. Residential mobility skyrocketed during the lockdown and began to decrease as the lockdown wore on. Residential mobility increased dramatically again during the two-week lockdown in Botswana’s capital city of Gaborone in August. Residential mobility in in Botswana has not returned to its baseline levels.
Figure 1. Percent change in community mobility in residential areas, Botswana
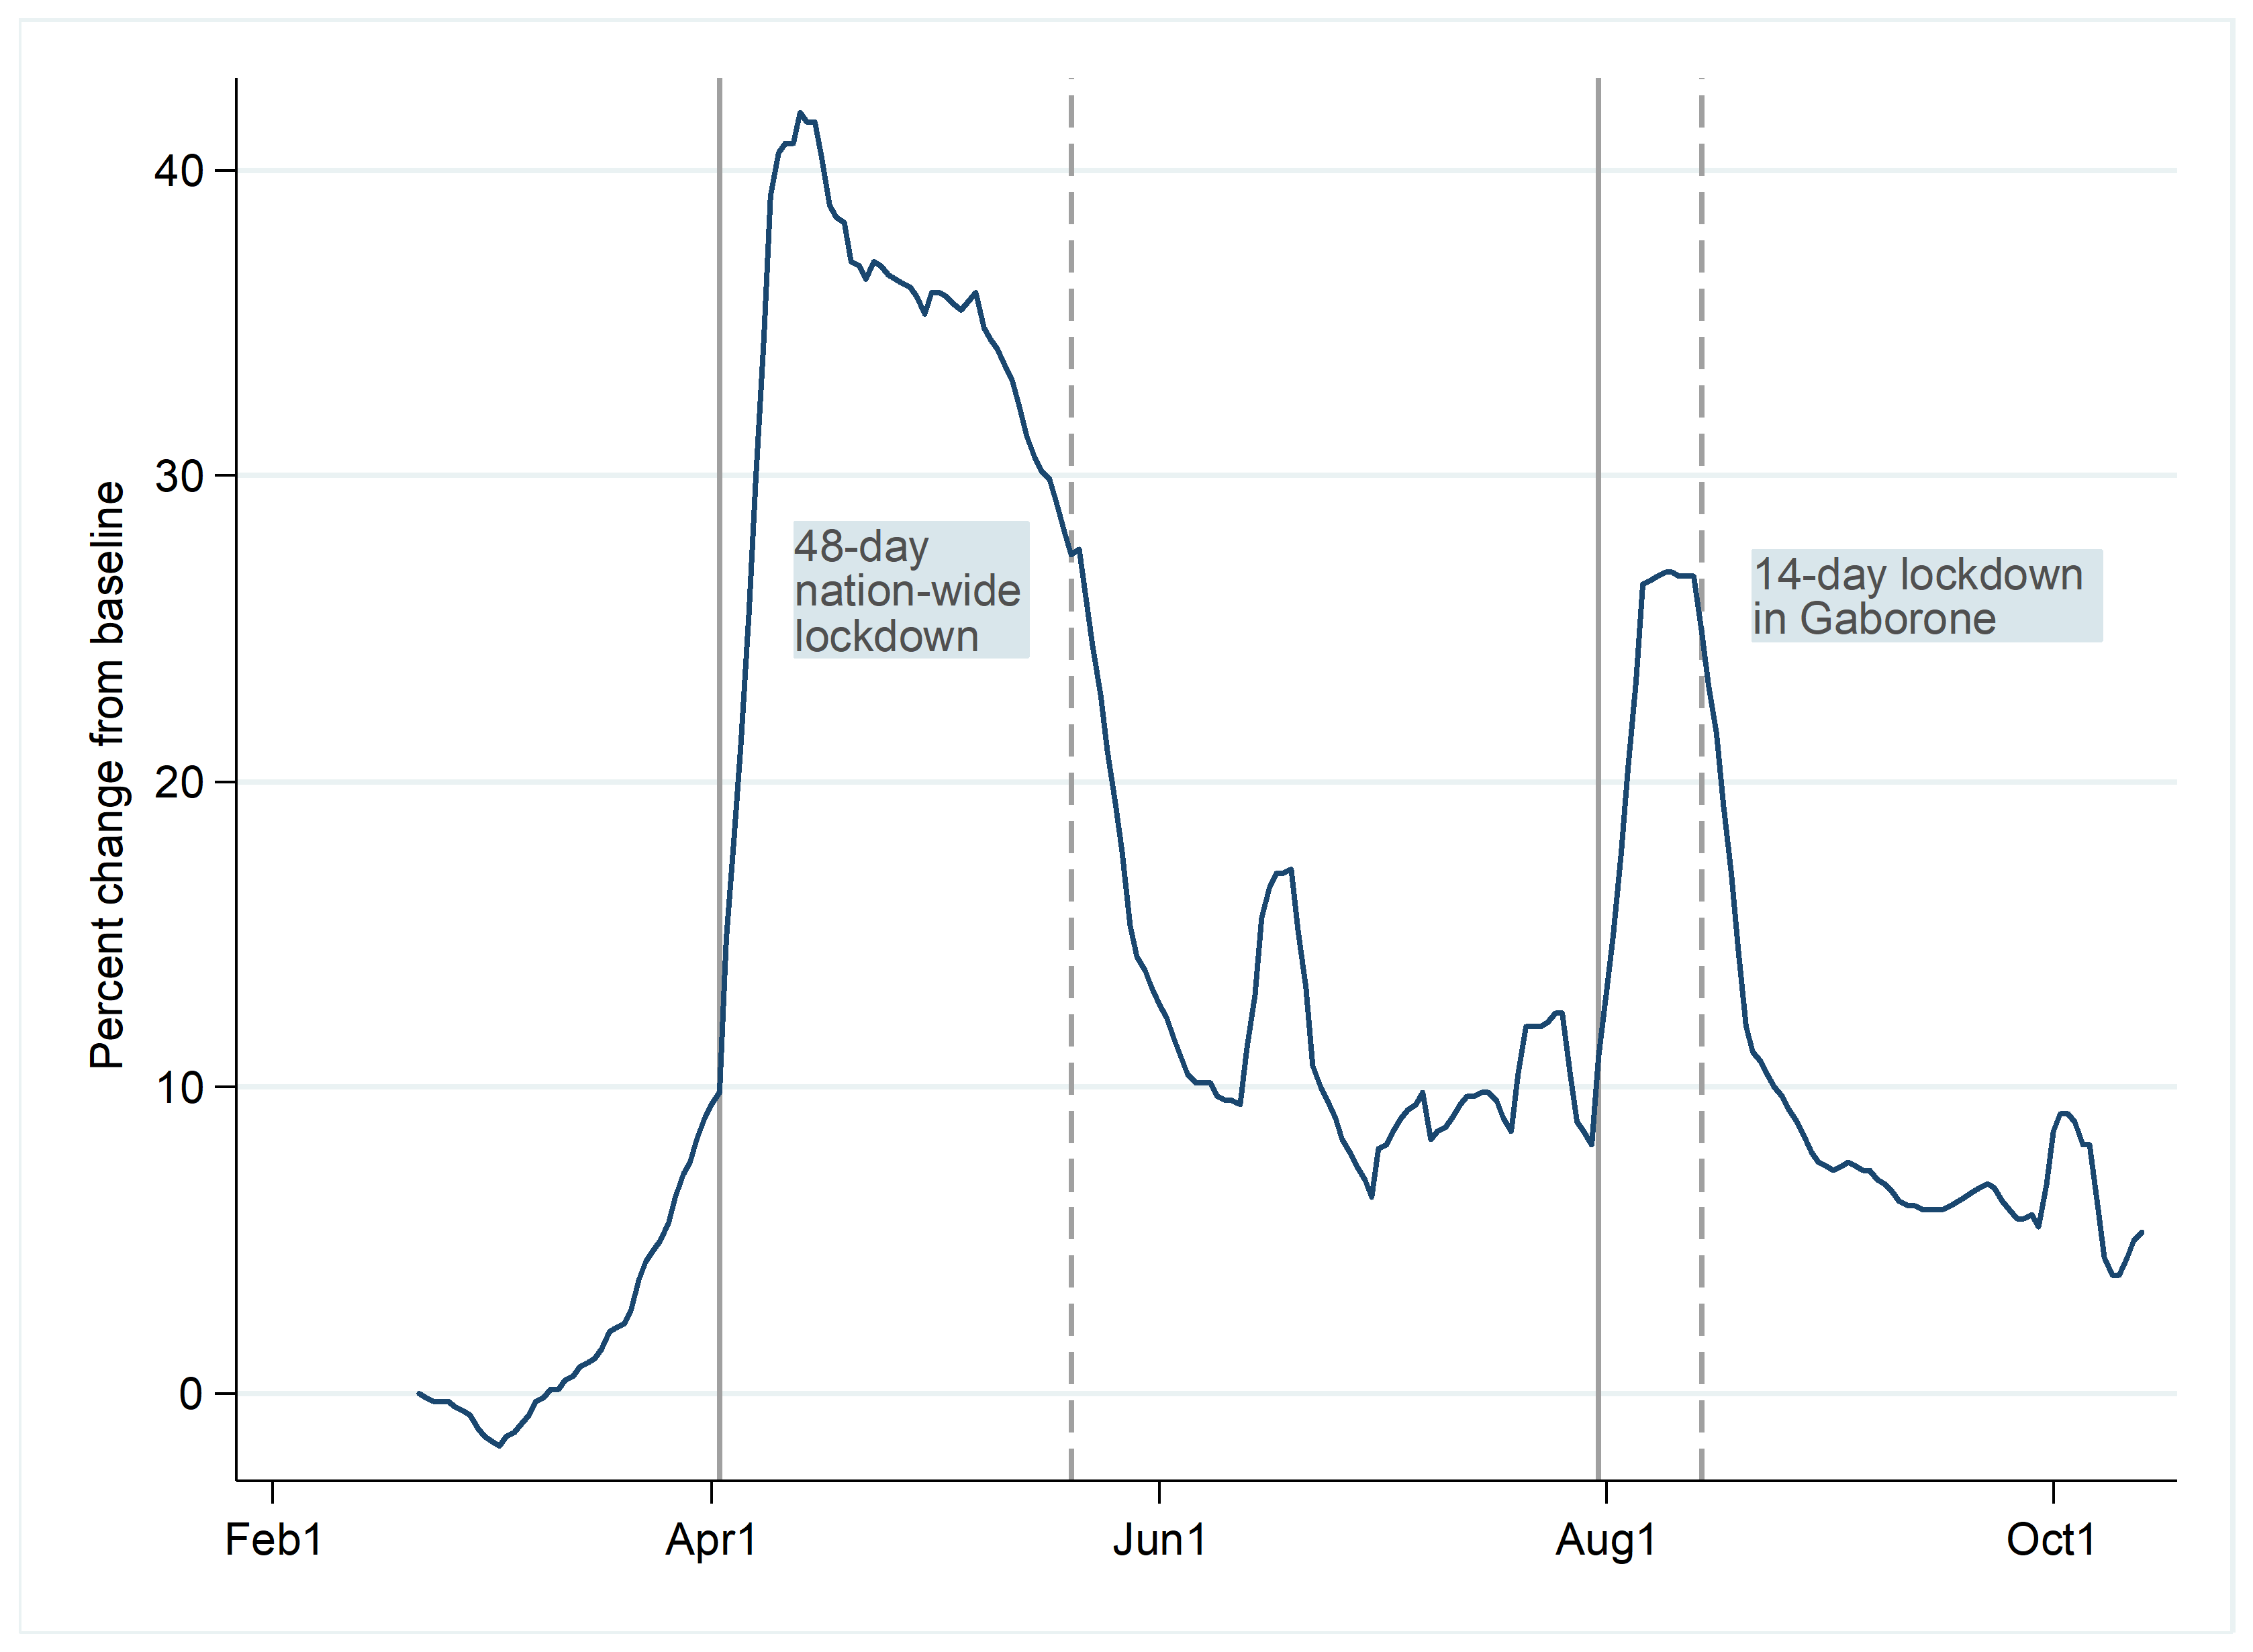
Source: Google COVID-19 Community Mobility Reports. The figure shows how visits and length of stay vary compared to a baseline value for that day of the week recorded in January and February. Values are smoothed using a seven-day moving average.
Significant changes to mobility patterns have occurred across the region. Figure 2 shows how the pandemic has altered different categories of movement in Côte d’Ivoire. Like Botswana, Côte d’Ivoire saw a sharp rise in residential mobility in April and May. Simultaneously, movement in retail, transit, and the workplace fell. Since then, however, movement in retail and transit has recovered to its pre-pandemic levels, while movement around places of work has remained around 10 percent lower. Notably, Côte d’Ivoire did not introduce a nationwide lockdown, which may be reflected by the lack of drastic changes in movement that characterizes the data for Botswana.
Figure 2. Community mobility by movement category, Côte d’Ivoire
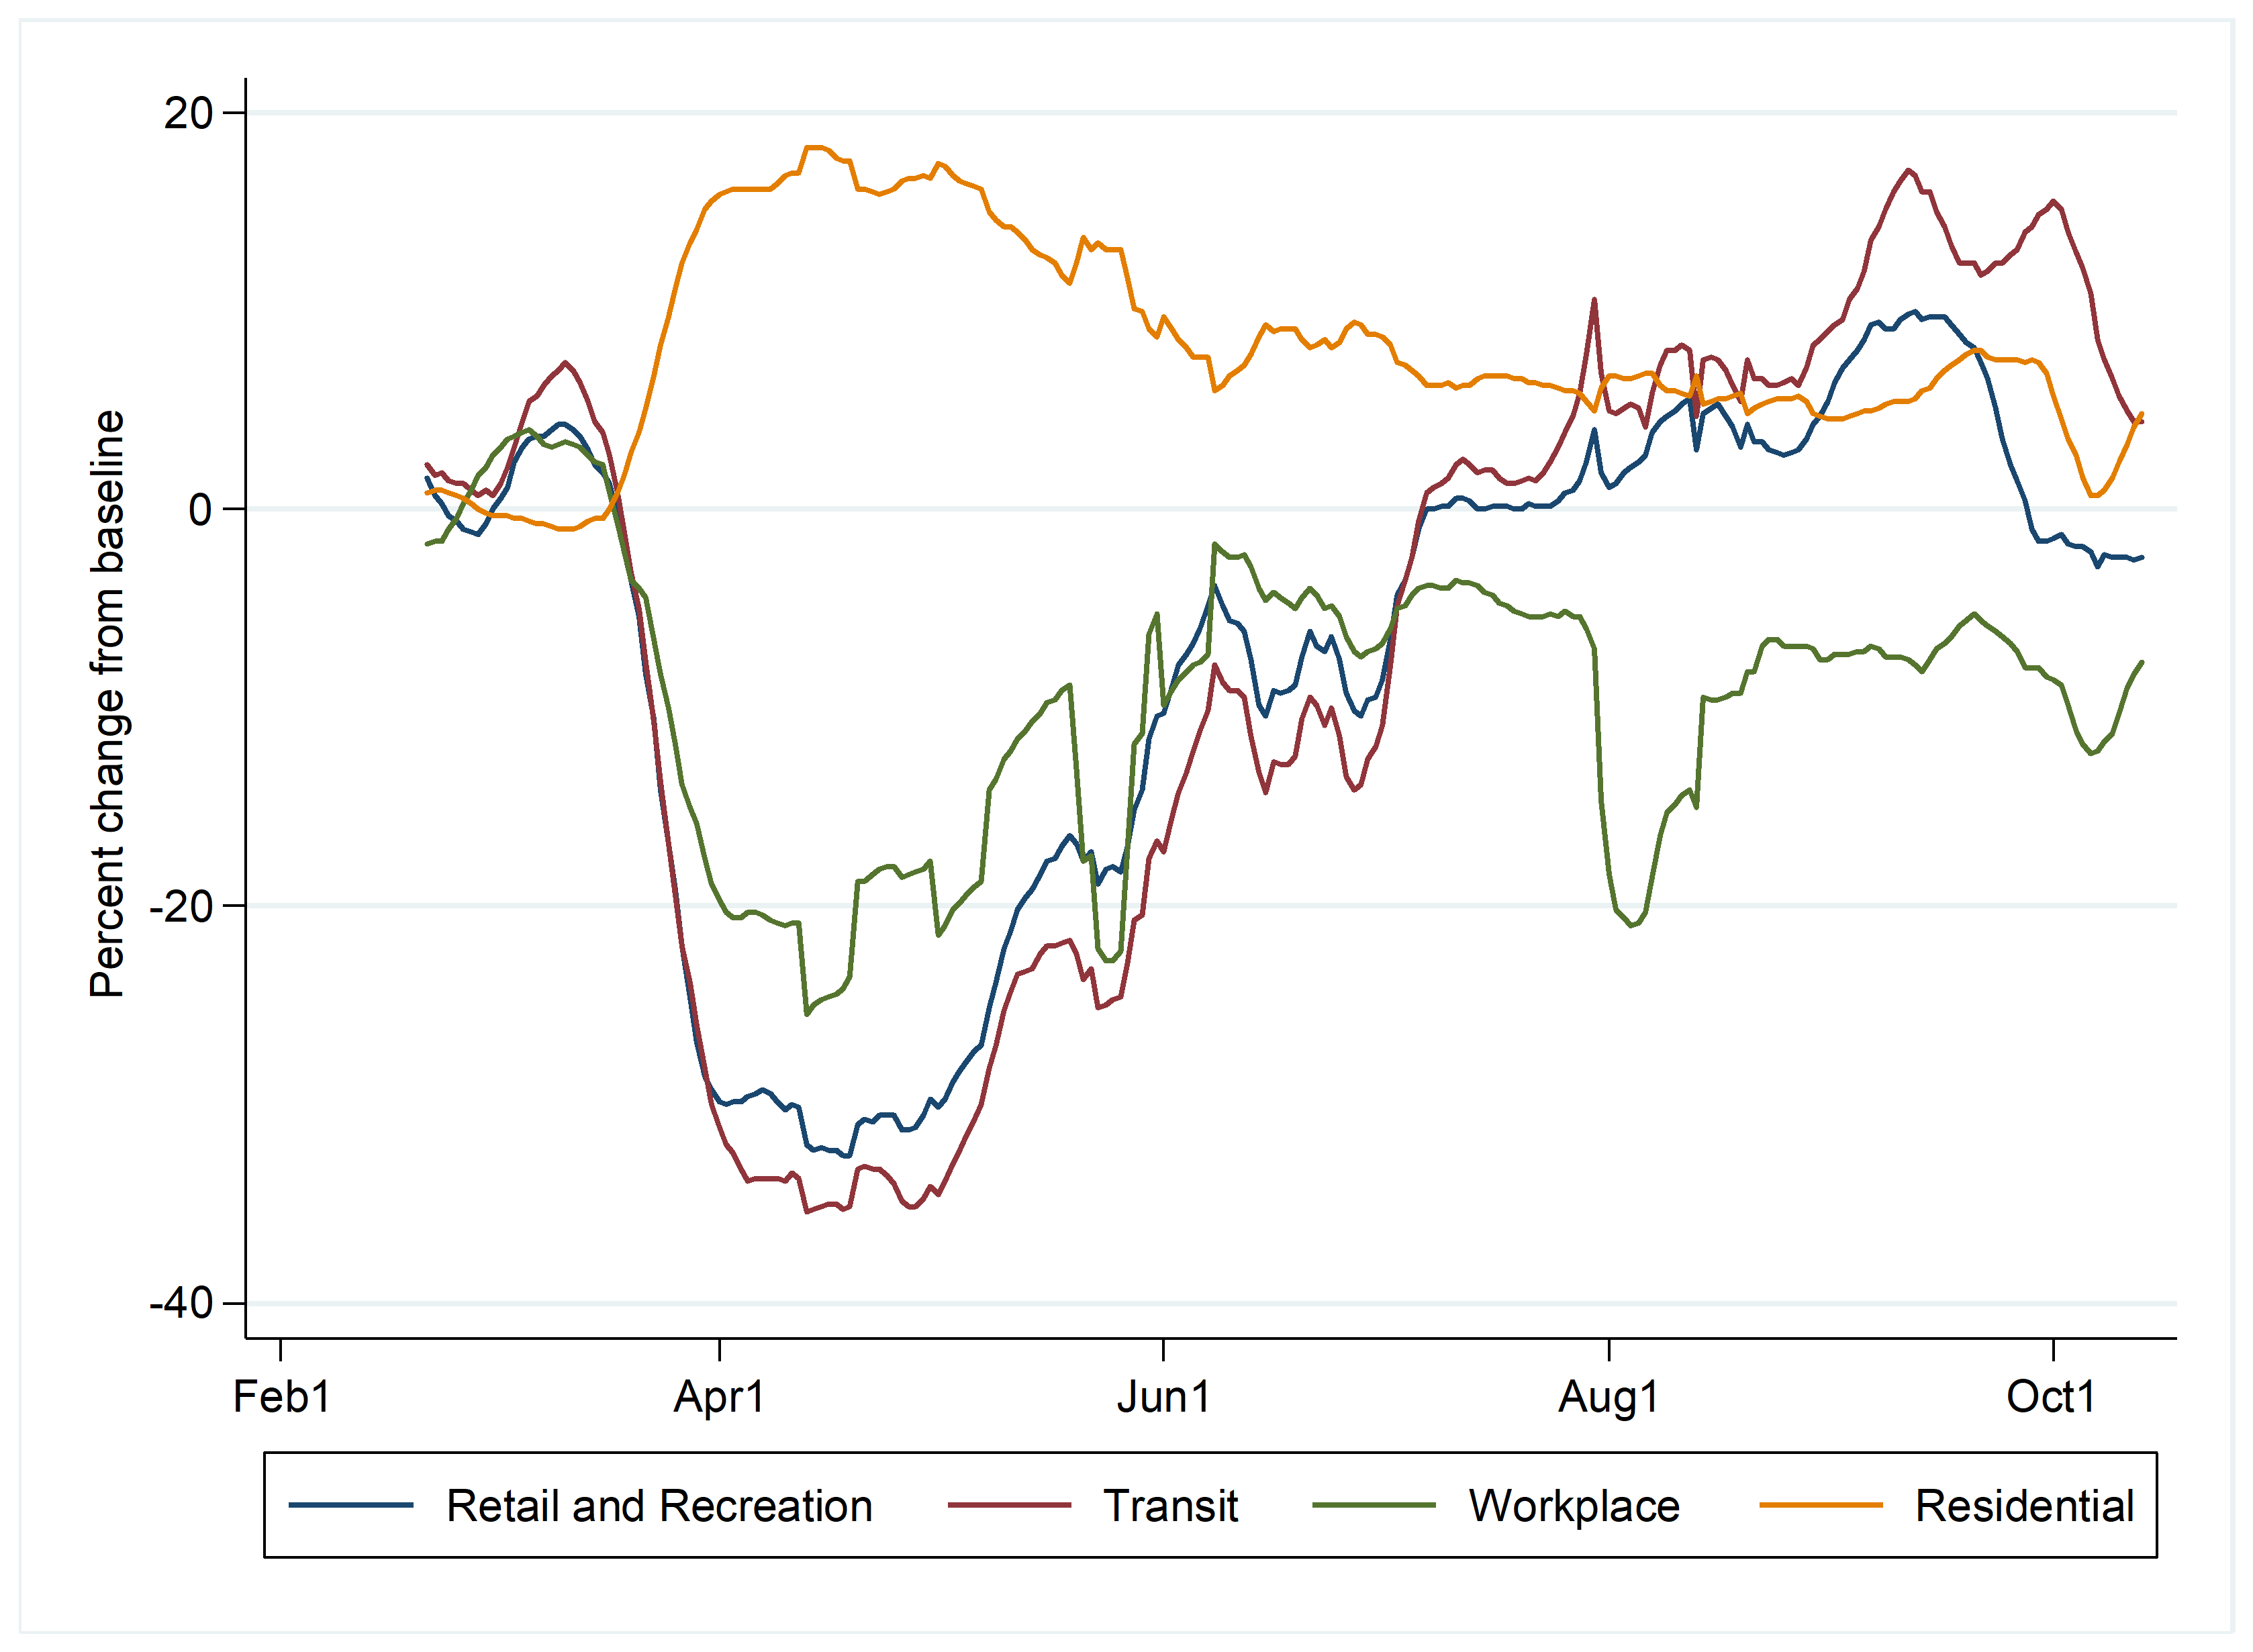
Source: Google COVID-19 Community Mobility Reports. The figure shows how visits and length of stay vary compared to a baseline value for that day of the week recorded in January and February. Values are smoothed using a seven-day moving average.
Because countries in the data differ dramatically in their climate, geography, and levels of urbanization, directly comparing the magnitude of changes in movement across countries is not possible. That said, it is possible to compare how trends in movement have varied across countries. Figure 3 shows that mobility patterns in the median country in the sample of sub-Saharan African countries examined differ when compared to that of the median country in the rest of the world. For instance, mobility in retail and recreation, grocery and pharmacy, and transit seems to have largely recovered in sub-Saharan Africa, whereas these levels in other regions remain below their baseline levels. Residential mobility and mobility in the workplace in both groups have not returned to pre-pandemic levels.
Figure 3. Community mobility by movement category, sub-Saharan Africa vs. world
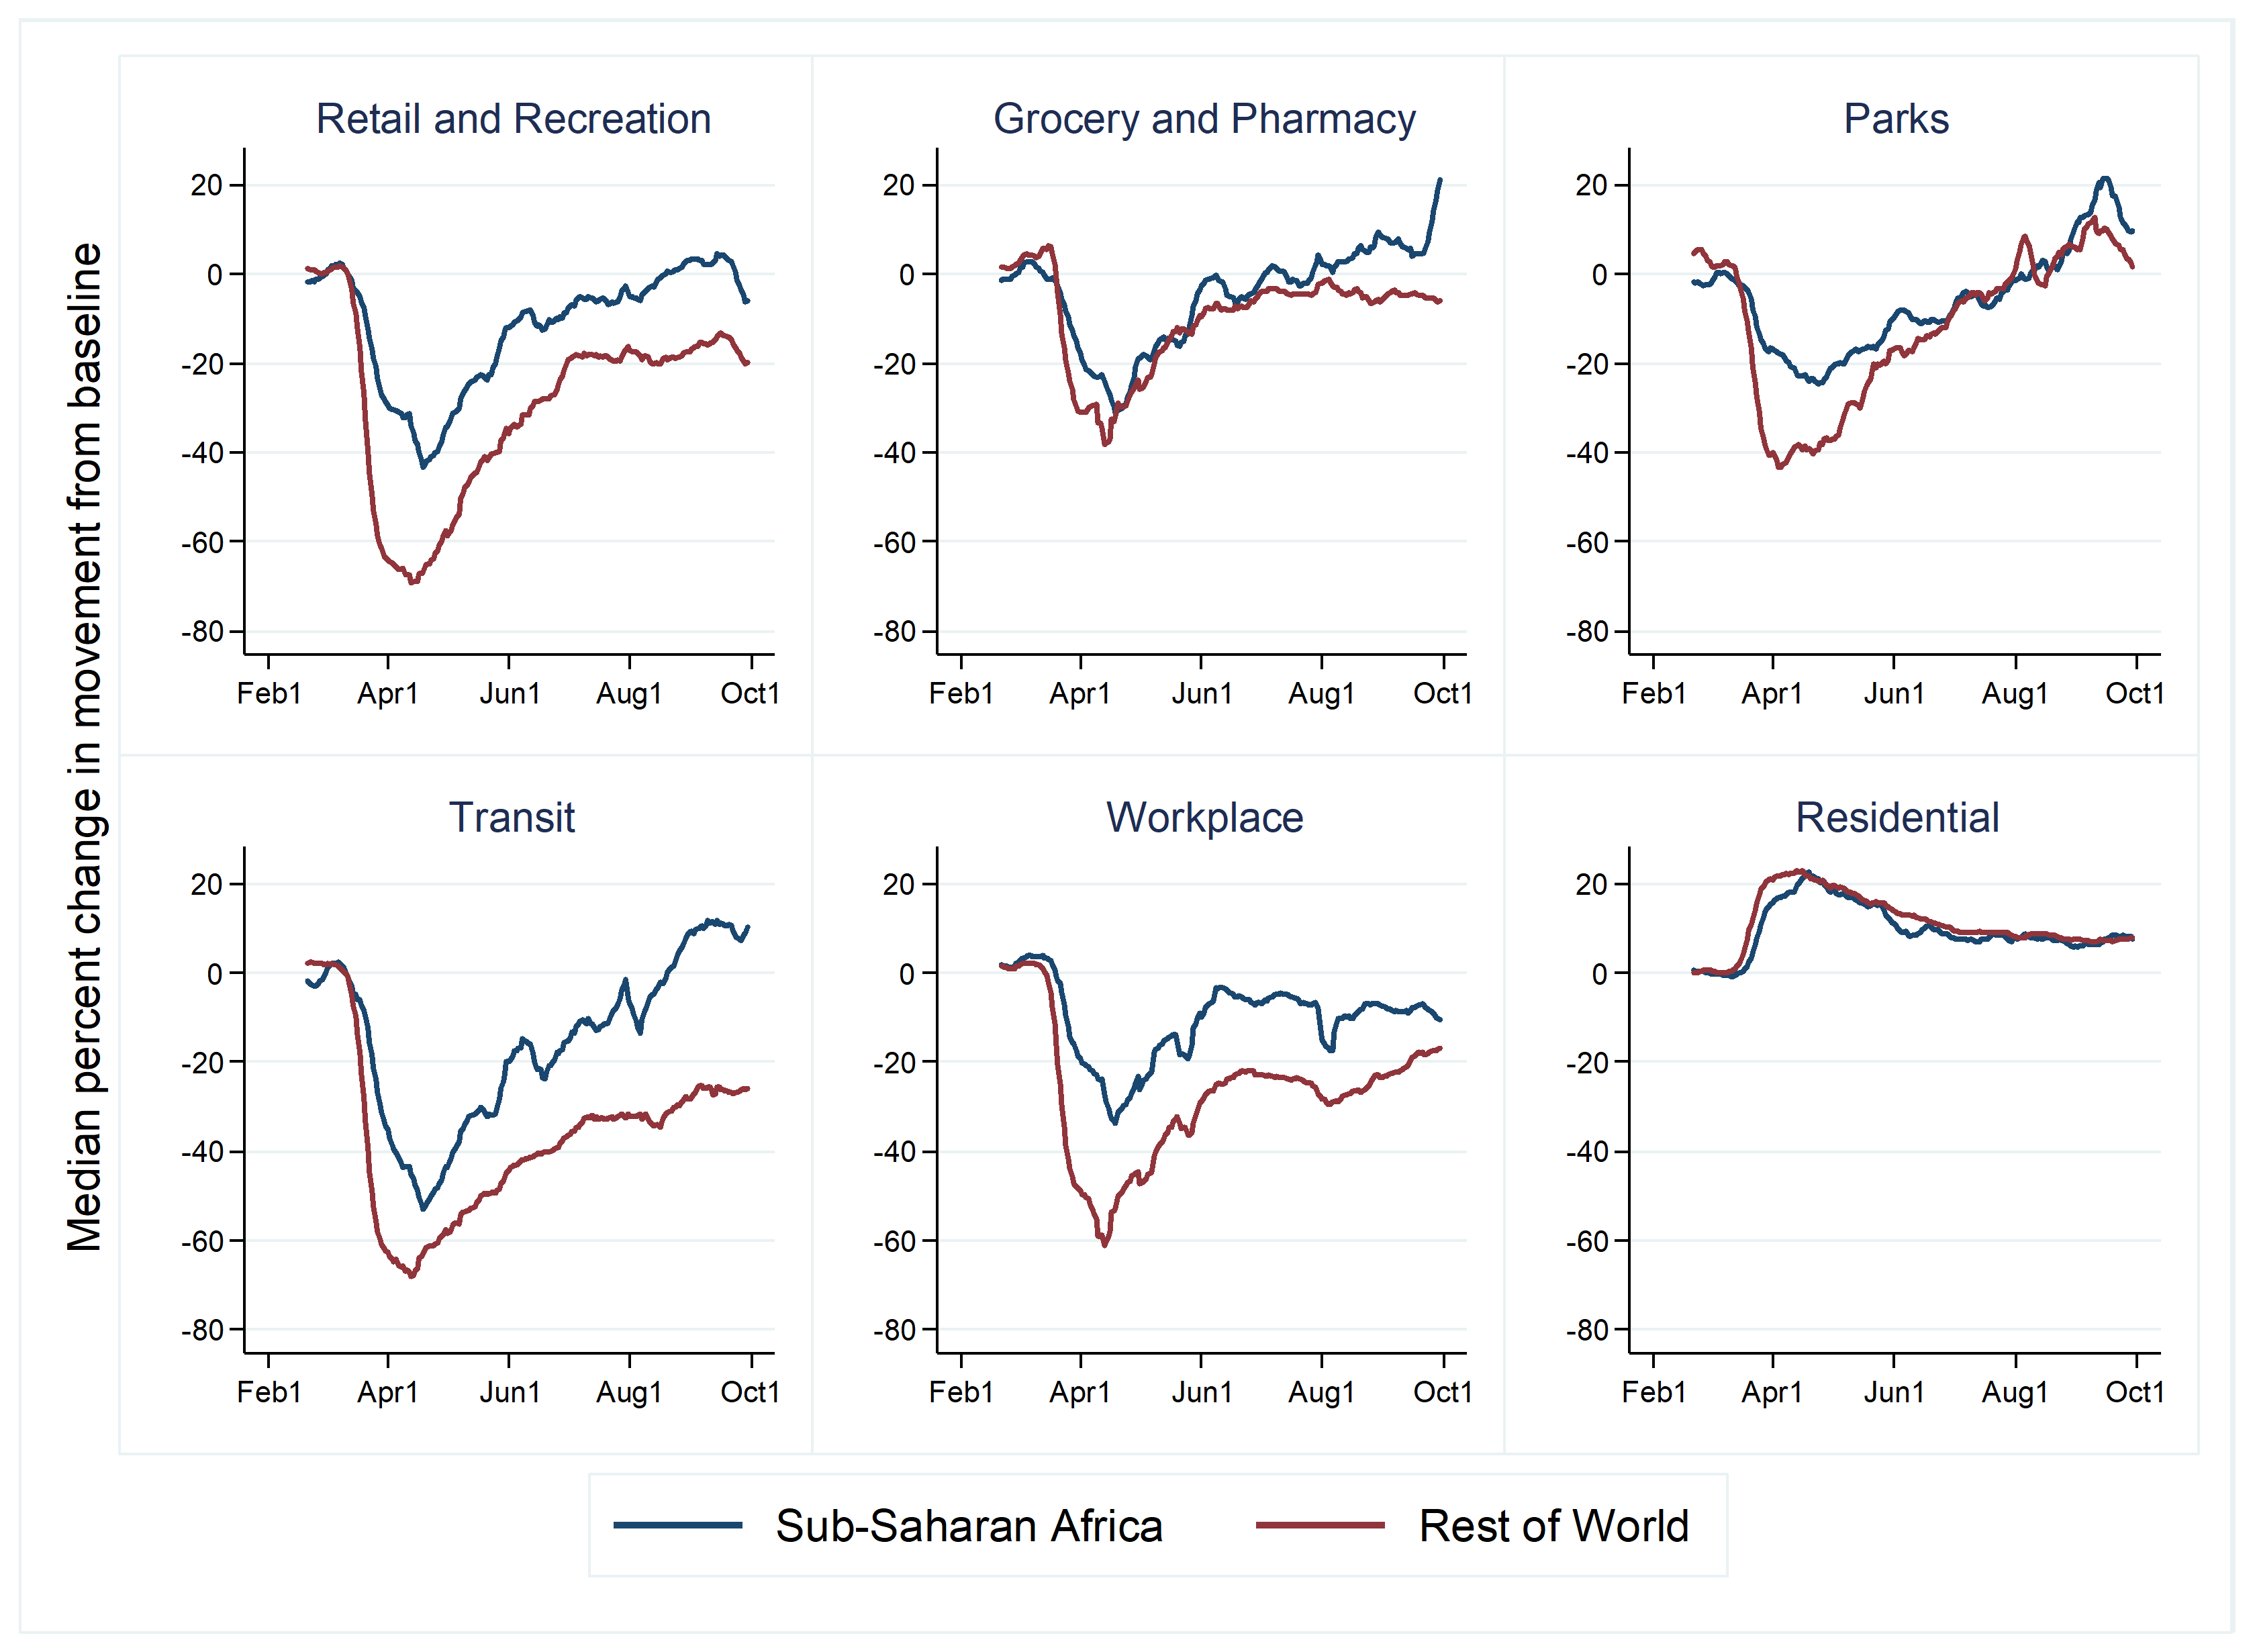
Source: Google COVID-19 Community Mobility Reports. The figure shows how visits and length of stay vary compared to a baseline value for that day of the week recorded in January and February. Values are smoothed using a seven-day moving average. The sub-Saharan Africa category contains eight countries: Angola, Benin, Botswana, Burkina Faso, Cameroon, Cape Verde, Côte d’Ivoire, and Gabon. The “rest of world” category contains data for 35 countries from all six continents and all four World Bank income groups.
Related Content

Authors


Commentary
Figures of the week: Mobility in some African countries has recovered to pre-pandemic levels
October 21, 2020