
The debate over test-optional college admissions has intensified recently, with arguments focusing on whether standardized tests or GPAs better predict college success. However, this framing can overlook the fact that GPA does not fully reflect a student’s true performance in high school. Some students take a heavy STEM focus with multiple AP sciences and advanced math. Others might excel in humanities, combining AP Literature with advanced foreign language study. Still, others might balance standard core requirements with career-technical courses or arts electives. The result is that no two transcripts are quite alike, making simple GPA comparisons inadequate for capturing student performance in high school and predicting whether they will succeed in college.
In new research, we develop a systematic approach to measuring the strength or rigor of a student’s high school transcript. Using student-level transcript data from Delaware—about 45,000 students across five 12th-grade cohorts from 2017 to 2021—we apply statistical tools to estimate both course difficulty and student performance. Our approach works by analyzing patterns of grades across shared courses. For example, imagine that Student 1 earns an A in Calculus and a B in Physics, while Student 2 earns a B in Calculus and a C in Physics. Our model would infer, first, that Physics is more difficult than Calculus and, second, that Student 1 outperformed Student 2 in those courses.
By examining these patterns across thousands of students and hundreds of courses, the model finds the combination of student performance and course difficulty estimates that best explains all observed grades. Even though no student takes every course, there is enough overlap in course-taking patterns for the model to place both students and courses on a common scale. This approach produces a measure we call transcript strength that captures how well students performed and the difficulty of their chosen courses.
Learning from high school transcript data
With this approach, we sought to learn: 1) what a student’s high school transcript strength teaches us (compared to GPA alone); 2) how well transcript strength predicts college attendance (compared to the SAT); and 3) what this measure reveals about educational inequality.
We believe that admissions officers already make informal judgments about transcript strength by considering both the courses that students select and their grades in those courses. For instance, admissions officers may account for differences in course offerings across high schools—giving more weight to a student taking the only AP course available at their school compared to taking one AP course at a school offering dozens. (Our measure does not make such distinctions because information about which courses are offered are not part of a transcript—only information about which courses a student took.)
Our aim is not to propose a specific, new measure to replace those informal judgments. In fact, we worry that any single measure could distort the behaviors it aims to measure, potentially exacerbating grade inflation or creating unintended strategic responses. Rather, we aim to better understand what novel information exists in transcripts, how this relates to college outcomes, and what it reveals about educational inequality.
Comparing transcript strength to raw GPA
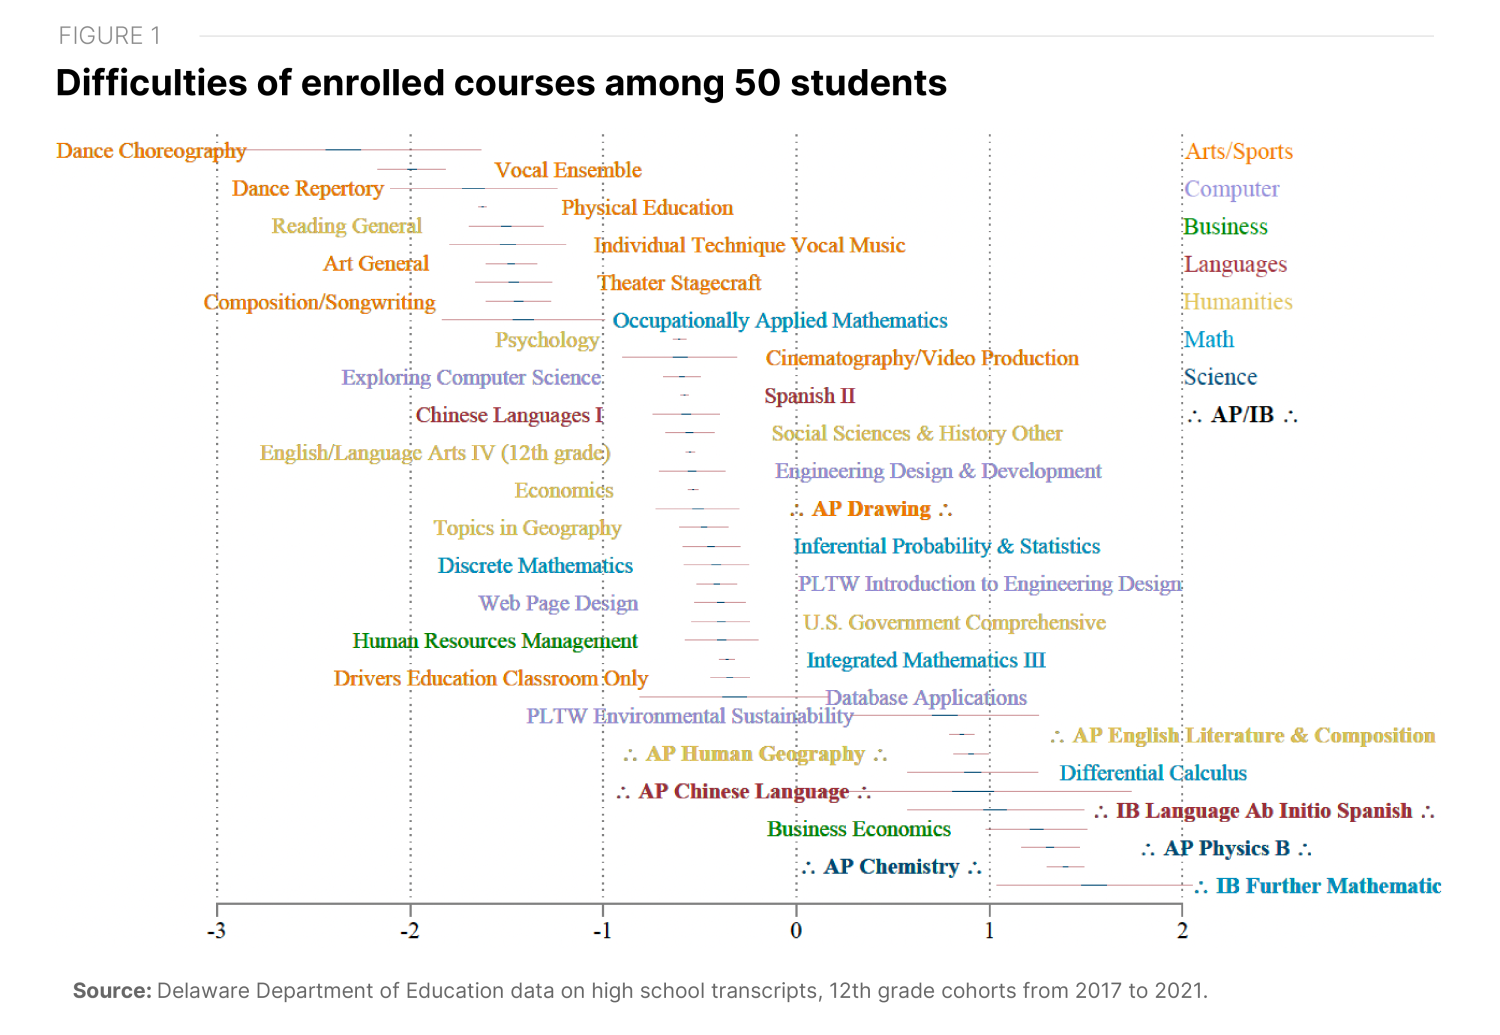
Our analysis reveals how GPA can mask meaningful differences in student course-taking patterns and performance. First, the model’s estimates of course difficulty align well with what you might guess. Figure 1 plots a selection of courses and their estimated difficulties—10 of the easiest, 20 from the middle, and 10 of the hardest. Arts and sports are the least difficult courses by this measure (clustered at the top), whereas AP and IB courses are the most difficult. In general, humanities courses are less difficult than math and science courses, though AP and IB humanities courses are among the most difficult. Though the overarching pattern is intuitive, the specific ordering is new and grounded in data.
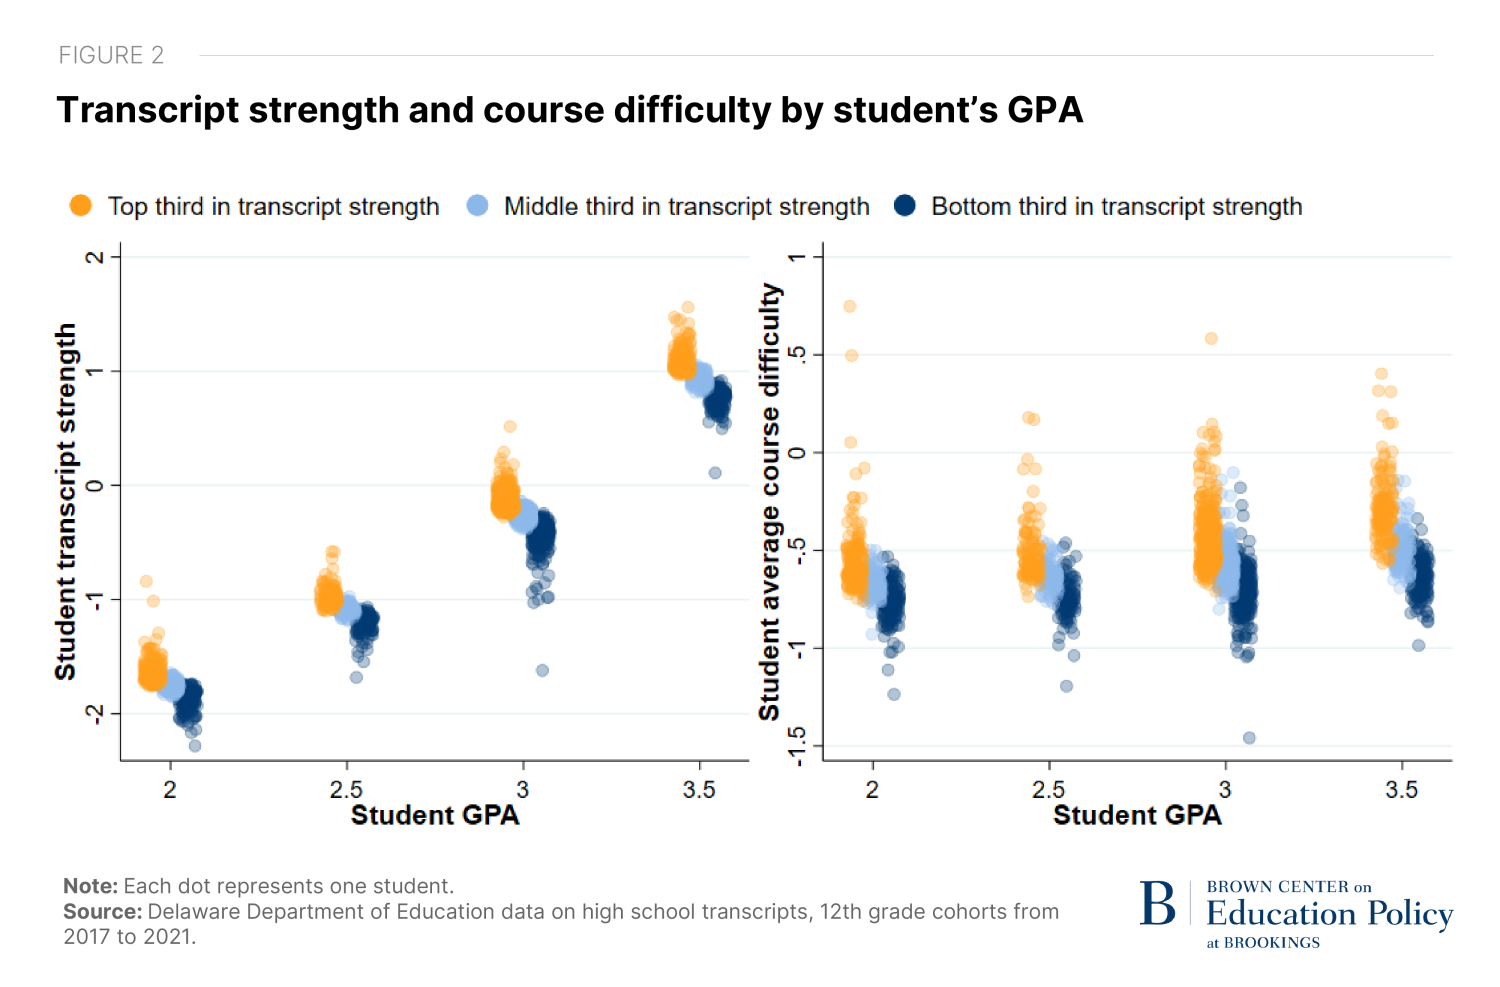
Having learned about course difficulty, we can now assess differences between students with the same GPA. For example, in Figure 2, we show that for students with the same GPA, there is substantial variation in students’ estimated transcript strength. Those students in goldenrod—in the top third of transcript strength for the same GPA—must have different course-taking patterns for the model to assign them a high score. That’s indeed what we see: When we then look at their average course difficulty, students with the same GPA but different transcript strengths are separated by the kinds of courses they take.
Put simply, the metric of transcript strength captures meaningful differences in course-selection patterns that GPA alone misses.
Predicting college attendance using transcript strength
Our measure of transcript strength reveals patterns in college attendance that neither GPA nor SAT scores alone capture. When we examine which students attend more selective colleges (both in terms of college tier as well as the average earnings of college graduates), we find that transcript strength is more predictive than either GPA or SAT scores. Moreover, this predictive power remains even after accounting for a student’s GPA. That is, among students with the same GPA, those with higher transcript strength are more likely to attend selective colleges.
Parsing the data slightly differently, we can compare students with different combinations of transcript strength and SAT scores. Students with low SAT scores but high transcript strength attend more selective colleges than their peers with high SAT scores but low transcript strength. This suggests that the course-taking patterns and performance captured in our transcript measure reflect where students ultimately attend college better than standardized test scores, further underscoring our hypothesis that some analogue of transcript strength is already effectively in use in the admissions process, albeit informally.
What transcript strength reveals about educational inequality
Our analysis also reveals striking differences in educational inequality depending on whether we use transcript strength or SAT scores. Hispanic-white and Black-white gaps in transcript strength are substantially smaller than SAT scores. Hispanic-white gaps, especially, are about half as large in the transcript metric as compared to the SAT metric. This pattern suggests that minoritized students, relative to white students, perform better on average in their coursework compared to the SAT.
The most notable contrast concerns gender differences. While male and female students in our sample show almost no differences in average SAT performance, we find large gaps in transcript strength favoring female students. In fact, the male-female gap in transcript strength is even larger than the Hispanic-white gap using the same measure. This gender pattern in transcript strength reflects systematic differences in course-taking and performance that standardized tests do not capture.
Transcript strength and education policy
High school transcripts contain meaningful information beyond GPA. Students with the same GPA take markedly different paths through high school, and these differences predict which colleges they attend. We have also shown that measuring performance through transcripts rather than standardized tests reveals different patterns of educational inequality, particularly for gender and racial/ethnic gaps.
An important limitation of our study is that we cannot yet assess how well transcript strength predicts actual college success compared to GPA or SAT scores. Further, our approach needs further development to account for how students concentrate in different content areas (e.g., STEM vs humanities), variations in grading standards across schools, and differences in course offerings between schools.
Still, these findings suggest several considerations for education policy. The substantial variation in course-taking patterns raises questions about equitable access to advanced coursework, particularly given that course selection significantly predicts college outcomes. Additionally, our results showing different inequality patterns between transcript-based and test-based measures suggest that state education agencies might gain new insights about educational opportunity gaps by examining transcript data more systematically.
Related Content


Authors


The Brookings Institution is committed to quality, independence, and impact.
We are supported by a diverse array of funders. In line with our values and policies, each Brookings publication represents the sole views of its author(s).