The unemployment numbers for January were in line with last month’s forecast: The labor market keeps improving, and the January uptick only reflected the inertial dynamics of unemployment. With a slow but steady improvement in hiring, I project a slow but steady decline in the unemployment rate over the next six months, with a jobless rate of 7.8% in February going down to 7.4% by September 2013. The caveat on the projection is that there be no additional damage to the labor market (e.g., from large arbitrary spending cuts).
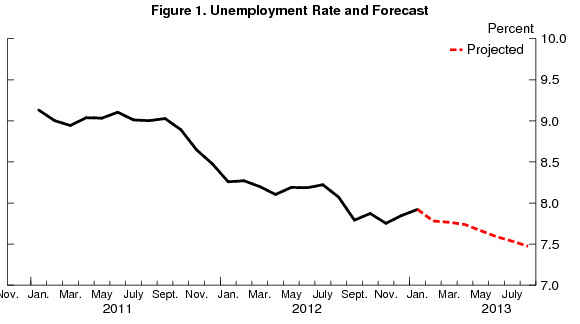
This post discusses my monthly update of the Barnichon-Nekarda model. For an introduction to the basic concepts used in this post, read my introductory post (Full details are available here.)
The January uptick in unemployment was expected (see last month forecast in Table 1 and my post here) and is no cause for worry, because it simply reflected the normal dynamics of unemployment. The intuition for that uptick can be understood by looking at the behavior of the “steady-state” unemployment rate. The steady-state unemployment rate, the rate of unemployment implied by the underlying labor force flows—the blue line in figure 5—hovered around 8 percent in the past couple months and was above the actual unemployment rate. This is mostly because workers’ job finding rates (i.e, hiring) declined sharply in November (probably reflecting the effect of Hurricane Sandy) and because worker’s separation rate (layoffs) increased sharply in November (probably also related to Sandy). Our research shows that the actual unemployment rate converges toward the steady state unemployment rate, and this convergence process generates some inertia in the behavior of unemployment. At December’s level of 7.8 percent (Table 1), the unemployment rate was slightly above its steady-state rate, which pushed up the unemployment rate up in January. In other words, the January uptick is simply a late effect of Hurricane Sandy.
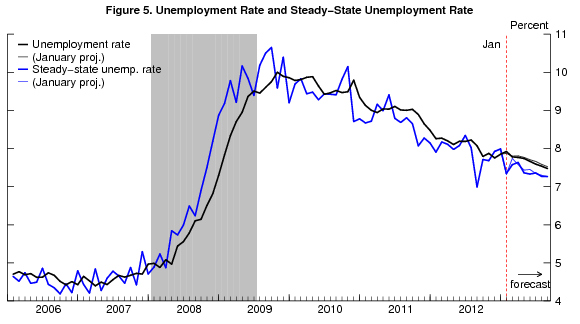
Looking forward, the current value of steady-state unemployment rate is now significantly lower (at 7.4%), and the “steady-state convergence dynamic” is now pushing the unemployment rate down. With a projected steady-state unemployment rate at 7.2 percent in September 2013, I project the unemployment rate to slowly decrease over the coming months and to reach 7.4 percent in September.
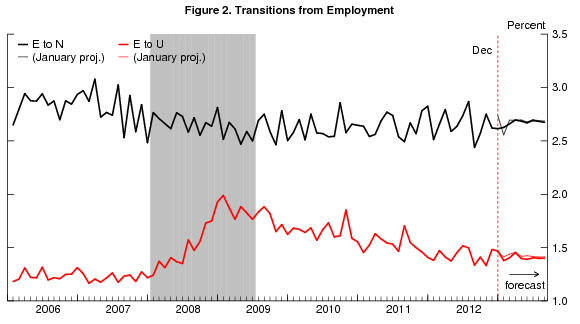
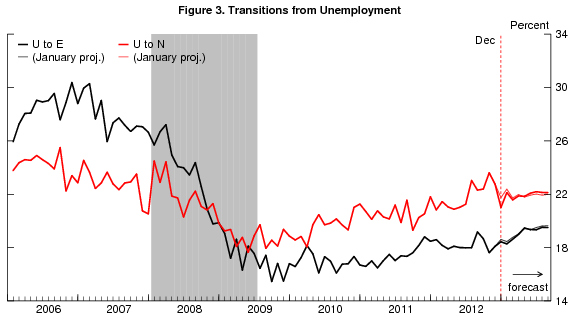
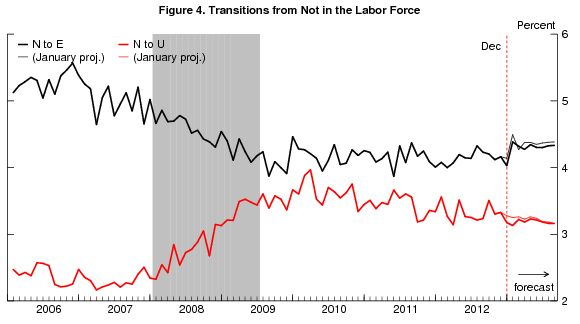
More precisely, the model propagates forward its best estimate for how the flows between employment, unemployment and out-of-the labor force will evolve over time, and constructs the implications for the unemployment rate. In January, job openings increased, and new claims for unemployment insurance continued their decline. Consequently, the model now projects sizable improvements in workers’ job finding rates (figure 3) over the next 6 months, and the outlook for the job separation rate (or layoffs) is improving (albeit, very slowly, figure 2). As a result, the steady-state unemployment rate is now projected to decline to 7.2% by September 2013, bringing the unemployment rate down with it.

To read more about the underlying model and the evidence that it outperforms other unemployment rate forecasts, see Barnichon and Nekarda (2012).


Commentary
Unemployment Projected To Decline To 7.8 Percent In February
February 27, 2013