Introduction
Until the One Big Beautiful Bill Act (OBBBA), the federal government alone was responsible for paying for Supplemental Nutrition Assistance Program (SNAP) benefits. Under OBBBA, starting in October 2027, states potentially will be required to pay a share of SNAP benefits, with the required share determined solely by the state’s “payment error rate” for the relevant fiscal year. After the first year, a state’s payment error rate from three years prior will determine the state’s cost shift, meaning that a state’s FY2026 payment error rate will be the basis for the FY2029 cost-shift amount.
We have examined the harms that will result from OBBBA ending the guarantee of full federal funding for SNAP benefits. As we, the Congressional Budget Office, governors, officials in states like Alabama and Arizona, and other analysts have concluded, the state cost shift will likely lead some states to exit SNAP altogether while other states will restrict eligibility, cut benefits, or make it harder for eligible residents to enroll in SNAP. Because of balanced budget laws, declining revenue, and other factors, this policy also makes it more likely that states will restrict access or drop out of the program when an economic downturn occurs and need increases, leaving Americans without adequate food assistance, sharply increasing poverty and hardship, and deepening the downturn.
In this analysis, we focus on characterizing the statistical shortcomings of SNAP payment error rates, which each year will solely determine whether and how much a state must pay for SNAP benefits. The SNAP payment error rate is a measure of how accurately states make eligibility and benefit determinations for participating households. If there is a payment error among eligible households, defined as a benefit overpayment or underpayment in excess of $58 in FY2026, the difference between the erroneous payment and the correct payment counts toward the error rate. In some cases, a procedural error that awarded benefits to an otherwise eligible family can result in their entire benefit allotment being counted as error. The opposite does not hold: Wrongly rejecting benefits for an eligible applicant is not considered an error. The payment error rate is calculated as the sum of all over- and under-payments to participating households divided by all payments.
Our focal analysis characterizes FY2023 payment error rates and shows that the penalty tier assigned to a state is substantially a product of statistical chance.
An analogy to public opinion polling may be helpful, as every poll reports its findings along with an assessment of its statistical uncertainty. When a pollster reports likely voter support as “48 percent with a margin of error of ±3 points at a 95 percent confidence level,” the interval—45 to 51 percent—is the pollster’s way of saying: “We only talked to a sample. If we drew 20 fresh samples the same way, we would expect about 19 of them to land somewhere in this range.” The statistical uncertainty is not a mistake; it is the unavoidable price of not interviewing every voter. And if candidate A is at 48 percent ±3 while candidate B is at 46 percent ±3, one doesn’t declare a likely winner because the race is a statistical tie.
The SNAP payment error rate is estimated the same way and comes with the same kind of statistical uncertainty. States review a statistical sample of cases, and the U.S. Department of Agriculture (USDA) then calculates the official rate based on the state review findings and its own re-review of a subsample of those cases. USDA’s Quality Control Annual Report publishes each state’s payment error rate together with its standard error and computes a 95 perfect confidence interval as the payment error rate ±1.96 × standard error—the same formula a pollster uses.
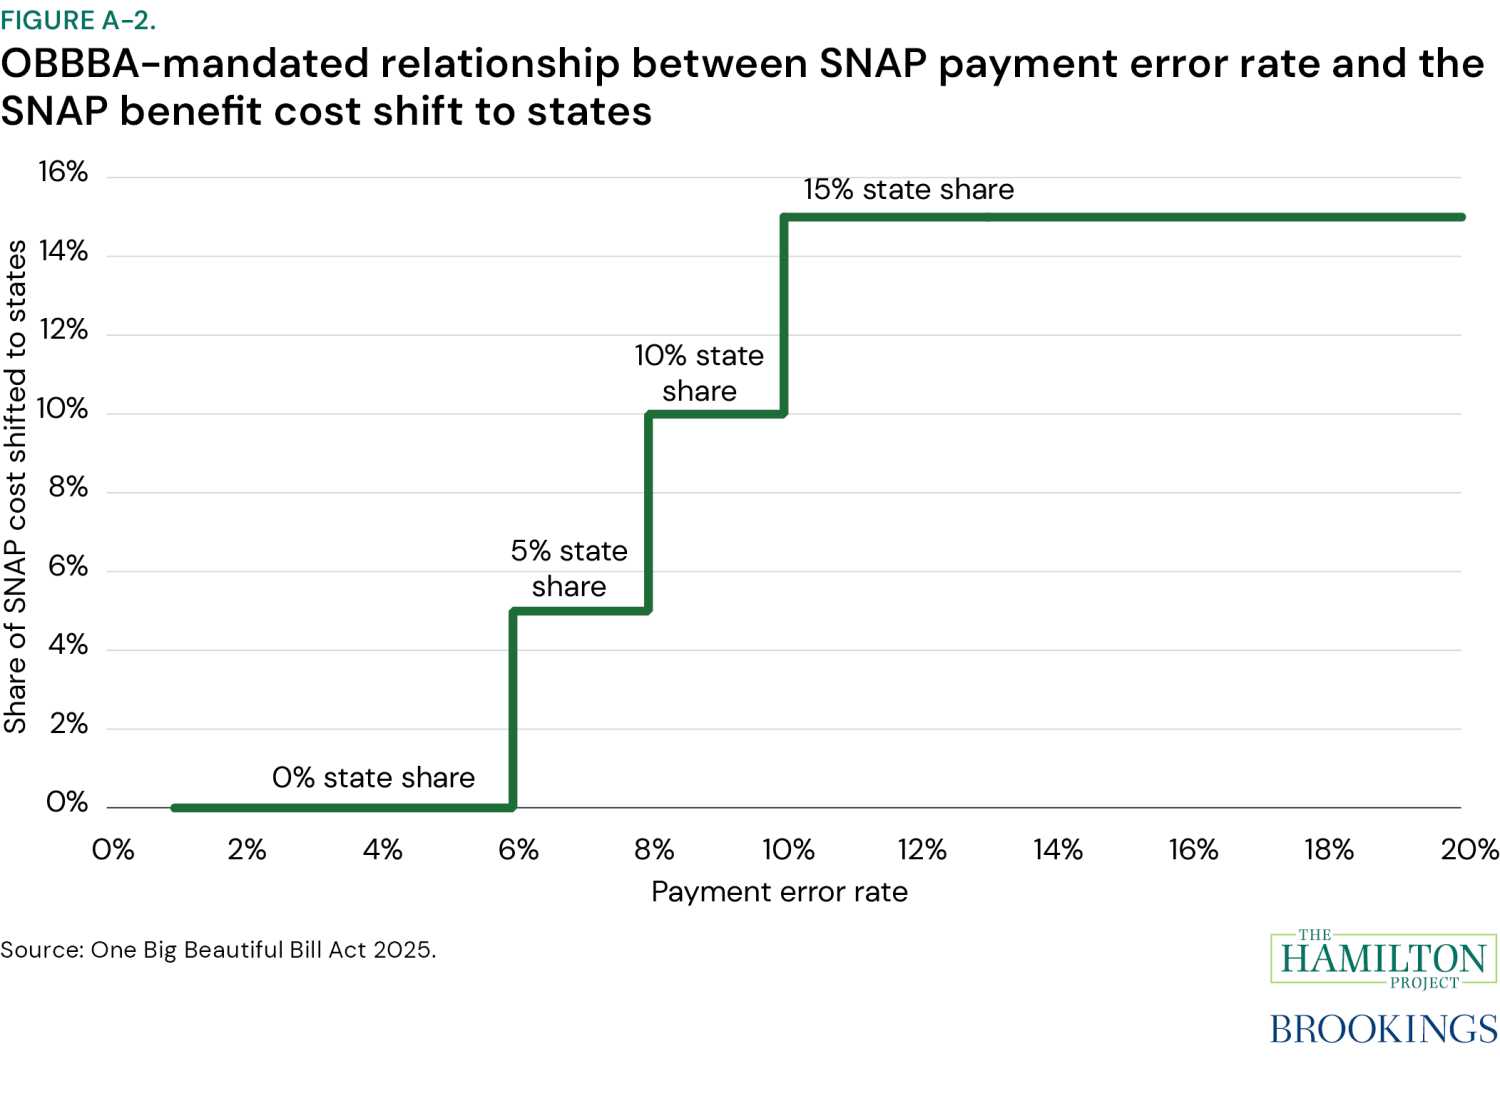
The problem we identify in this analysis is that the uncertainty in the payment error rate is large relative to the size of the cost-shift bins: The confidence intervals are wider than most of the bins themselves. The average standard error on a state’s annual payment error rate is about 1.1 percentage points, meaning a typical 95 percent confidence interval spans roughly 4.4 percentage points. In Alaska, the standard error is 3.9 percentage points, so its 95 percent confidence interval spans roughly 15 points. Compare that to the 2-percentage-point bins now used to set state cost-shares: Zero percent of benefits if the error rate is below 6 percent, 5 percent if it is between 6 and 7.99 percent, 10 percent if it is between 8 and 9.99 percent, and 15 percent if it 10 percent or higher (after an implementation delay for states with errors of 13.33 percent or higher in FY2025 or FY2026).
A state whose point estimate (the “point estimate” is the statistical term for the payment error rate number) lands at 8.5 percent cannot, in a statistical sense, be reliably distinguished from a state at 7.1 percent or 10.9 percent—yet the state landing at 8.5 percent would owe twice as much as the state landing at 7.1 percent. Sorting states into high-stakes penalty tiers on the basis of a single estimate treats a noisy measurement as if it were not, with hundreds of millions of state dollars on the line.
Many federal funding allocations rely on statistics computed from survey samples such as the American Community Survey. What makes SNAP different is that the sample used to estimate each state’s payment error rate is quite small, the resulting uncertainty is large relative to the width of the cost-shift bins, and the fiscal impacts for states of small changes in payment error rates are also quite large. As a result, random chance will substantially contribute to determining what a state will be required to pay in SNAP benefits starting in October 2027.
USDA’s existing quality control regime already recognizes this uncertainty. Since 2002, the payment error rate has been used to subject states to corrective action and to levy financial penalties, but those penalties have been based on the statistical lower bound of the payment error rate confidence interval, not the point estimate: A state could be sanctioned only if, for two consecutive years, the lower bound of its confidence interval exceeded 105 percent of the national payment error rate. The previously existing policy regime, which remains in place, accounts for uncertainty in payment error rate estimates. The new high-stakes state cost-shift policy does not.
Because random chance is a substantial factor in producing a state’s payment error rate in any single year, it is also true across time: The cost shift to states will fluctuate unpredictably and considerably from year to year based on random chance alone. We find that changes in payment error rates are not at all persistent across years and are more likely to reflect differences in a state’s luck of the draw in the quality control sample than changes in program administration. Consequently—and consequentially—we find that there is no guarantee that good-faith efforts to improve program administration will be reflected in the form of a lower payment error rate. A policy that could cause states to drop out of the SNAP program entirely should not be left to chance; instead, the federal government should continue to fully fund SNAP benefits.
OBBBA, shifting costs to states, and the SNAP payment error rate point estimate
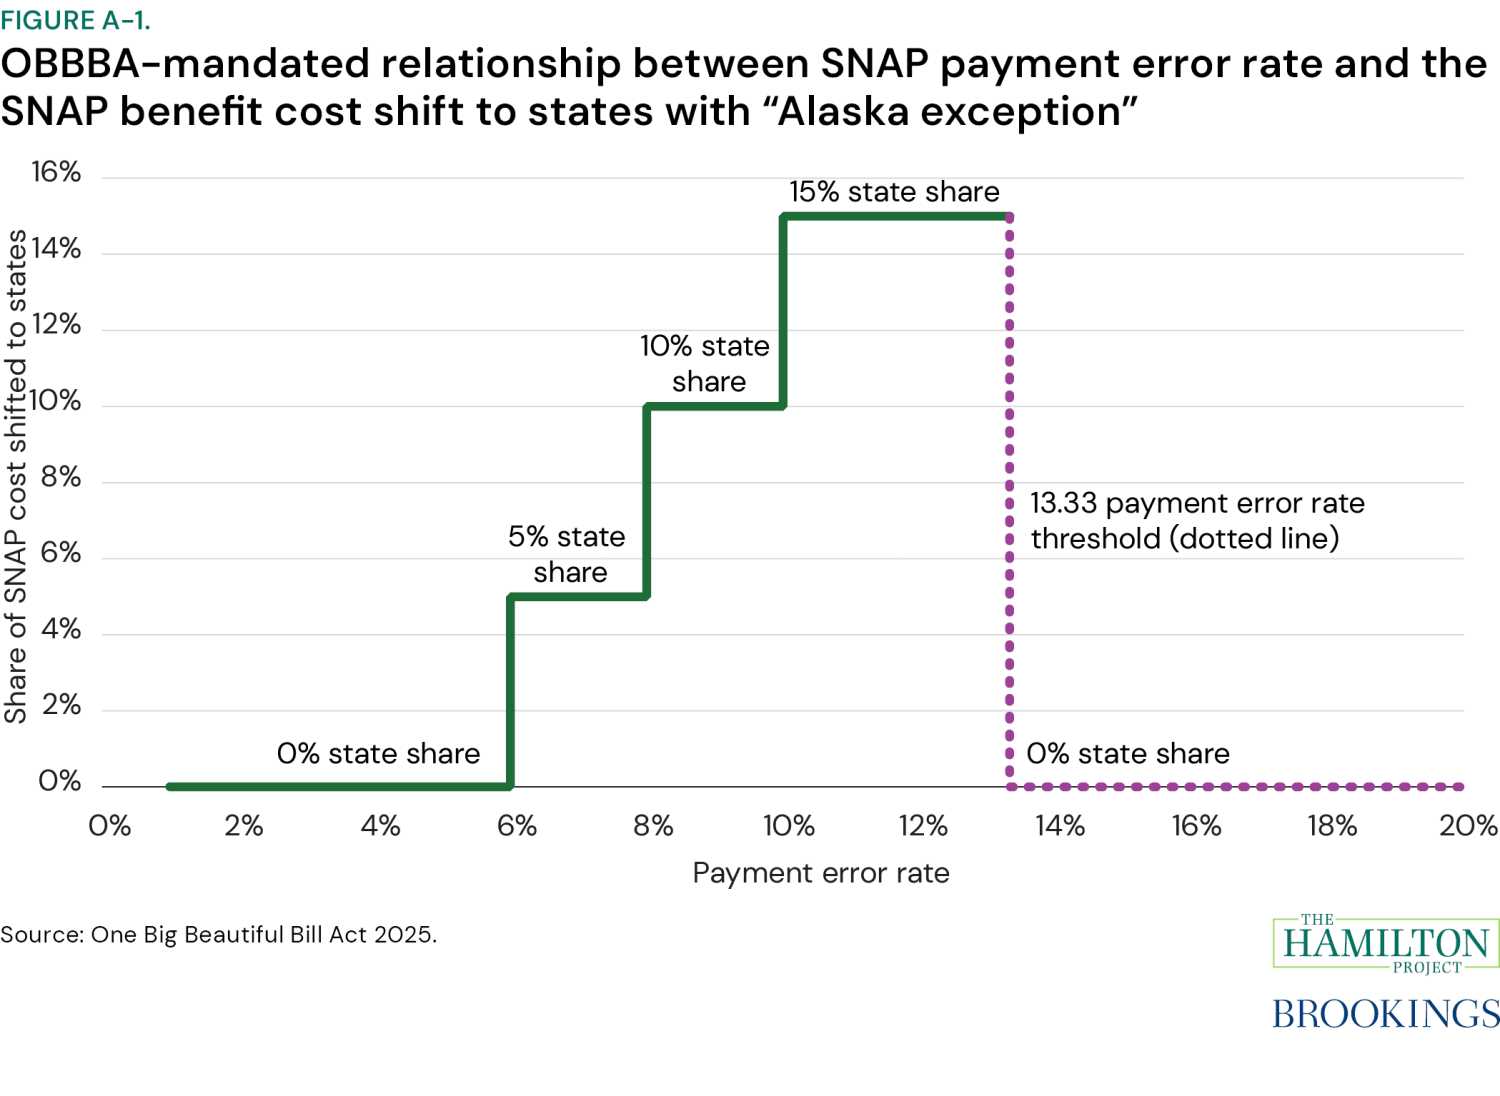
For the first time in program history, OBBBA requires states to pay part of SNAP benefit costs. The share charged to a state each year is tied to the state’s estimated SNAP payment error rate alone. Table 1 summarizes the relationship between a state’s estimated payment error rate point estimate and the share of SNAP benefits that a state will have to pay. (Appendix figure 1 visualizes the payment schedule.) A state will be required to pay a portion of SNAP benefit costs if the state’s estimated SNAP payment error rate exceeds 6 percent, with the state’s portion rising as the payment error rate increases from there until it hits a maximum when the state’s payment error rate exceeds 10 percent. There is a temporary exception in the first two years of implementation, however, during which time states with SNAP payment error rate point estimates of 13.33 percent or higher will not be required to contribute payment. This delay for states with especially high error rates is sometimes referred to as the “Alaska carveout.” Beginning in FY2030, all states with payment error rates above 10 percent will have to pay 15 percent of benefit costs.
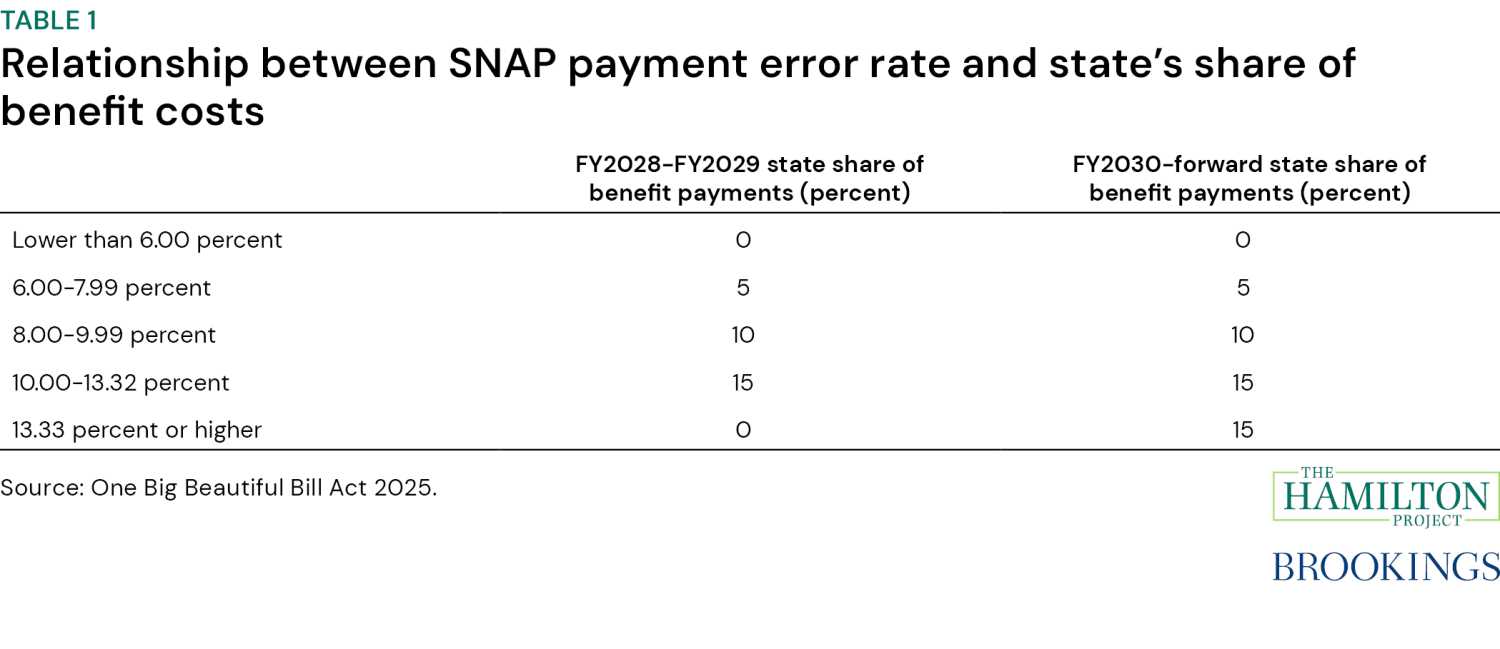
Figure 1 shows FY2022–25 payment error rates (PER) by state and year, with that year’s payment bin color coded as:
- Lime green: less than 6 percent PER, no cost shift to states;
- Dark green: PER 13.33 percent or greater, no cost shift to states;
- Purple: 6–7.99 percent PER, 5 percent of benefits cost shift to states;
- Orange: 8–9.99 percent PER, 10 percent of benefits cost shift to states; and,
- Blue: 10–13.32 percent PER, 15 percent of benefits cost shift to states.
The variation in colors across rows highlights the fact that SNAP payment error rates fluctuate frequently across these 2-percentage-point bins. This fluctuation will make planning for the expected cost shift even more difficult for states. Forty-three states had payment error rates over this four-year period that fell into at least two bins: Twenty-eight states had payment error rates in two different bins, 14 states in three different bins, and one state (North Carolina) had an error rate in each of the four different bins. Thirty-three states and D.C. had an error rate above 10 percent at least once. Only five states—Idaho, South Dakota, Vermont, Wisconsin, and Wyoming—have had payment error rates consistently below 6 percent since 2022.
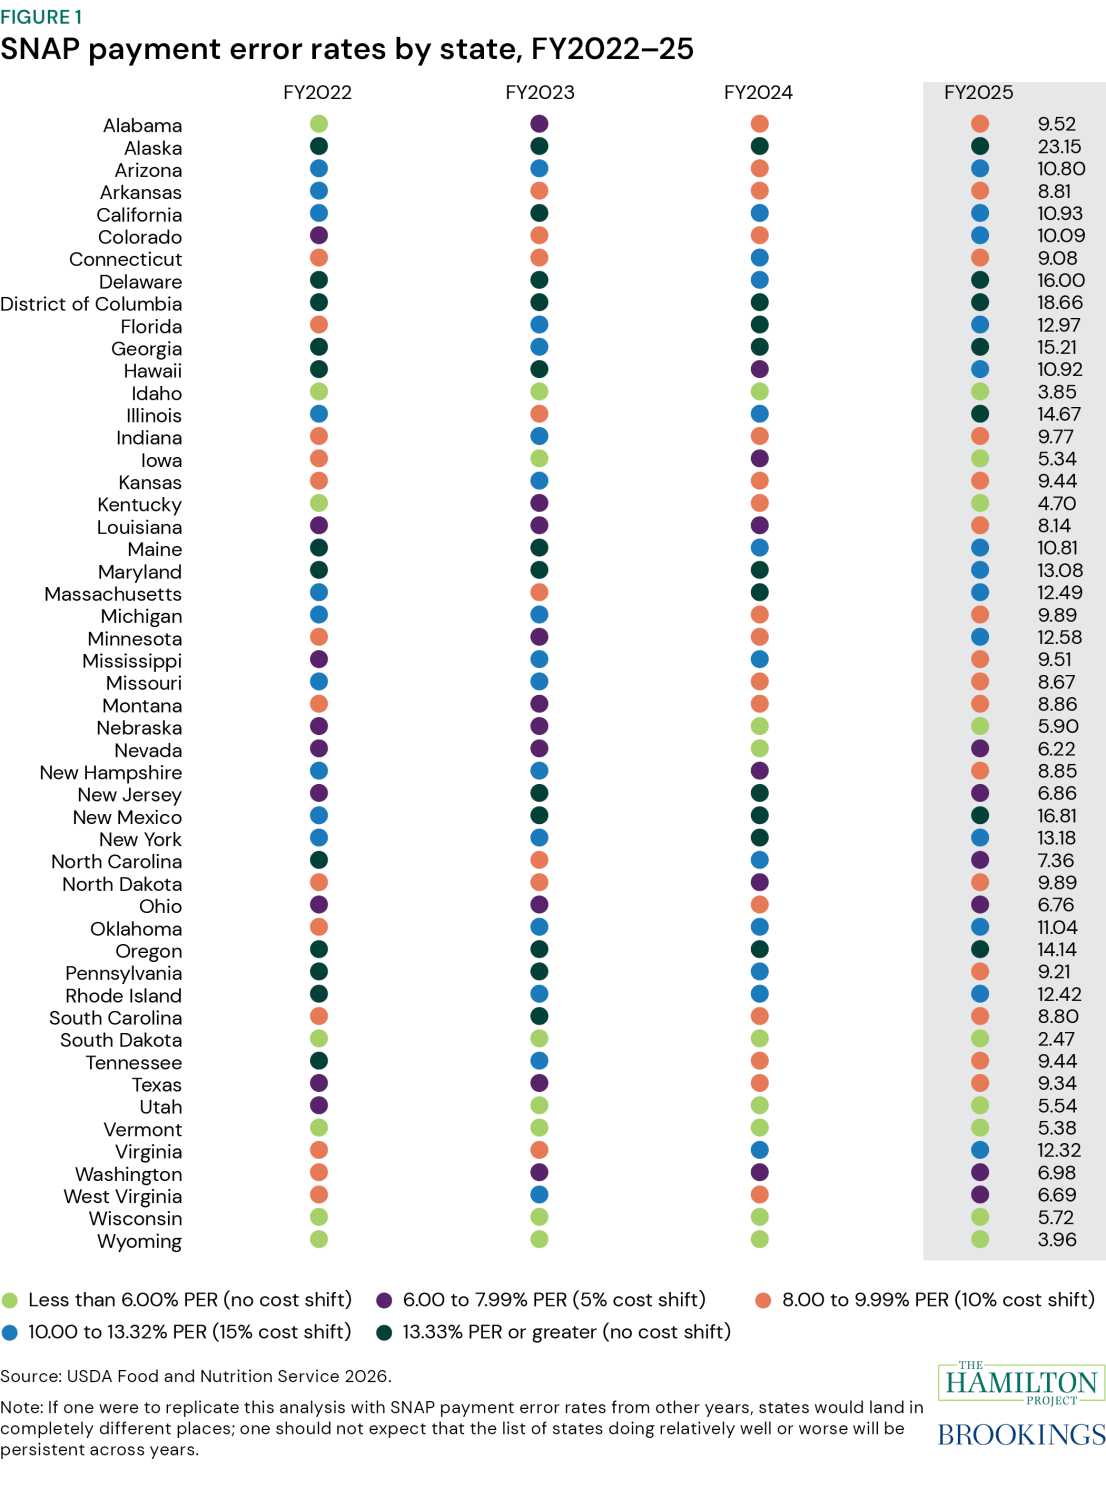
In FY2028 (starting in October 2027), 15 states and Washington, D.C., will have SNAP benefits fully paid for by the federal government because they have a payment error rate below 6 percent (nine states) or above 13.33 percent (six states and DC). If FY2025 payment error rates are used, the remaining 35 states may have to pay portions ranging from 5 percent (six states), 10 percent (16 states), to 15 percent (13 states) of benefits. States instead may opt to use their FY2026 payment error rate to determine the share of benefits to be paid (information that will likely be released in June 2027).
How is the SNAP payment error rate calculated?
What is not addressed or accounted for under OBBBA is that there is substantial and consequential statistical noise in the measurement of the SNAP payment error rate. The SNAP payment error rate is a statistic: It is not an inherently precise number, but rather the best estimate given the underlying random sample of cases. As with all statistics, the estimated payment error rate is likely to be different from the “true” rate that would be measured if one were to audit every single case instead of a sample drawn from the full caseload. If, due to luck of the draw, the sample happens to consist disproportionately of simple, well-documented cases, the estimated payment error rate will be lower than the rate that would be calculated if we could audit every single case. If, on the other hand, the sample happens to overrepresent complex cases, the estimated payment error rate will be higher than the true error rate that would be computed if the entire caseload were used to produce the calculation.
A state does not—and should not—review every single case on file to produce the payment error rate; in FY2023, the SNAP caseload was 22.2 million households, and 45,467 cases were reviewed. Identifying errors requires a deep dive into the data, reinterviewing participants, and careful consideration of the SNAP program rules by dedicated quality control staff; more time and information are given per case during quality control than is given for eligibility and benefit determinations. Due to costs (our estimate is that these reviews cost about $100 million a year1) and time constraints, quality control is only conducted on a small subsample of SNAP cases. Each state draws a “statistical sample” of SNAP-participating households from active cases. The state agency reviews this statistical sample of cases to identify and quantify payment errors, meaning that the agency checks each of the sampled cases to determine whether the state either overpaid or underpaid a household by more than the maximum allowable amount for that fiscal year ($58 in FY2026). The absolute values of overpayments (which include payments to ineligible households) and underpayments to participating households are summed. The value of the total dollar amount of over- or underpayments is divided by the total dollar amount in benefits to calculate the error rate estimate.
Next, the federal government re-reviews a sample of the state’s review of the statistical sample of cases. On average, the federal government reviews about one-third of the cases that were in the state review sample. This results in further revision to the payment error rate statistic to produce the final point estimate and the confidence interval around that estimate (though with an extended lag). But the sampling variability in the statistic is only part of its uncertainty. Not all case reviews can be completed satisfactorily. Behind the scenes, federal auditors must make imputations to assign payment error values to incomplete cases. A state’s official payment error rate point estimate, i.e., the single number that is the state’s SNAP payment error rate for the fiscal year, is what the federal government determines from its review of the state’s initial review. The federal government review also produces a 95 percent confidence interval around the estimated error rate in a separate report, which is released with a multi-year delay from the release of the point estimate. (Standard errors for FY2024 and 2025 error rates are not available yet.)
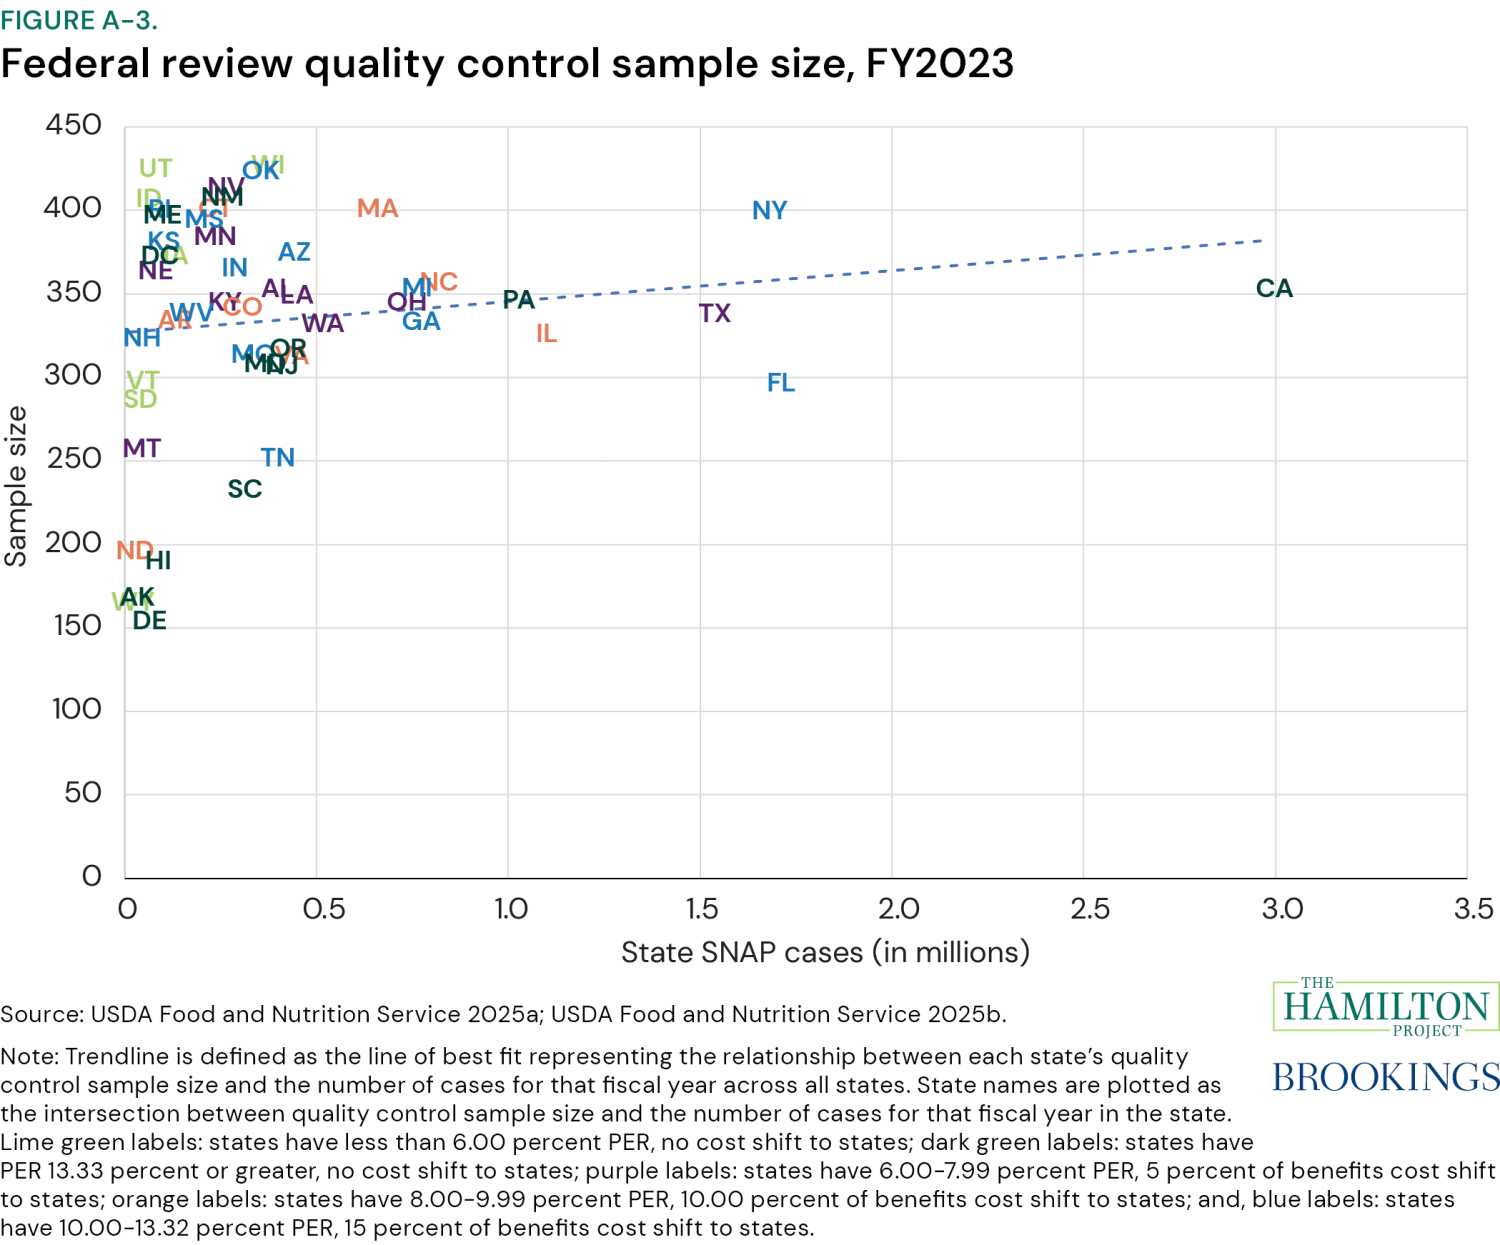
The precision of a statistic is related to its sample size; thus, the variability of a state’s payment error rate statistic is related to the sample size of the number of cases in the federal review of each state. In FY2023 the number of cases reviewed ranged from 155 in Delaware to 428 in Wisconsin. Appendix figure 3 shows that there is little relationship between the size of a state’s caseload and the sample size.
There is a lot of random chance in a state’s SNAP payment error rate
The core of this analysis is an evaluation of the SNAP payment error rate for a single year. To illustrate the concepts at issue, we estimate statistical uncertainty using FY2023 SNAP payment error rates, the most recent year with complete USDA-published payment error rate data—including the relevant statistical uncertainty—available (see table 27). USDA does not release the QC Annual Report for a given fiscal year until a couple of years later, which is why in this analysis, instead of using the most recent (2025) error rates we use the 2023 error rates—that is, the most recent year for which USDA has published standard errors.
Because the payment error rate statistic varies so widely and unpredictably from year to year, which states will have to make payments toward SNAP benefits, and what their contribution rate will be, varies by year. The point we make here is true no matter the year we use to illustrate the issues: Statistical uncertainty in the payment error rate will drive substantial random variation in cost-shift rates because the bin sizes are small relative to the size of the statistical uncertainty.
We show the payment error rate point estimate (figure 2) and the confidence intervals around the FY2023 payment error rates (figure 3) as well as for each state from FY2002–23 (a data interactive; figure 4). In table 2, we then calculate expected state cost shifts using FY2023 SNAP benefit expenditures to size the uncertainty in terms of both SNAP benefit expenditures in millions of dollars and as a share of a state’s FY2023 expenditures (table 2).
We emphasize that if we were to replicate this analysis with SNAP payment error rates from other years, states would land in completely different places; one should not expect that the list of states doing relatively well or worse will be persistent across years. Furthermore, the “Alaska carveout,” with zero cost-shift payments for states with error rates 13.33 percent or higher, is only in effect for two years (until FY2030); to illustrate expected payments after this provision sunsets, we also remove the exception criteria for high error rates and show the results in table 2.
Figure 2 shows the point estimate for the FY2023 payment error rate by state, ordered from lowest to highest. Had OBBBA’s policy for FY2029 been in place during this period, seven states would have paid nothing due to a low estimated error rate, and 11 states and D.C. would have paid nothing due to having a high estimated error rate. The remaining 32 states would have been required to pay between 5 and 15 percent of benefit costs.
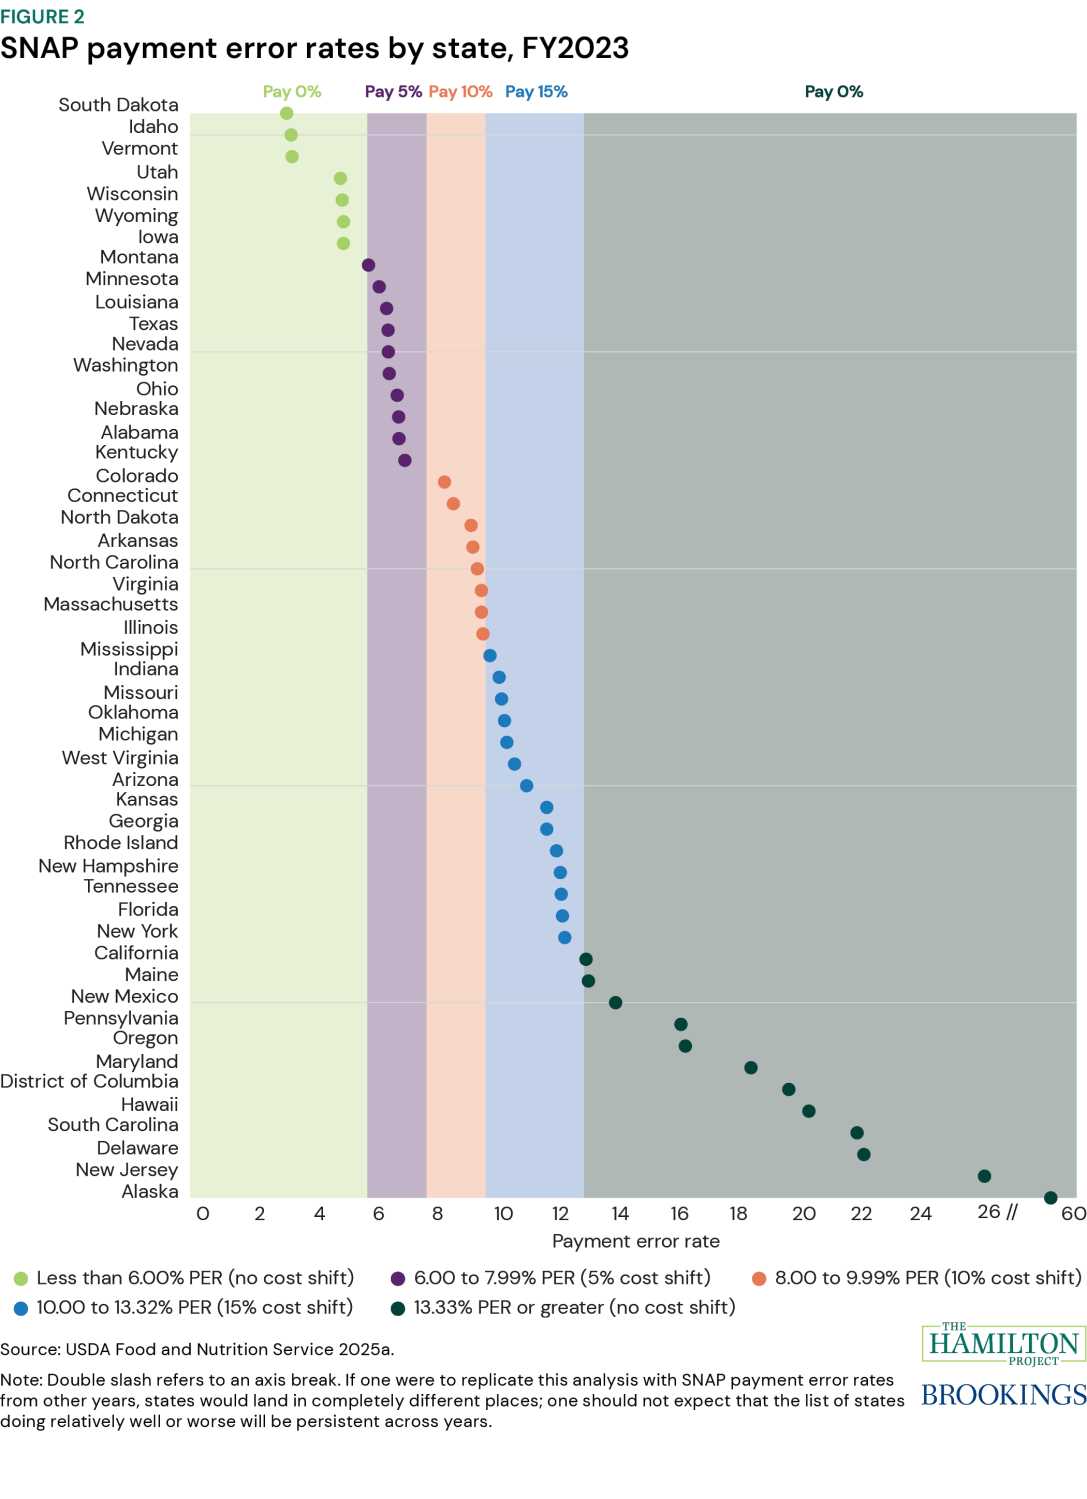
The reported SNAP payment error rate is the best estimate of the “true” error rate that would be produced if every case were completely audited. While there is only one “true,” unobserved error rate, standard statistical methods produce a best estimate of that rate—plus a range around the estimate reflecting that the “true” error rate may be higher or lower. This range is the “95 percent confidence interval.” It means, in essence, that if we drew 100 samples and calculated an estimated rate and range from each, about 95 of those ranges would contain the true but unobserved error rate. The wider this range, the greater the uncertainty in the estimate—meaning the reported rate could sit well above or below the true error rate. Under the cost-shift policy, a wider range also means a greater chance that a state’s required payment rate reflects sampling luck rather than its actual performance.
Figure 3 shows the 95 percent confidence intervals around each state’s estimated payment error rate for FY2023. The point estimate (dot) and the lower and upper bounds (triangles) are color coded to show which OBBBA cost-shift bin each of these three values falls into. The “true” payment error rate is not equally likely to land equally throughout the confidence interval (see figure 7 for further discussion).
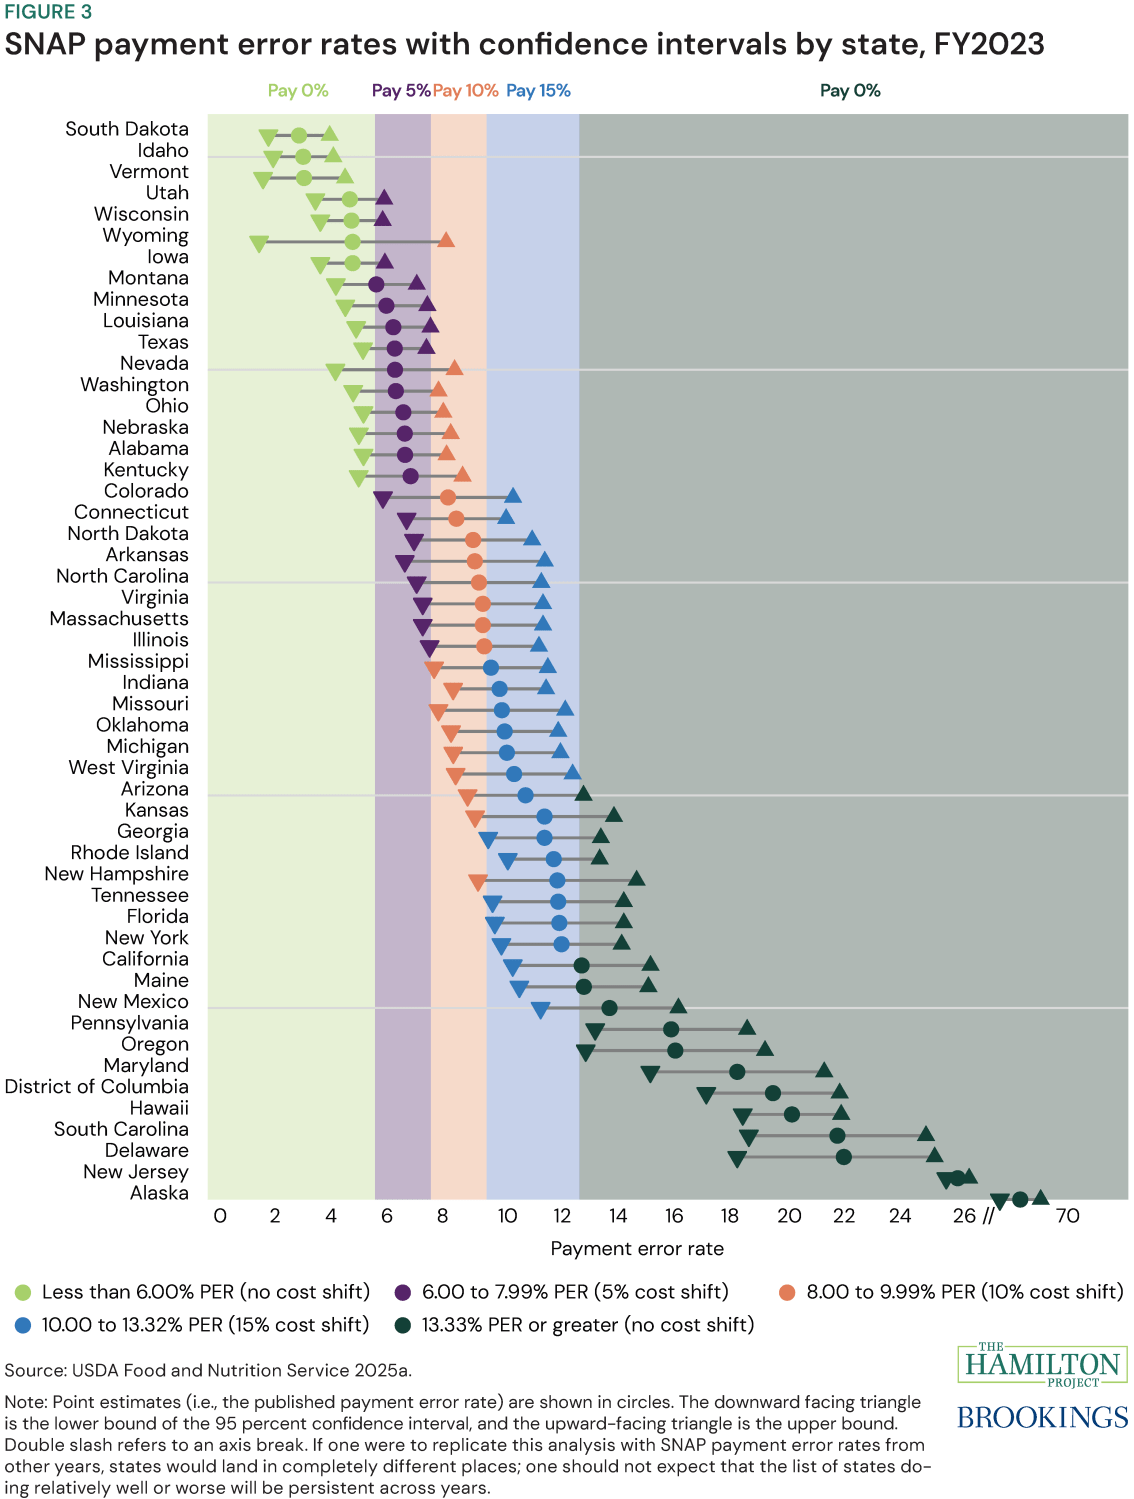
Only among those states with SNAP payment error rates at the very low end (three states) and very high end (eight states and D.C.) does the 95 percent confidence interval fall entirely within a single bin—meaning that we can be confident that the state’s true payment error rate is below 6 percent or equal to or above 13.33 percent. This is partly a function of the width of the relevant cost-shift bin, which is 6 percentage points at the low end (0 to 5.99 percent) and about 87 percentage points at the high end (13.33 to 100 percent)—far wider than the narrow 2-percentage-point bins in between.
But we reiterate that SNAP payment error rates differ widely from year to year (figure 4), and “precision” at below 6 percent or above 13.33 percent in one year has little predictive power for the next year.
How variable could the cost of the cost shift be?
Due to random chance from statistical sampling variability, each year it is unpredictable whether a state will pay nothing or 5, 10, or 15 percent of benefit costs. When the confidence interval extends across multiple bins—as is the case for most states—we cannot be confident that the state’s “true” error rate falls in the same bin as the noisy point estimate produced from the available sample. For these states, the obligation could be too high or too low purely due to random chance. In this section, we quantify this uncertainty in terms of billions of dollars and as a share of a state’s budget in a single year. Again, we emphasize that the states and error rates vary widely from year to year, so FY2023 is an illustrative example.
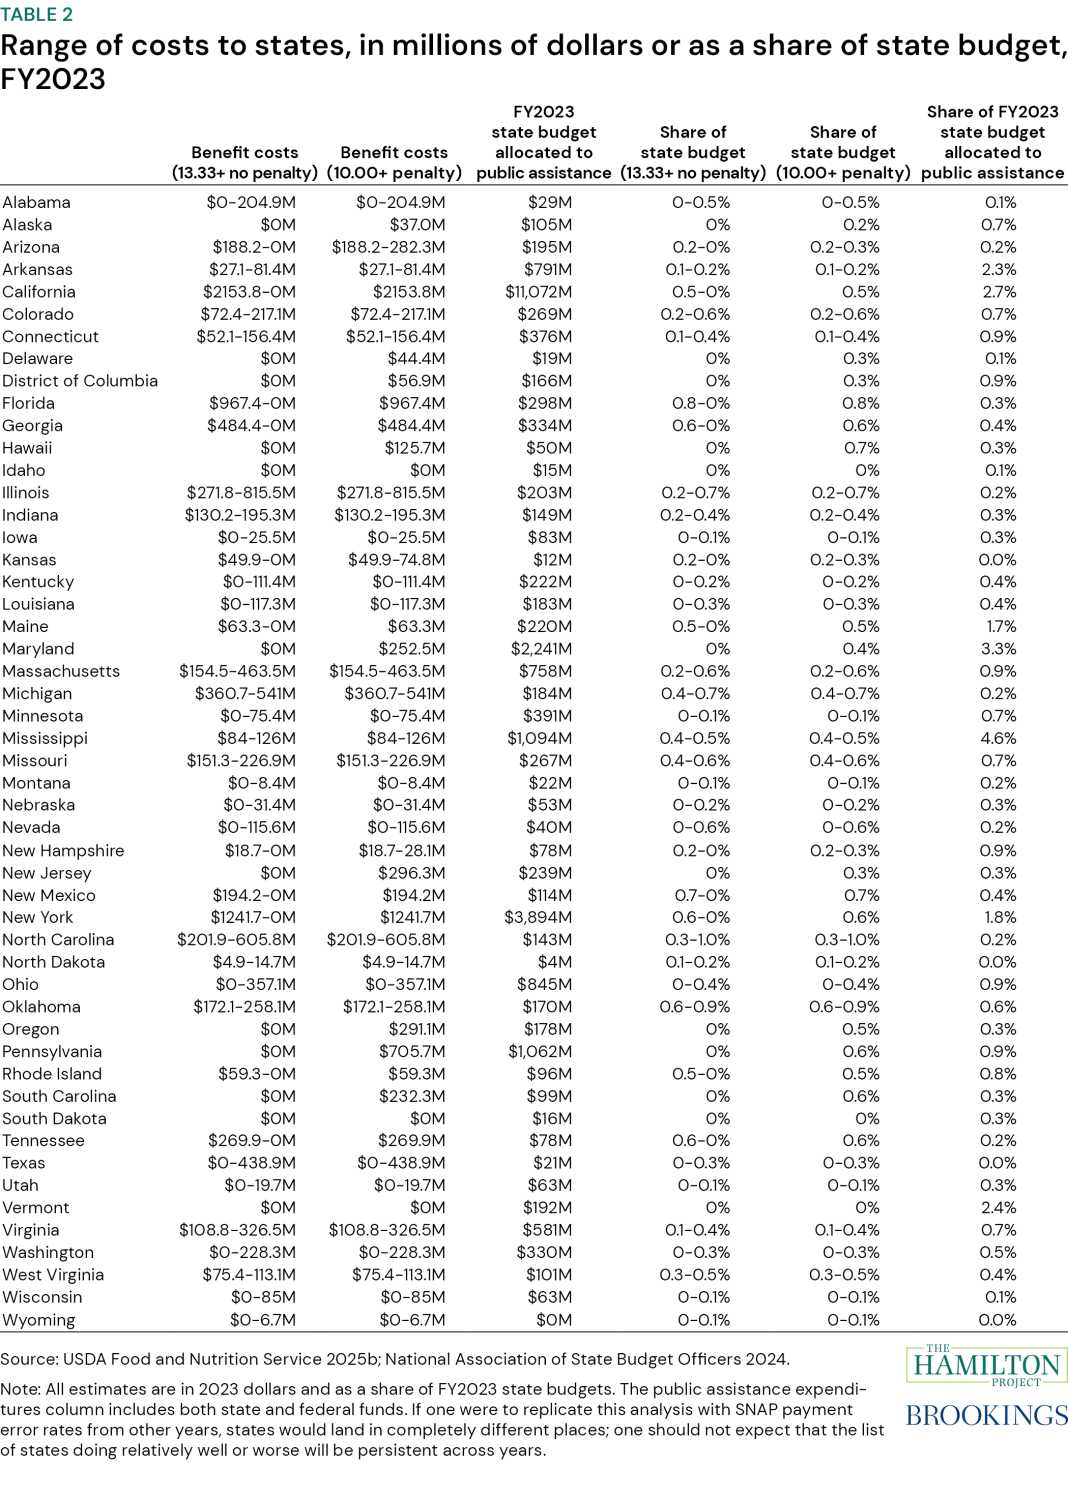
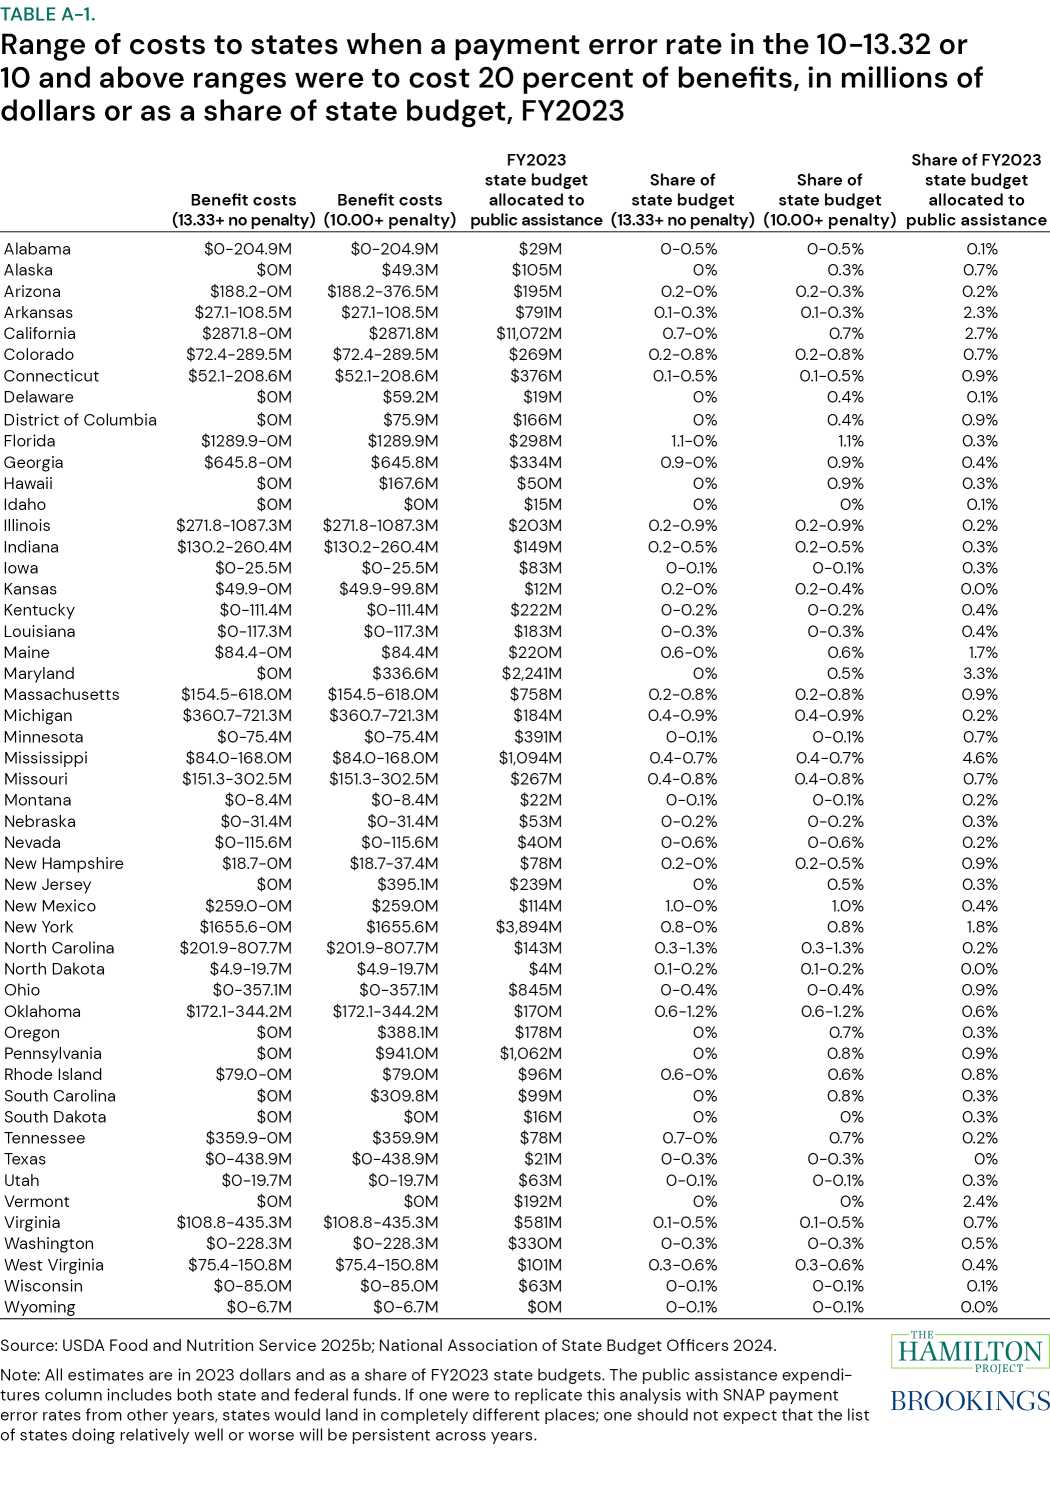
Table 2 first quantifies the uncertainty that a state would face in billions of dollars, showing the range of SNAP benefit payments in FY2023 that would have been statistically likely based on the 95 percent confidence interval around the FY2023 payment error rate. For this illustration, we treat each state’s estimated payment error rate as if it were the true, unobservable rate, then use the confidence interval to show how much the resulting obligation could vary from sampling alone. Eleven states and D.C. would have been likely to pay nothing, because their 95 percent confidence interval fell either entirely below 6 percent or entirely at or above 13.33 percent (the two-year “Alaska carveout” group). For all other states, though, there is substantial chance—due to luck of the draw—that they will be required to pay hundreds of millions of dollars more, or hundreds of millions of dollars less, toward their SNAP benefits. These include states such as California, Florida, Georgia, New York, and Texas. At the extreme, due to random chance, California could pay nothing or more than $2 billion.
In other words, due to the variability in the payment error rate estimation, large changes in cost share liabilities basically come down to a coin flip. In Montana, the FY2023 payment error rate calculations indicate that it was almost equally likely that the state would fall into the 5 percent payment bin (51.8 percent chance) as it was that it would fall into the zero benefit costs payment bin (47.8 percent chance). Meanwhile in California, it is a higher-stakes coin toss between an estimated rate falling into the 15 percent payment bin (47.5 percent chance) or the no payment bin (52.1 percent chance) due to have an imprecisely measured higher error rate. The imprecision in Illinois’ estimated rate gave them nearly equal odds at falling into the 10 percent cost-shift bin (50.8 percent chance) or the 15 percent bin (46.4 percent chance).
For other states, the outcomes could range even more widely, randomly. In Nebraska, they would have had a 10.4 percent chance of paying no benefits, a 76.5 percent chance of paying 5 percent, a 13.1 percent chance of paying 10 percent, and a small but non-zero chance of paying 15 percent (0.02 percent chance). Arkansas faced a 50 percent chance of paying 10 percent, a 10.7 percent chance of paying 5 percent, a 36.7 percent chance of paying 15 percent, and a small chance of paying nothing for drawing either a high or low error rate.
The second column removes the “Alaska carveout” group—reflecting how the policy will operate beginning in FY2030, when states with a payment error rate at or above 13.33 are subject to the full 15 percent cost shift rather than being exempted. This reduces some uncertainty: States with genuinely high error rates are more likely to have their entire confidence interval above 10 percent, and therefore to pay 15 percent of benefits reliably. Even so, many states whose point estimate exceeds 10 percent have a confidence interval that dips below it, giving them a real chance of paying only 5 or 10 percent of benefits, and leaving substantial uncertainty about their expected payment.
Next, we size the uncertainty as a share of a state’s FY2023 budget, showing the range of SNAP benefit payment costs that would have been statistically likely based on the 95 percent confidence interval around the FY2023 payment error rate. For comparison, the state’s share of their budget alloted to public assistance (meaning TANF as well as optional state programs for General Assistance and Supplemental Security Income and smaller direct assistance programs) in FY2023, is shown in the final column. The cost-shift policy represents substantial costs relative to what states spend on public assistance (with the federal government’s support through TANF and other programs). With such substantial and random uncertainty, it will be difficult for states to budget for the range of random possible outcomes.
Conclusion
In this analysis, we study the SNAP payment error rate and explain why tying how much a state will have to contribute toward SNAP payments to it is inherently empirically unstable. In doing so, we produce new evidence documenting fundamental flaws in the design of the enacted policy to shift a portion of SNAP benefit payments onto states. These flaws make the payment error rate an especially poor metric for determining state cost-shift rates, especially given states’ needs to plan and budget around their new SNAP payment obligations. Because every state but one is required by its constitution or other laws to balance its budgets each year, the new cost shift will be even more difficult for state budgeting processes to absorb.
We conclude that the SNAP payment error rate is too imprecisely measured to determine the share of SNAP benefits a state must pay under the new law. Because a state’s error rate—and therefore its payment share—is largely random with regard to the cost-shift bins, this cuts against the high-stakes incentive to reduce payment error rates through improved program administration. Random chance should not determine whether a state pays for a portion of SNAP benefits, or how much. And random chance certainly should not be the cause of a state dropping out of the program entirely.
Others have argued for delay. Notably, in January, several nonpartisan organizations (the National Governors Association, the Council of State Governments, the National Conference of State Legislatures, the National Association of Counties, the National League of Cities, the American Public Human Services Association, the National Association of County Human Services Administrators, the International County/City Management Association, and the U.S. Conference of Mayors) wrote a letter to Congress asking that implementation of the SNAP benefit cost shift be delayed to FY2030, so states would have more time to improve payment error rates. Delaying implementation is also a part of the Democrats’ “Farm and Family Relief Act” proposal and a stated condition for Farm Bill support. Senator John Boozman (R-Ark.) has offered a one-year delay in the Agricultural Act of 2026 in exchange for making states pay 20 percent of benefits for a payment error rate above 10 percent; Appendix table A-1 shows what this would cost.
But delaying implementation, or even shifting from the point estimate to the confidence interval, will not solve the issues raised here. Even states that dedicate substantial effort and resources to reducing payment errors cannot count on that effort to produce lower payment error rates. We therefore reiterate that the best policy response to the OBBBA changes, including those that use the payment error rate to determine state cost shifts, is for Congress to repeal them and repair the damage this policy has already caused. SNAP benefits should be fully federally funded.
Appendix A. Additional figures
Appendix B. How much of the cost-shift outcome is sampling variability? A thought experiment
In this appendix, we estimate the following thought experiment: If each state’s FY2023 reported payment error rate (PER) and standard error were taken to describe the center and spread of the sampling distribution that generated the observed rate, how often would a re-drawn quality-control sample place the state in each cost-shift bin? Note that this exercise is not a probabilistic forecast of what any state will actually owe. Instead, it treats the FY2023 reported PER and standard error as fixed inputs and does not apply any shrinkage toward a national mean; a fully Bayesian treatment would pull extreme point estimates toward the middle of the distribution and, if anything, reduce the probabilities assigned to the tail bins for states with small sample sizes.
The point of this exercise is to show, using each state’s own reported uncertainty, how much of the resulting bin assignment is driven by sampling variability alone.
Concretely, for each state s we take the FY2023 reported PERs and standard error SEs from USDA’s SNAP Quality Control Annual Report and compute the probability that a re-drawn observed PER falls in each cost-shift bin under a Normal(PERs, SEs) sampling distribution. The five bins are those established by OBBBA for the state cost shift:
- Below 6 percent PER (0 percent match)
- 6 to 7.99 percent PER (5 percent match)
- 8 to 9.99 percent PER (10 percent match)
- 10 to 13.32 percent PER (15 percent match)
- 33 percent or higher PER (0 percent match for first two years).
Figure B1 reports the resulting probabilities.
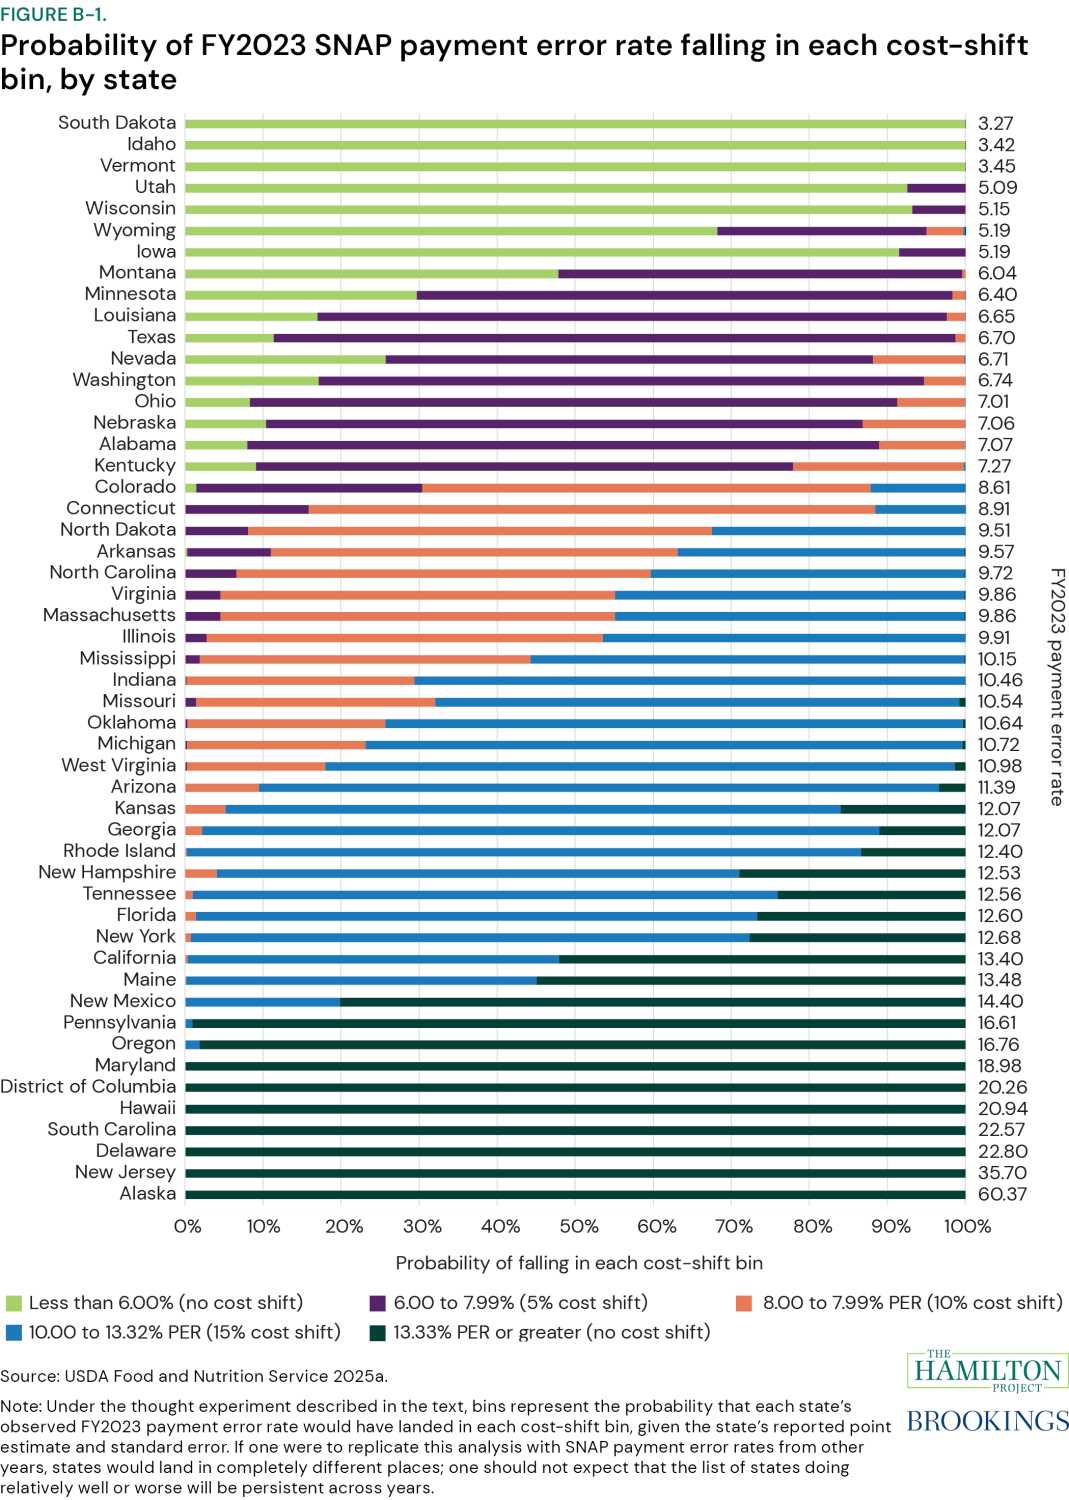
Two patterns emerge from figure B1. The first is the “boundary problem:” States whose reported PER sits close to a bin threshold face a near coin flip between two adjacent match rates. In Illinois, the FY2023 reported PER of 9.91 percent with a standard error of 1.00 implies a 50.8 percent chance of landing in the 8 to 9.99 percent bin (requiring a 10 percent match) and a 46.4 percent chance of landing in the 10 to 13.32 percent bin (requiring a 15 percent match). In North Carolina, a reported PER of 9.72 percent with a standard error of 1.14 implies a nearly identical split: 53.1 percent chance of a 10 percent match and 40.2 percent chance of a 15 percent match. In Kentucky, a reported PER of 7.27 percent with a standard error of 0.95 implies a 68.8 percent chance of a 5 percent match and a 21.9 percent chance of a 10 percent match, with a further 9.1 percent chance of avoiding a payment altogether. In each of these cases the difference between the two most likely outcomes is well within the state’s own reported sampling uncertainty, yet the corresponding cost-shift obligation differs by 5 percentage points of SNAP benefits.
The second pattern is the “width problem:” The size of the standard errors in some states means that they face potential outcomes spread across three or even four bins. In Colorado, a reported PER of 8.61 percent with a standard error of 1.19 results in probabilities of 1.4 percent (0 percent match), 29.0 percent (5 percent match), 57.4 percent (10 percent match), and 12.1 percent (15 percent match). In Arkansas, a reported PER of 9.57 percent with a standard error of 1.28 produces probabilities of 0.3 percent (0 percent match), 10.7 percent (5 percent match), 52.2 percent (10 percent match), and 36.7 percent (15 percent match). For these states, any single year’s realized cost-shift bin is a poor guide to their underlying error-rate performance, and the swing between the least and most likely outcomes could shift the state’s obligation by 10 to 15 percentage points of SNAP benefits.
Aggregating across states, the thought experiment implies that in FY2023, 17 states had at least a 5 percent probability of landing below the 6 percent cost-shift threshold, 20 had at least a 5 percent probability of falling in the 6 to 7.99 percent (5 percent match) bin, 23 had at least a 5 percent probability of falling in the 8 to 9.99 percent (10 percent match) bin, and 27 had at least a 5 percent probability of falling in the 10 to 13.32 percent (15 percent match) bin. In this exercise, the variability in these outcomes is entirely to sampling variability rather than to any underlying difference in administrative performance. These probabilities apply in each year, and independently, meaning the cost-shift obligation will churn from year to year for the same state even if its true error rate never changes.
A few caveats are worth stating. First, the exercise assumes approximate normality of the sampling distribution around each state’s reported PER. Second, it uses each state’s federally reported standard error as-is; it does not attempt to model additional uncertainty due to adjustments made during the federal re-review (such as treatment of incomplete cases) beyond what is already reflected in that standard error. Third, and as noted above, it applies no shrinkage: A Bayesian analysis that pulled extreme point estimates toward the national mean would tend to reduce the tail-bin probabilities for the noisiest states, though it would not change the qualitative message that a large share of the year-to-year cost-shift outcome is driven by sampling variability. Fourth, in interpreting figure B1, readers should note that the cost-shift match rate for the >13.33 percent bin is 0 percent in FY2028 and FY2029 under the two-year delay and 15 percent thereafter, so the same measured PER corresponds to very different obligations depending on the fiscal year.
-
Data references
An act to provide for reconciliation pursuant to title II of H. Con. Res. 14. 2025 (One Big Beautiful Act). Public Law 119-21. https://www.congress.gov/bill/119th-congress/house-bill/1/text.
National Association of State Budget Officers (NASBO). 2024. 2024 State Expenditure Report. https://higherlogicdownload.s3.amazonaws.com/NASBO/9d2d2db1-c943-4f1b-b750-0fca152d64c2/UploadedImages/SER%20Archive/2024_SER/2024_State_Expenditure_Report_S.pdf
U.S. Department of Agriculture, Food and Nutrition Service. 2025a. Supplemental Nutrition Assistance Program (SNAP) Quality Control Annual Report, Fiscal Year 2023. https://fna-bwbufwdzbabpezgc.z01.azurefd.us/sites/default/files/resource-files/snap-qc-annualreportfy23.pdf
U.S. Department of Agriculture, Food and Nutrition Service. 2025b. Supplemental Nutrition Assistance Program State Activity Report, FY 2023. https://fns-prod.azureedge.us/sites/default/files/resource-files/snap-sar-fy23.pdf.
U.S. Department of Agriculture, Food and Nutrition Service. 2026. “SNAP Payment Error Rates.” Last modified June 24, 2026. https://www.fna.usda.gov/snap/qc/per.
Authors


Related Content
-
Acknowledgements and disclosures
We thank Aviva Aron-Dine, Katie Bergh, Marisa Bremer, Hannah Garden-Monheit, Bob Greenstein, Este Griffith, Sarah Hassmer, Colleen Heflin, Hilary Hoynes, Liza Lieberman, Joseph Llobrera, Gnora Mahs, Jonathan Meltzer, Sarah Pratter, Dottie Rosenbaum, Jesse Rothstein, Katie Saim, Jon Schwabish, David Super, Betsy Thorn, Laura Tiehen, Michele Ver Ploeg, and James Ziliak for conversations and comments that materially improved the paper. Sarah Calame and Tia Cole provided excellent research assistance, and Joyce Chen, Aidan Obermueller, Asha Patt, and Eileen Powell provided research support.
-
Footnotes
- In 2023, USDA estimated that it took approximately nine hours to complete a single case review and used the median wage of a social worker ($32.47 in 2025 dollars) to calculate the wage portion of the costs. Using the average ratio of wages to total costs for Illinois, Michigan, New York, Ohio, Pennsylvania, and Texas (18.6 percent) and applying that ratio to the total number of cases reviewed in FY2023 (53,312) we arrive at a back-of-the-envelope estimate of approximately $92 million dollars. Prior research from FNS pegged annual costs at approximately $108.5 million.
The Brookings Institution is committed to quality, independence, and impact.
We are supported by a diverse array of funders. In line with our values and policies, each Brookings publication represents the sole views of its author(s).