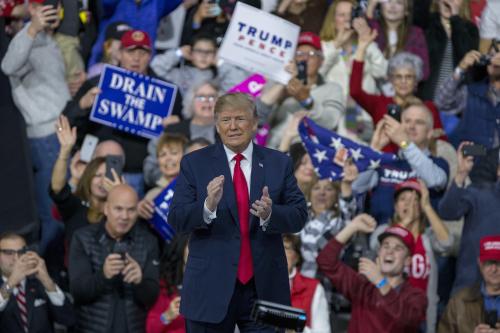
Donald Trump’s victory in this week’s election is a stark reminder of how divided the fortunes and attitudes of different types of communities have become. Trump received more support than Mitt Romney in “vast swatches” of the industrial Midwest and rural south where older, white working-class voters appear to have become dissatisfied with the direction of the economy and the country. But early county-level elections data suggest these trends may have less to do with regional differences and more to do with the growing divide between Americans in large metropolitan areas and the Americans outside of them.
Trump’s victory would likely not have been possible without the influence of rural areas and smaller metropolitan areas. First, turnout in those places increased: Of the 11.4 million more votes cast in this presidential election than the last, 47 percent came from counties in rural areas and small metro areas (those with populations under 500,000) even though those counties comprise only 36 percent of total votes cast in this election. Second, voters in those places supported Trump by wide margins: An average of 58 percent of the votes cast from these counties went for Trump, compared to 56 percent for Romney in 2012. Relative to Romney, Trump gained one percentage point more of the vote share in small metro areas, and three-and-a-half percentage points more in rural counties. Those margins provided a decisive margin in key states such as Pennsylvania, Michigan, and Wisconsin.
However, Trump lost support that Romney received from voters in large metropolitan areas, who cast nearly two-thirds of the votes in this election. As in 2012, a minority of voters in metropolitan areas with more than 500,000 people cast their vote for the Republican nominee. But in 2016 that minority was smaller. Trump received 42 percent of votes in large metro areas, compared to Romney’s 44 percent. Notably, Trump received less support than Romney in every type of community within large metropolitan areas, even in typically more conservative areas at the exurban and emerging suburban fringe of metropolitan areas.[i] Trump’s support waned the most in highly dense and mature inner-ring suburbs, which are becoming more demographically and socio-economically diverse.

These changes in the voting patterns of large metro areas versus more sparsely populated areas correspond to differences in the economic performance of these two types of places. Trump picked up support in areas that have struggled economically since the onset of the Great Recession and lost support in places that have done better. While large metropolitan areas bore the brunt of the downturn, they recovered faster than smaller metro areas and rural areas. All types of communities in large metro areas had recovered the jobs they lost in the recession by 2014. Counties containing the “primary” or central cities of large metros boomed during this time. But small metro areas and rural areas still had not recouped the jobs they lost in the recession by the start of this election cycle. Job levels in rural areas remained more than 2 percent below pre-recession levels.

Small metro areas and rural areas, which tend to be older, whiter, and less educated than other parts of the nation, also remain lower-income than large metropolitan areas. The more cosmopolitan central cities and dense, inner-ring suburbs that tend to typify popular conceptions of large metro areas boast the highest-paying jobs, on average. Counties that comprise rural areas, communities at the exurban fringe of large metros, and small metro areas—all of which tend to vote more conservatively—have much lower average wages.

While this evidence might suggest that some of Trump’s support stemmed from the economic resentment or distress of voters in sparsely populated areas outside of large metropolitan areas, Trump’s narrow victory does not necessarily indicate that the economy was the only thing motivating voters this election. Hillary Clinton received less support from voters in every type of community except for dense inner-ring suburbs than Barack Obama enjoyed in 2012. Support for the Democratic candidate sagged the most in places where support for Trump surged. But Clinton and Trump both lost support in central cities, first-ring suburbs, and the exurban fringe. In those places, third-party candidates made significant inroads. The results suggest that metropolitan America is feeling somewhat optimistic about its social and economic direction, while small town/rural America is increasingly anxious about its future. Both appear interested in finding a new way forward.

[i] These classifications of intra-metropolitan county types come from Brookings scholar Elizabeth Kneebone’s work charting the geographic distribution of jobs, poverty, crime, and unemployment in metropolitan America. Primary cities are those counties that house the city that appears first in the official metropolitan statistical area (MSA) name, as well as any other city in the MSA title with a population of at least 100,000. Suburban counties make up the remainder of the MSA outside the primary city or cities. Suburban communities are classified in further detail according to their degree of urbanization. Based on a counties urbanization rate (or the share of people in the community who live in an urbanized area, as designated by the Census Bureau), suburban counties are assigned to one of four categories.12 A high-density suburban county has an urbanization rate of 99.5 percent or more; a mature suburban county has an urbanization rate between 75 and 99.5 percent; an emerging suburban county has an urbanization rate greater than 0 but less than 75 percent; and an exurban county has no urbanized population


Commentary
The small town-big city split that elected Donald Trump
November 11, 2016