In September of this year, I published an analysis of the 2020 polls. I found that the final pre-election averages got Joe Biden’s eventual share of the national popular vote almost exactly right but underestimated Trump’s share by about three percentage points. A similar pattern held for the swing states. After the election, the polling industry was determined to get to the bottom of this problem and correct it. They had four years to get it right. They didn’t.
The votes are still being counted, especially in California, which is programmed to release its final results in the first week of December. But it is already evident that Donald Trump will win a majority of the national popular vote, an outcome that few predicted. The final New York Times average put Harris in the lead by one point, and the FiveThirtyEight average by 1.2. As was the case in 2020 and 2016, RealClearPolitics did better, showing Trump and Kamala Harris in a dead heat.
As in 2020, this happened not because the final averages overestimated Harris’ support—they didn’t—but because they undercounted Trump’s. For example, the final FiveThirtyEight average showed Harris with 48% of the popular vote, almost exactly what she is likely to get when all the votes are counted. But the same average gave Trump only 46.8%, at least three points less than what he received.
The same was true of the seven swing states. The final FiveThirtyEight polls missed Harris’ performance by an average of less than 0.5 points (two overestimates, seven underestimates) but underestimated Trump’s performance in each of the seven states, by an average of 2.6 points.
One possible explanation is that there was a late surge toward Trump, and the CNN exit poll offers some evidence for this. Of the voters who said they made their decision during the last week of the campaign, 54% opted for Trump, compared to 42% for Harris. For those who decided in just the last few days, the breakdown was 47% for Trump and 41% for Harris.
But these late deciders constituted a very small share of the electorate—no more than seven percent—and Trump’s margins among them cannot explain the size of the undercount we see this year. On the basis of the incomplete evidence now available, it appears that most of the Trump voters we missed were there all along, but undetected.
Combining the findings from the three most recent presidential elections, I conclude that today’s polling instruments and techniques are not well designed to measure the kinds of voters for which Trump has a distinctive appeal. Some have suggested that because many Trump voters seem to be staunchly anti-establishment and suspicious of authority, they may systematically refuse to answer pollsters’ calls. Another hypothesis is that the criteria pollsters use to determine “likely” voters screen out the kinds of people who are inclined toward Trump.
Whatever its source, it is possible that this “Trump effect” will vanish when he leaves the scene. But it is safer to assume that the transformation of the Republican Party that he has engineered means a higher share of hard-to-detect voters than we saw before 2016. If so, the polling profession would be well advised to go back to the drawing board to get a better understanding of why the error of 2020 recurred in 2024 and how it can be fixed by 2028.1
Related Content
Author

-
Footnotes
- For a useful discussion of the distinction between statistical error, which wasn’t a big problem this year, and statistical bias, which was, see 2024 polls were accurate but still underestimated Trump – ABC News
The Brookings Institution is committed to quality, independence, and impact.
We are supported by a diverse array of funders. In line with our values and policies, each Brookings publication represents the sole views of its author(s).
Commentary
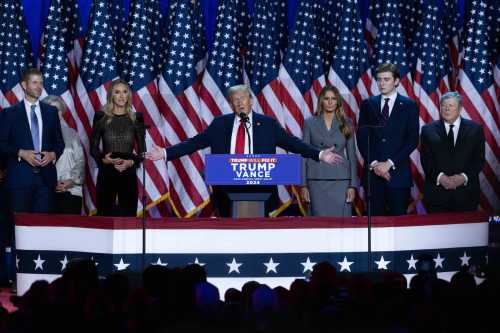
The polls underestimated Trump’s support—again
November 13, 2024