- Santiago Deambrosi
- Jay Shambaugh
- See More
Introduction
The Hamilton Project produces original economic analysis and partners with leading economists to develop policy proposals that support inclusive economic growth. In 2019, The Hamilton Project’s work spanned a wide range of policy topics, including preparation for the next recession, the use of data in state and local policymaking, the decline in private sector unionization, economic policy options to combat climate change, chronic absenteeism, and barriers to labor force participation.
To conclude the year, we present here a month-by-month journey in figures through The Hamilton Project’s research, analysis, and policy proposals.
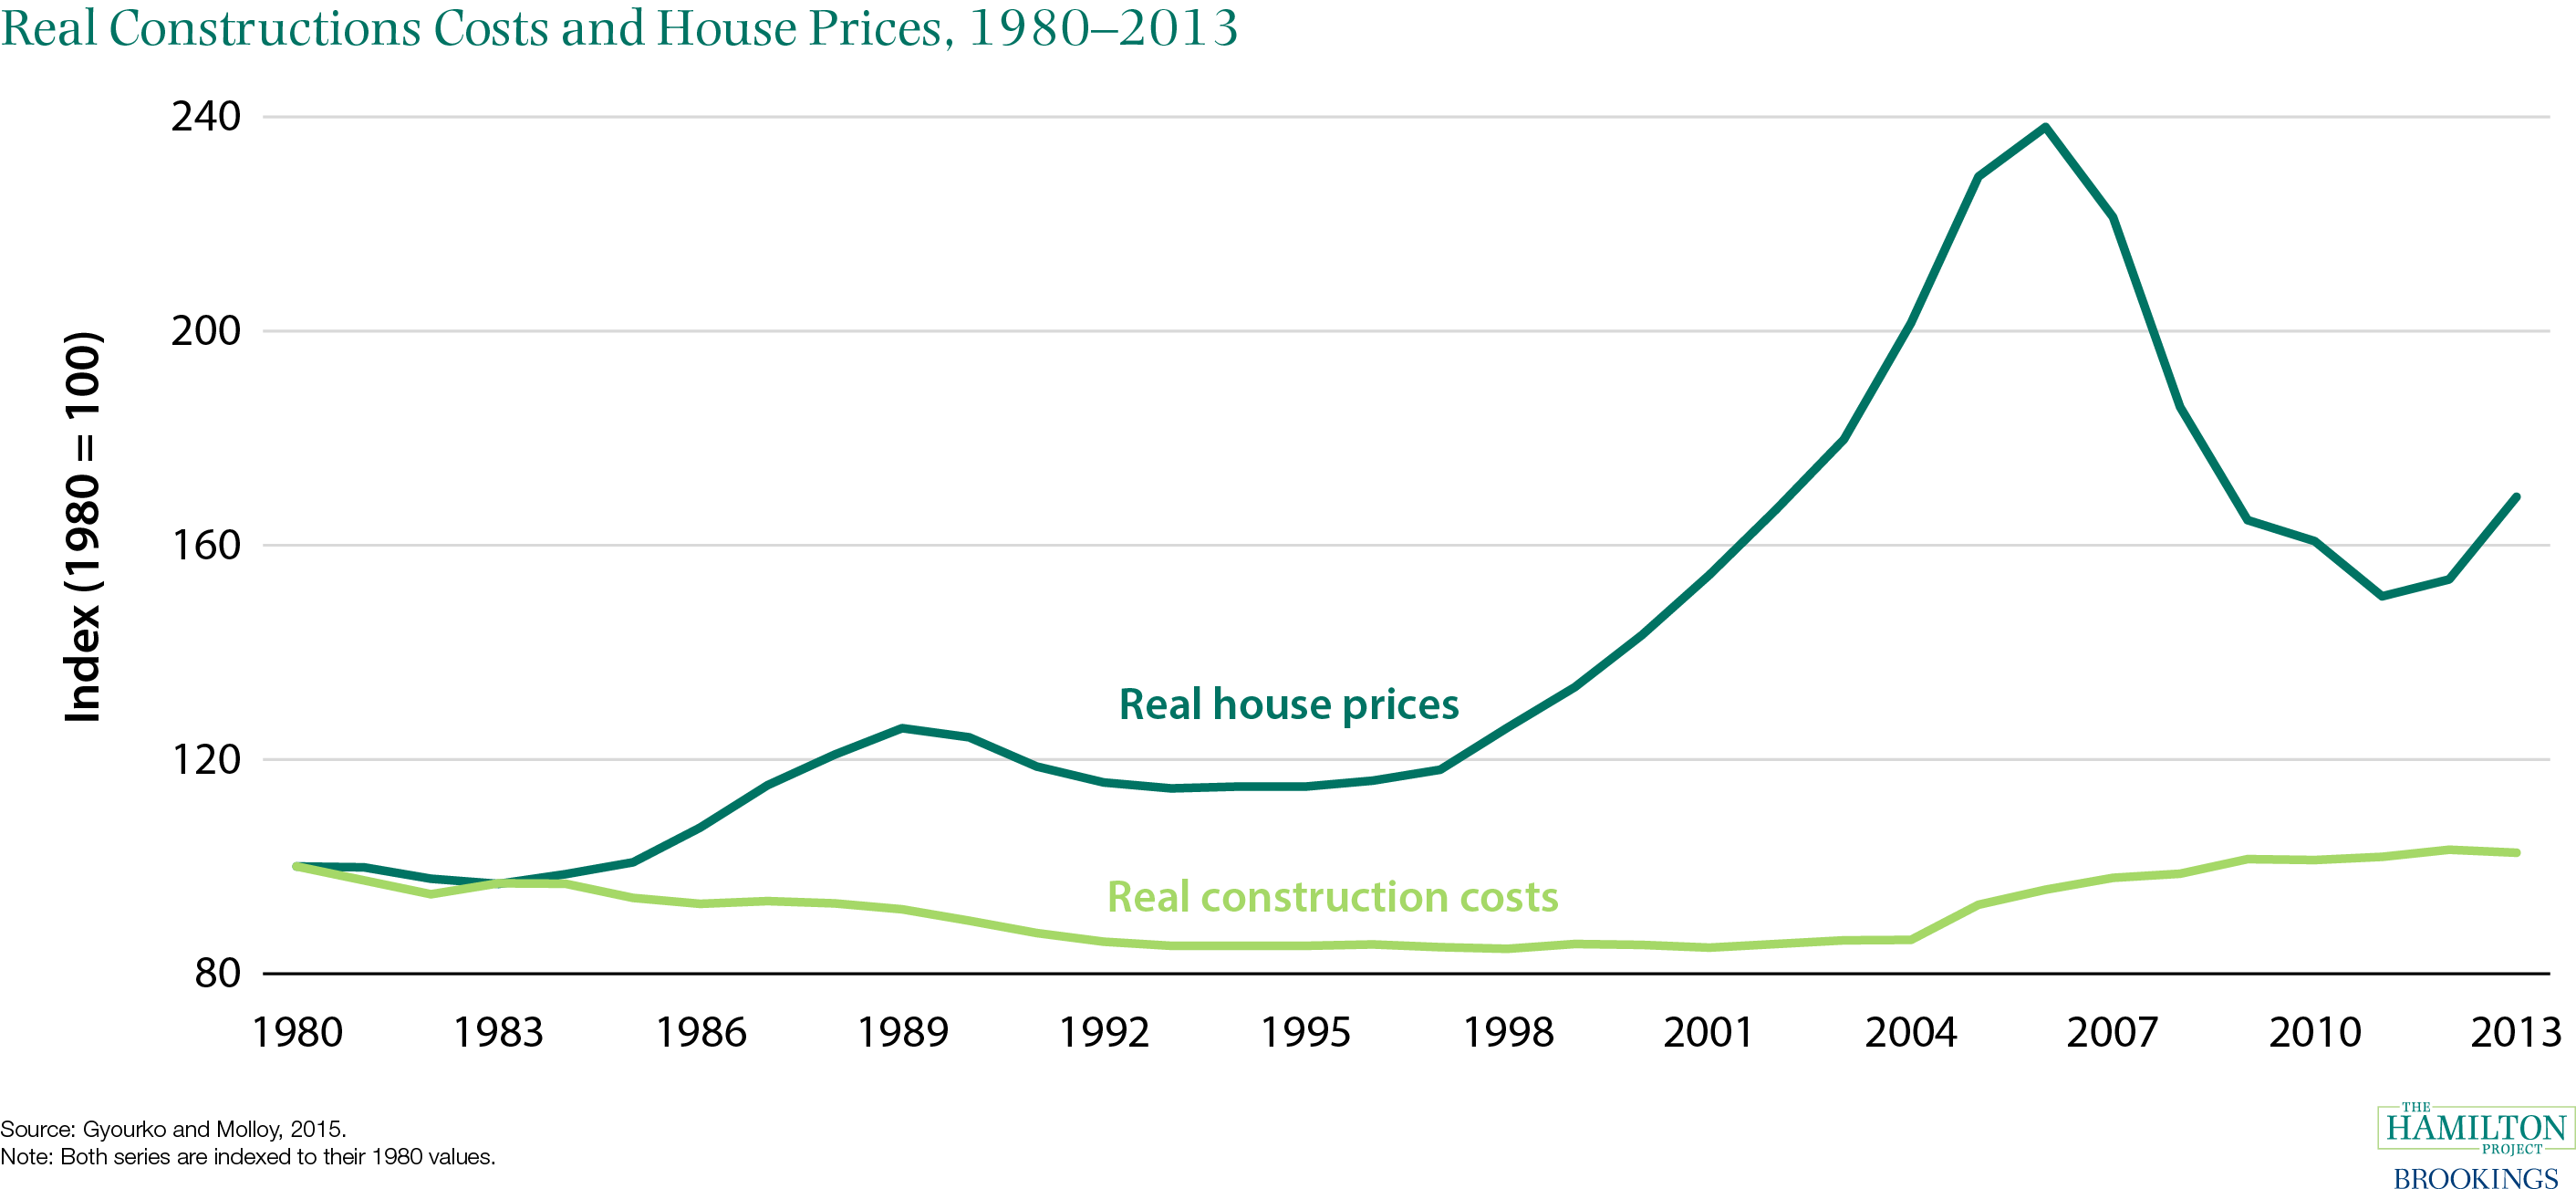
January: Land-use restrictions increase the cost of housing, impairing geographic mobility.
In a set of economic facts about state and local policy, The Hamilton Project showed that construction costs are not the primary factor driving increases in housing prices. Rather, policies such as land-use regulations that restrict housing supply play a much larger role. Although construction costs have remained roughly stable since 1980, the price of land has increased dramatically. Increased housing costs decrease workers’ ability to move to areas with more promising job opportunities, which can diminish economic growth and opportunity for the entire country. Other economic analysis has demonstrated that restrictive land-use and housing policy has limited the extent to which housing availability is able to grow in response to employment.
A related Hamilton Project proposal by Daniel Shoag calls for a suite of land-use and housing policy reforms that would increase access to housing, particularly in areas where employment opportunities are growing.
In addition to Shoag’s proposal, The Hamilton Project released proposals on “Making Fact-Based State and Local Policy,“ by Justine Hastings and “Local Transportation Policy and Economic Opportunity,” by Matthew Turner.
February: Economic and social wellbeing varies dramatically across the country.
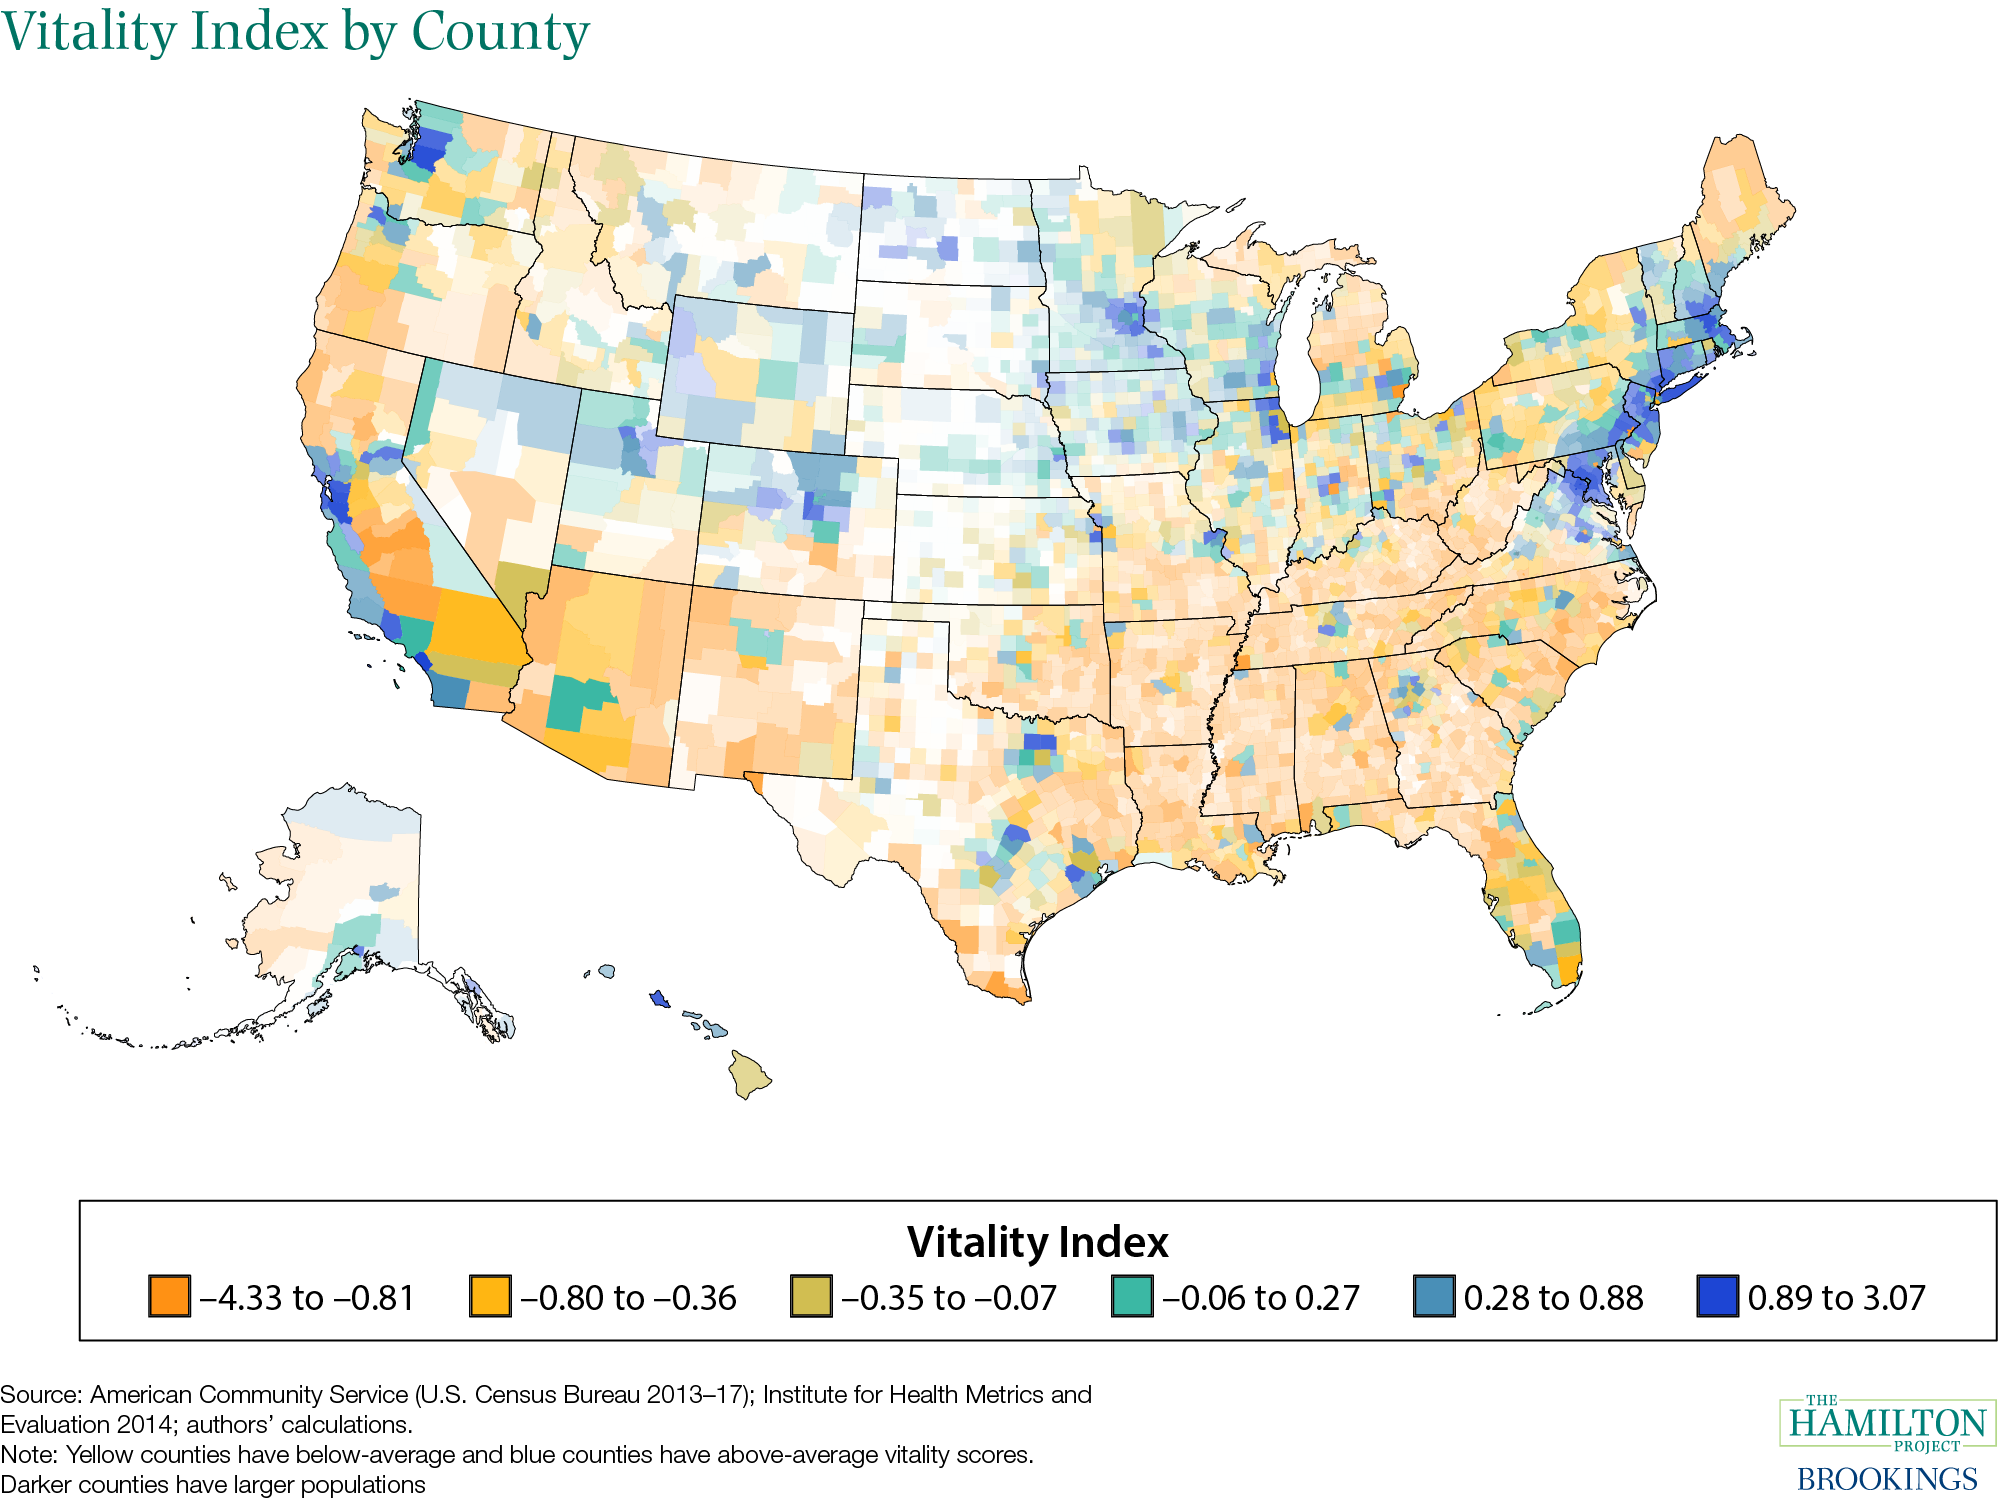
An interactive map featuring The Hamilton Project’s Vitality Index shows how regions across the U.S. are faring. The Vitality Index combines indicators such as a county’s median household income, unemployment and labor force participation rates, poverty rate, and life expectancy to measure the economic and social well-being of every county in the United States.
The interactive highlights the stark gaps in these and other variables, suggesting that economic possibilities are widely different depending on where a person lives. The top performing counties have household income twice as high as the bottom performing counties and life expectancy is a full 6 years higher. Gaps across places used to converge over time, but have been much more fixed since around 1980. This interactive allows viewers to explore which indicators drive differences in the index across places.
Recent Hamilton Project analysis of geographic disparities and place-based policies include “The Geography of Prosperity,” and an edited volume of place-based policy proposals “Place-Based Policies for Shared Economic Growth.”
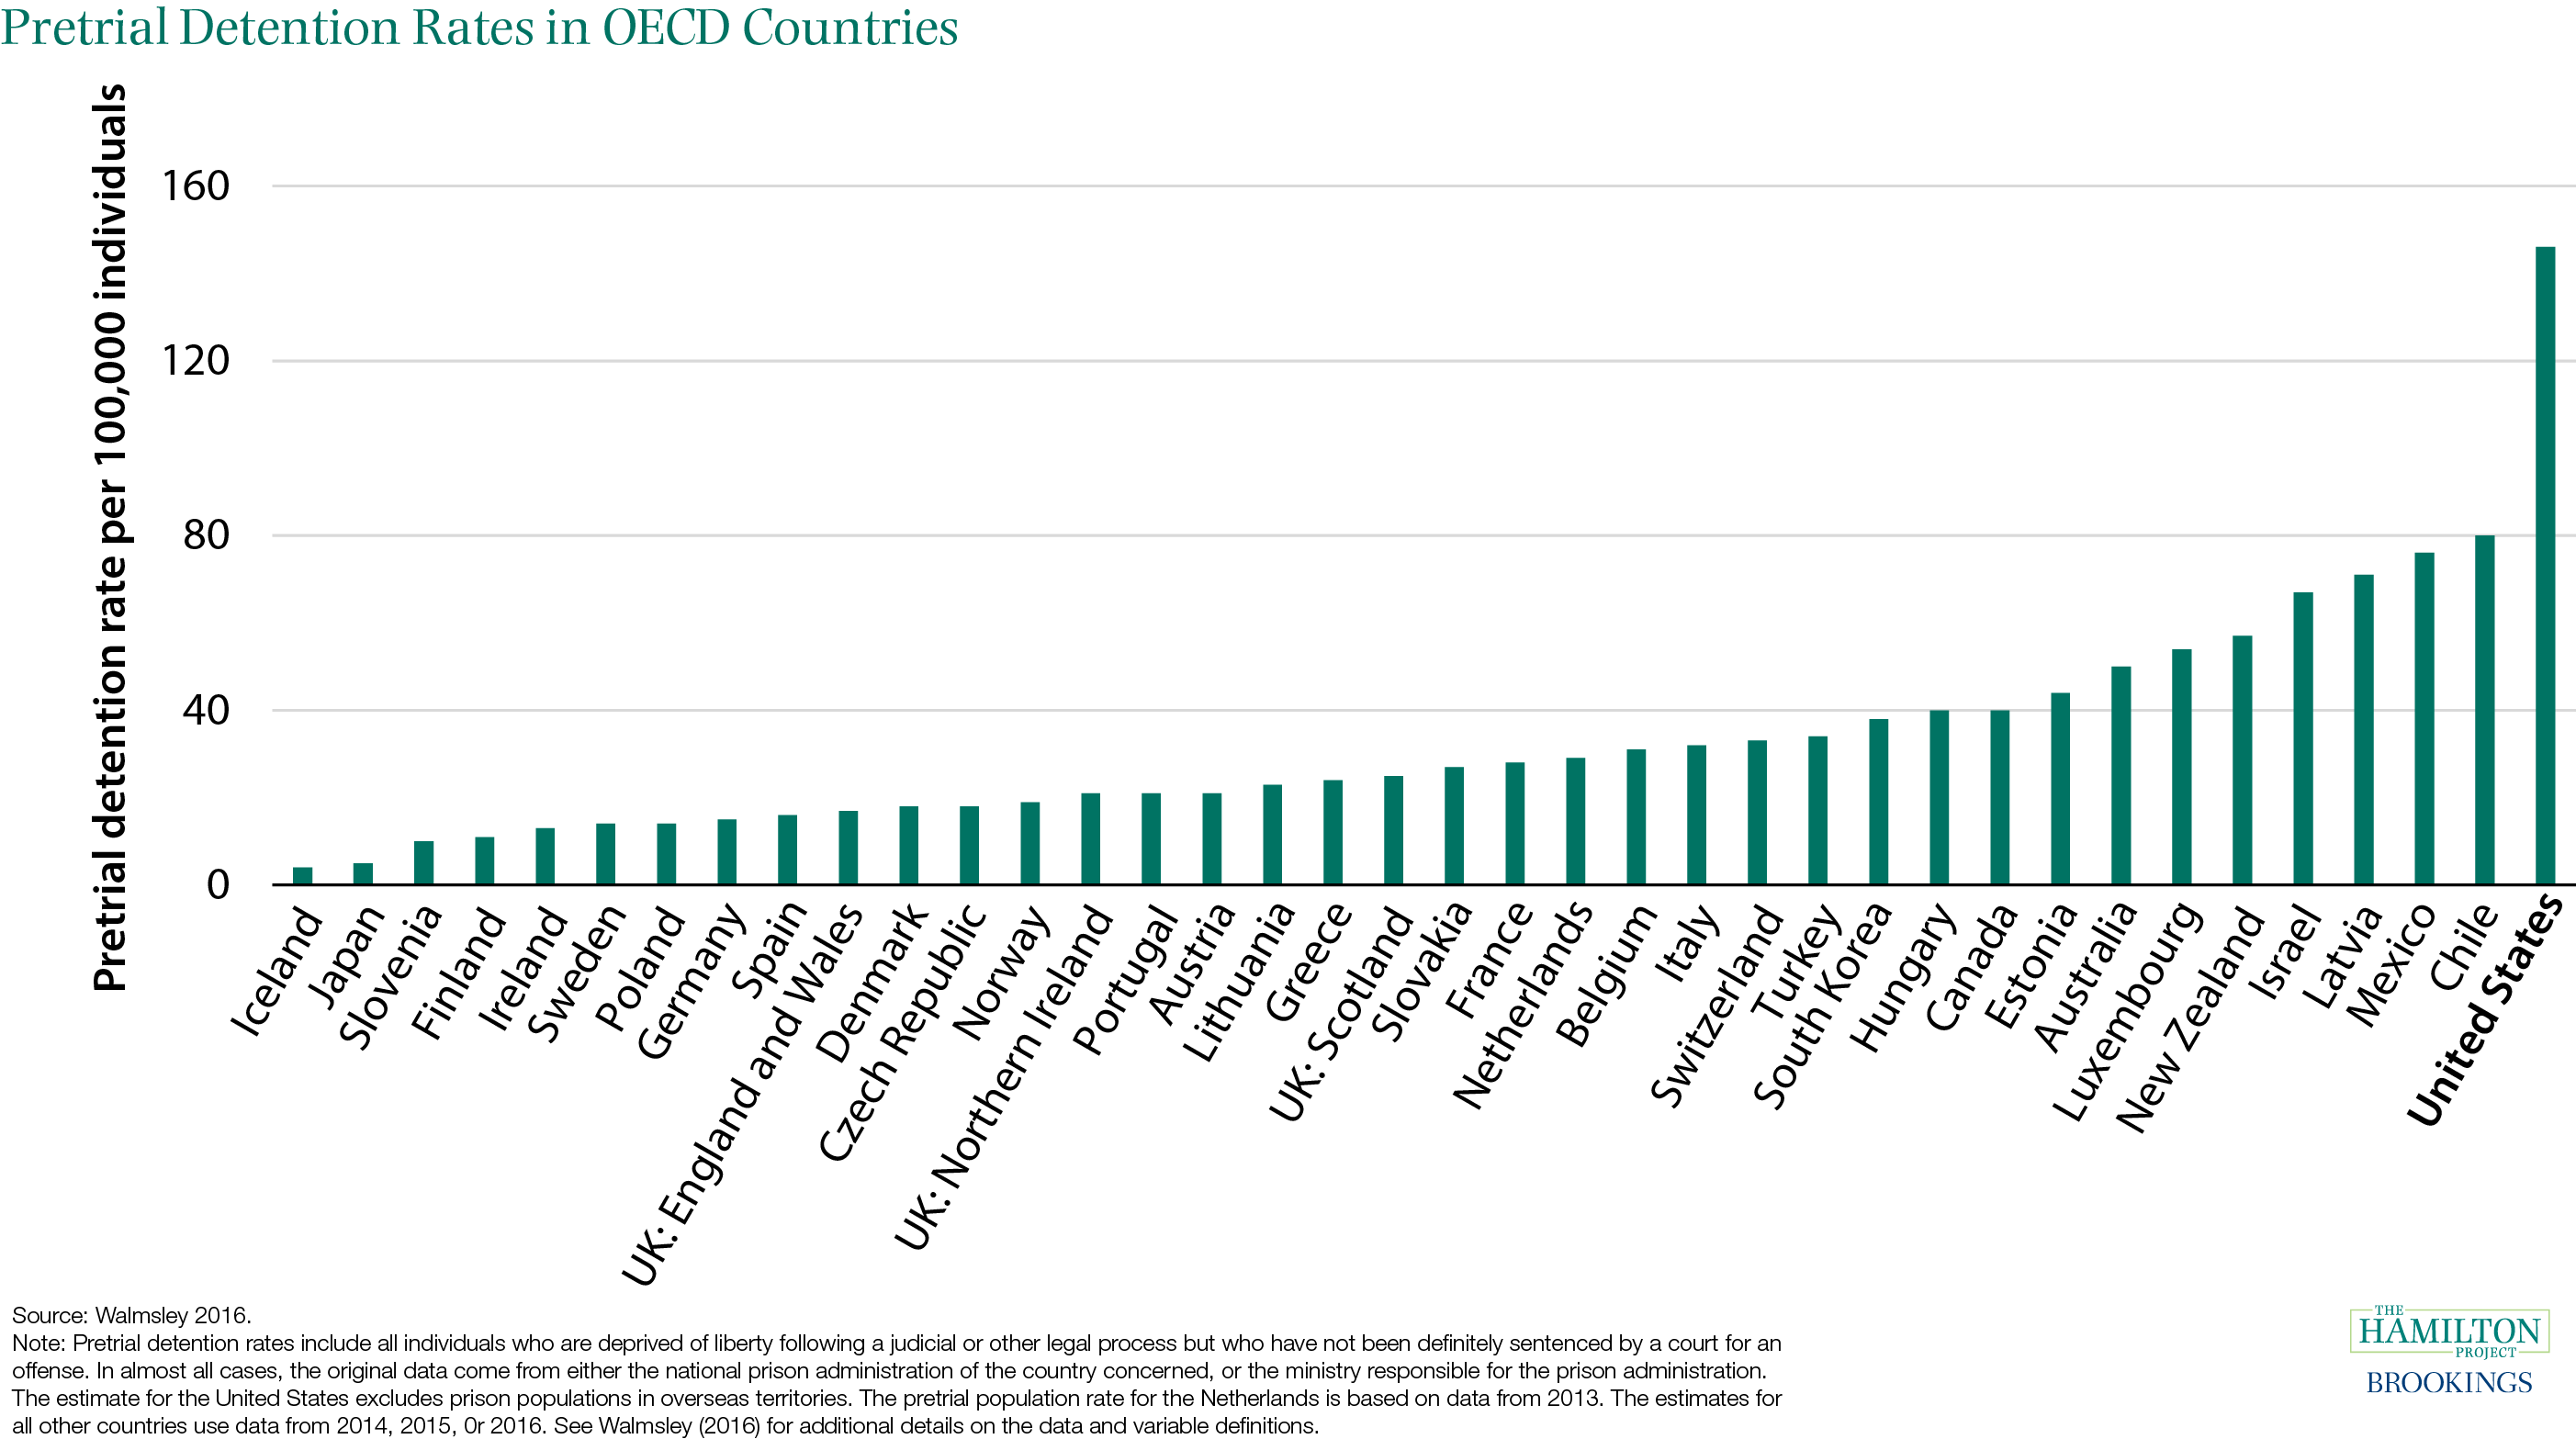
March: The U.S. pretrial detention rate is higher than in any other OECD country.
Nearly half a million people are in county and city jails despite not having been convicted of a crime. In per capita terms, the United States detains many more people before trial than other OECD countries. The high rate of pretrial detention generates substantial economic costs and additional inequities in the U.S. criminal justice system.
It is important to note that the overwhelming majority of those held pre-trial have been assigned bail (over 90 percent of felony defendants who are detained pretrial). That is, a judge has determined it is safe to release them pre-trial if they have the financial resources. But, due to a lack of funds or inability to pay the fees to private bail bondsmen, they remain incarcerated. Over the last thirty years, the share of those arrested and released without bail has declined, and the share of those incarcerated who are not convicted of a crime has increased.
A Hamilton Project proposal by Will Dobbie and Crystal Yang would reduce the reliance on pretrial detention – in particular, the reliance on cash bail — and improve pretrial decisions in the United States.
In addition to Dobbie and Yang’s proposal, The Hamilton Project released a set of economic facts titled “Nine Facts about Monetary Sanctions in the Criminal Justice System,” as well as policy proposals by Beth Colgan, “A Proposal for Income-Linked Monetary Sanctions,” and Michael Makowsky “A Proposal to End Law Enforcement as Tax Apparatus.”
April: SNAP work requirement waivers give states the flexibility needed to recover from economic downturns.
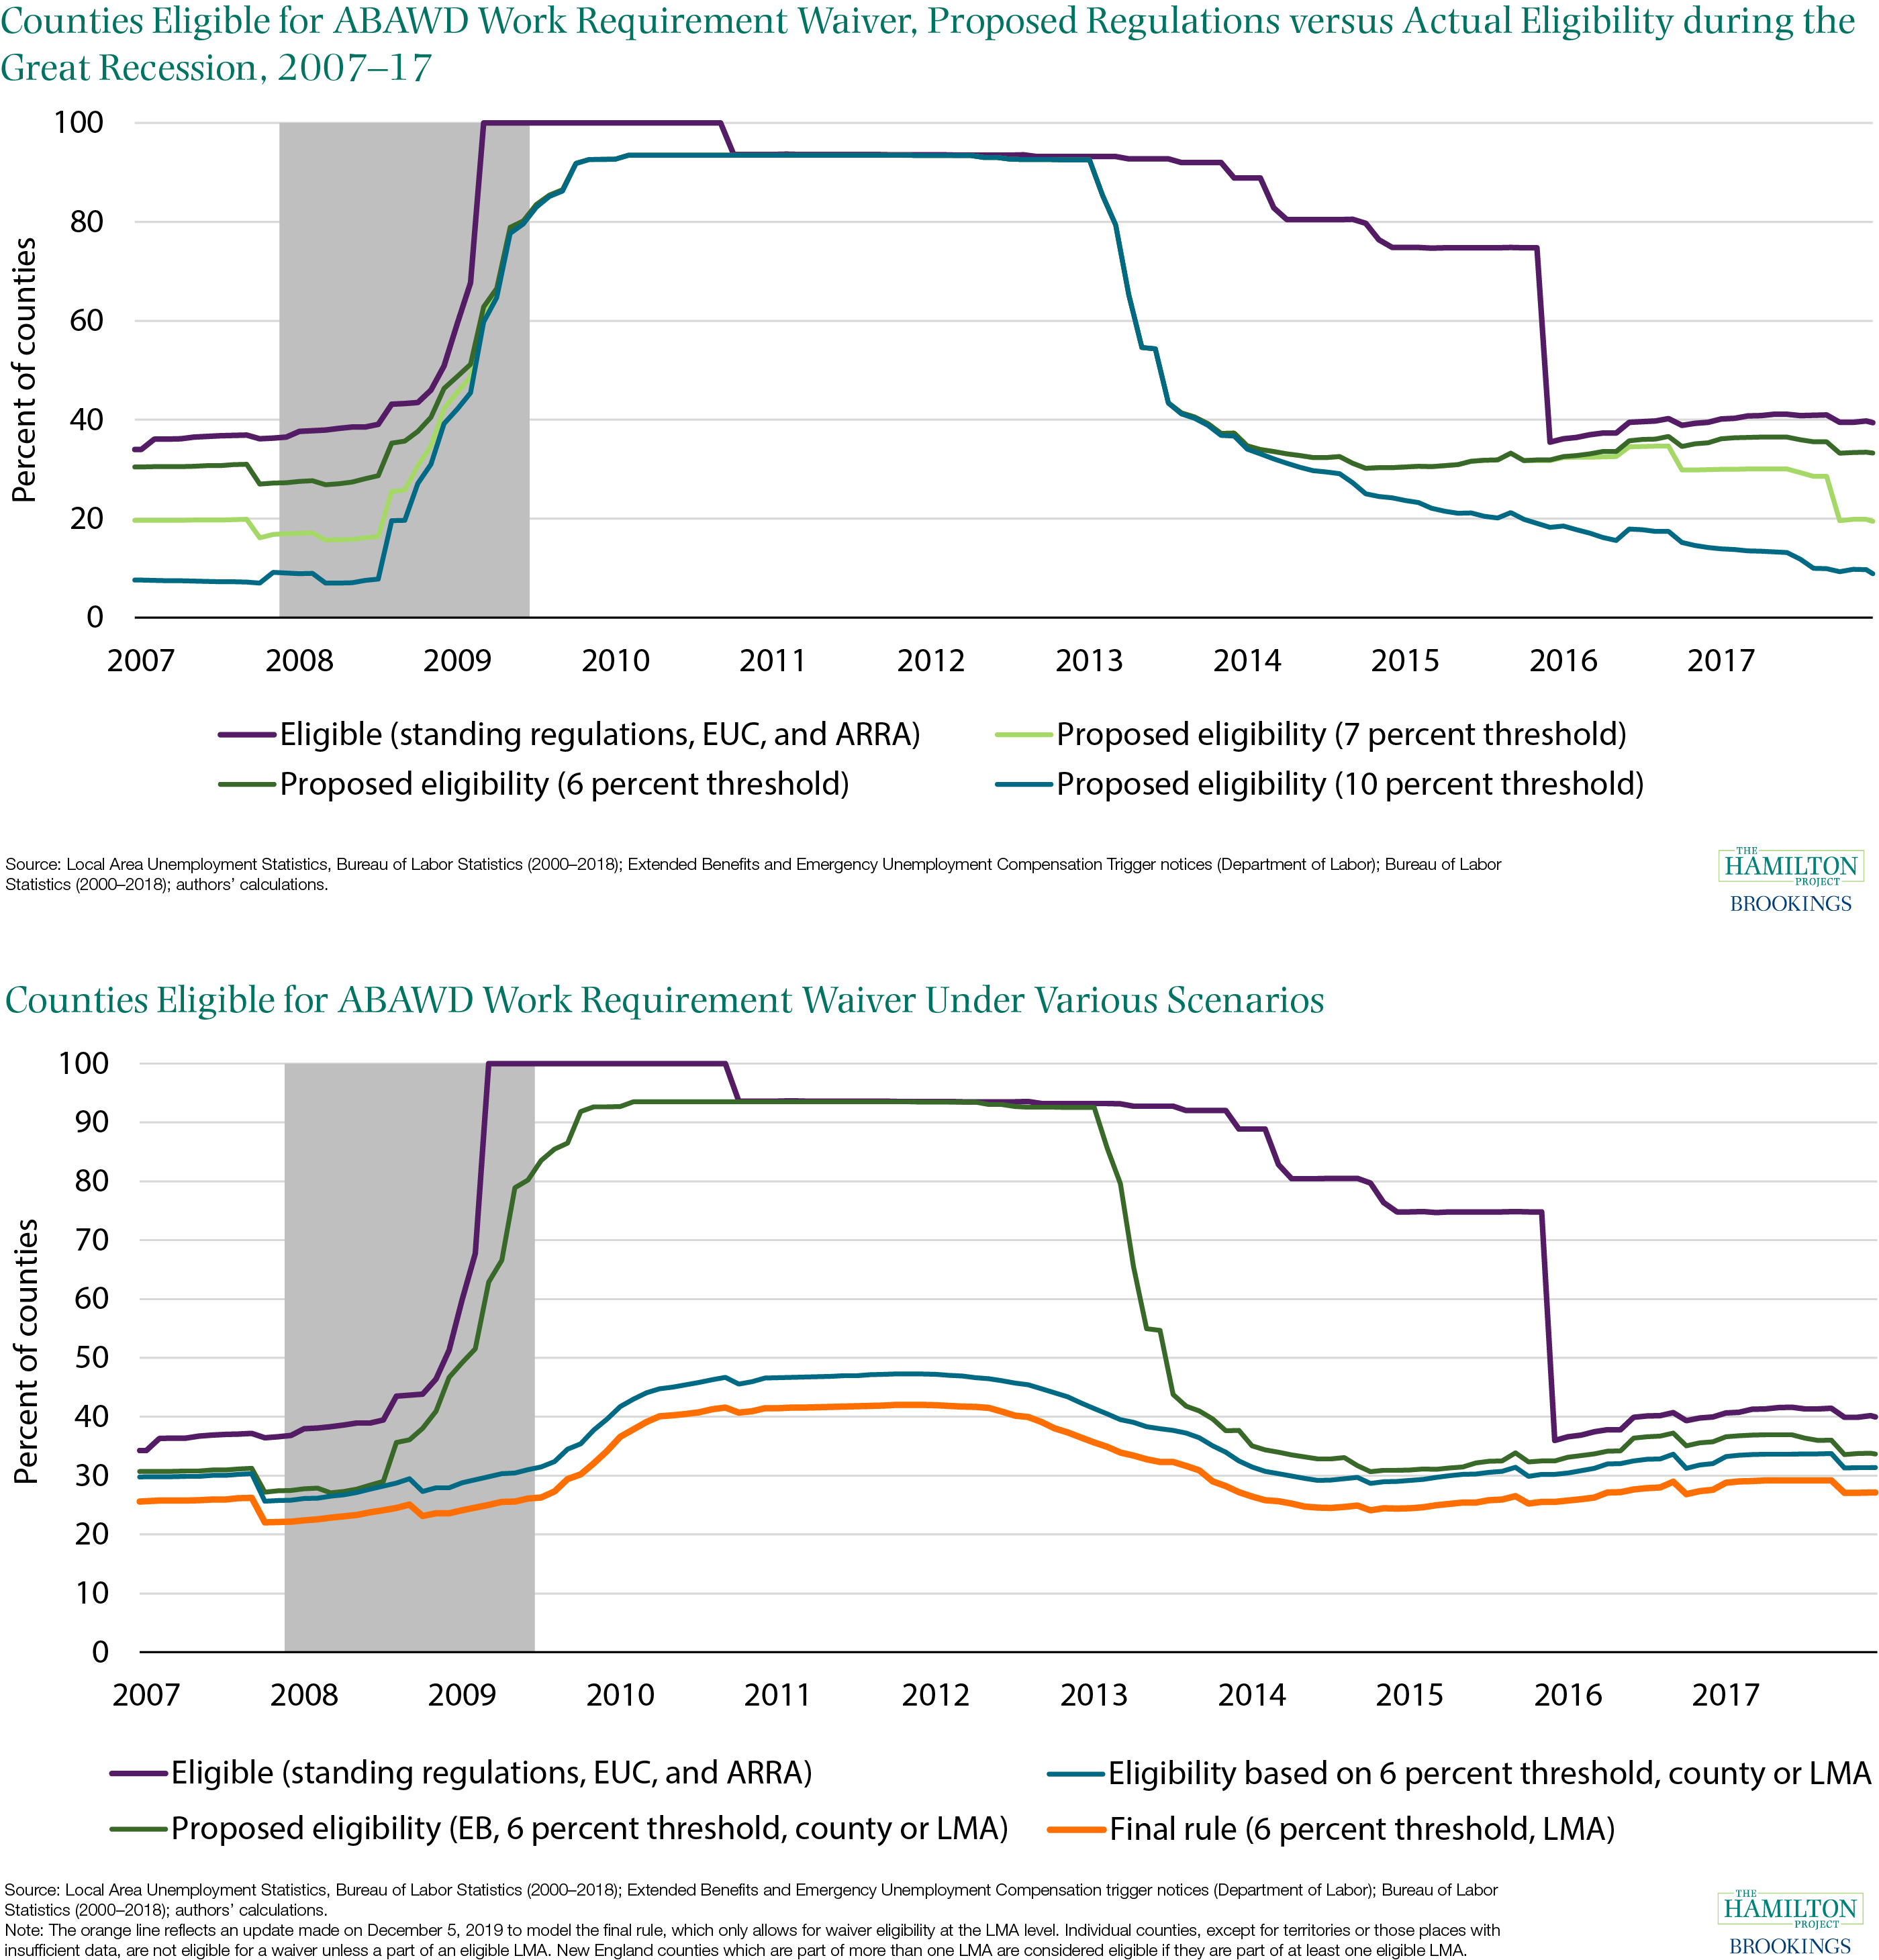
Work requirements in safety net programs can impede their ability to act as an automatic stabilizer in a recession. In the case of SNAP, there are rules that allow states to waive work requirements when local economic conditions are poor. An economic analysis from The Hamilton Project models how newly proposed work requirement rules would have functioned during the 2008 recession. The purple line represents how many counties were eligible for this work requirement waiver under current regulations, while the green lines represent USDA-proposed adjustments. These proposed eligibility thresholds would have diminished SNAP’s role as a fiscal stabilizer and as a social safety net during the Great Recession, especially at its onset.
In December, The Hamilton Project released an analysis in response to a final rule released by the USDA. The analysis found that the final rule would respond even more slowly to recessions than the earlier proposed rule: fewer than 30 percent of counties would have been eligible for waivers during the Great Recession. Though the majority of non-disabled SNAP recipients are in the labor force, they would potentially fail to meet the work requirement due to unstable employment and hours, as well as burdensome paperwork requirements. There is no evidence that work requirements in SNAP meaningfully lift employment.
Related Hamilton Project research on work requirements includes “Work Requirements and Safety Net Programs,” “Who Loses SNAP Benefits If Additional Work Requirements Are Imposed? Workers,” and “Workers Could Lose SNAP Benefits Under Trump’s Proposal Rule.”
May: Fiscal policies can act as effective automatic stabilizers, limiting the damage caused by recessions.
A book by The Hamilton Project and The Washington Center on Equitable Growth, “Recession Ready: Fiscal Policies to Stabilize the American Economy,” examines how automatic fiscal policy can help respond to the next recession. The book outlines the damages caused by recessions, as shown in the figure below, including hundreds of billions of dollars in lost output and millions unemployed. Recessions typically place a larger burden on more vulnerable populations and can have long lasting effects. The book also contains a range of policy proposals to efficiently and quickly spur a recovery when the next recession strikes. In the previous seven recessions, the Federal Reserve has reduced interest rates by at least 5 percentage points. Because interest rates are currently close to zero, it will not have as much traditional policy ammunition when the next downturn strikes, making a more substantial use of fiscal policy crucial.
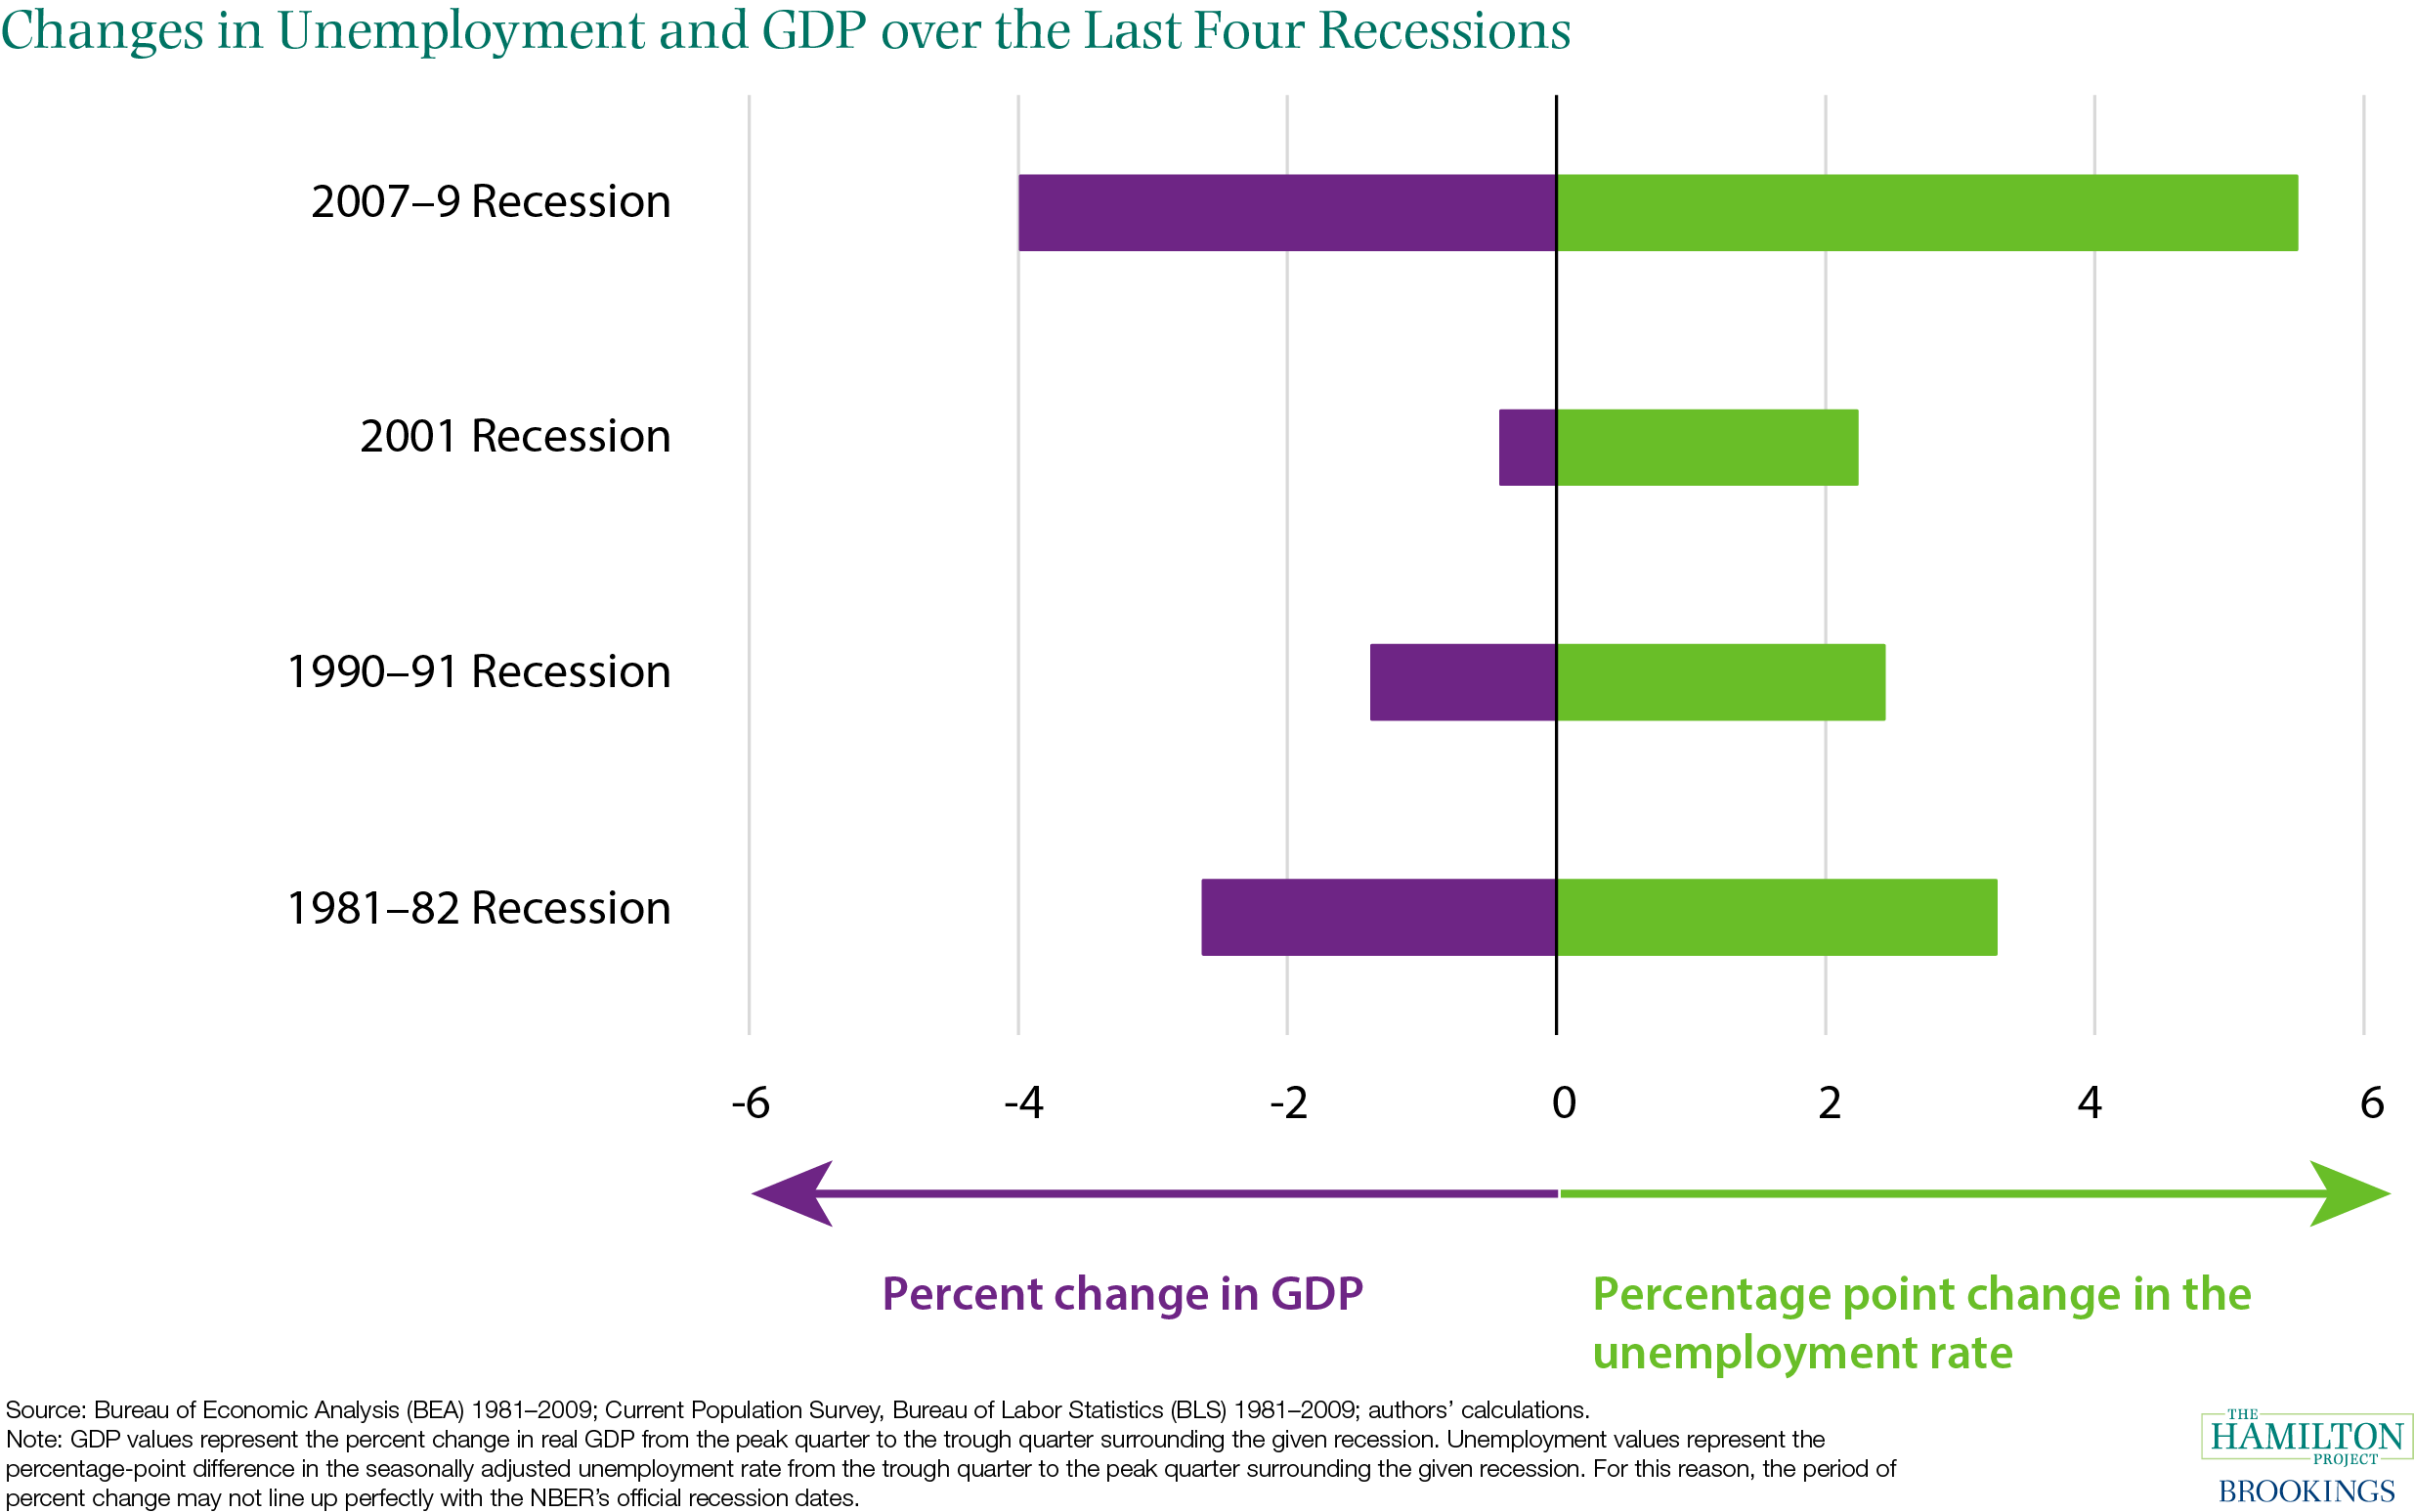
This figure comes from the first chapter of Recession Ready, “The Damage Done by Recessions and How to Respond,” published by The Hamilton Project and Washington Center for Equitable Growth.
June: Sahm Indicator shows when the United States is in a recession, allowing timely use of fiscal stimulus.
Waiting for the National Bureau of Economic Research to announce a recession (or alternatively waiting for GDP to decline over two consecutive periods) may be appropriate for historical analysis but it is too slow to be useful for monetary or fiscal policy response.
“The Sahm Recession Indicator,” created by economist Claudia Sahm, provides a reliable and timely means of identifying downturns: if the three-month average of the unemployment rate is at least 0.50 percentage points above its minimum from the previous 12 months, then the economy is already in a recession. The Sahm rule shows that fiscal policies based on economic indicators can be timely, reliable, and provide an important economic offset to the beginning of a recession. The Sahm Indicator was first introduced in a Hamilton Project—Washington Center for Equitable Growth policy proposal, “Direct Stimulus Payments to Individuals,” where Sahm proposed using this indicator to trigger stimulus payments to individuals when the economy is in a recession.
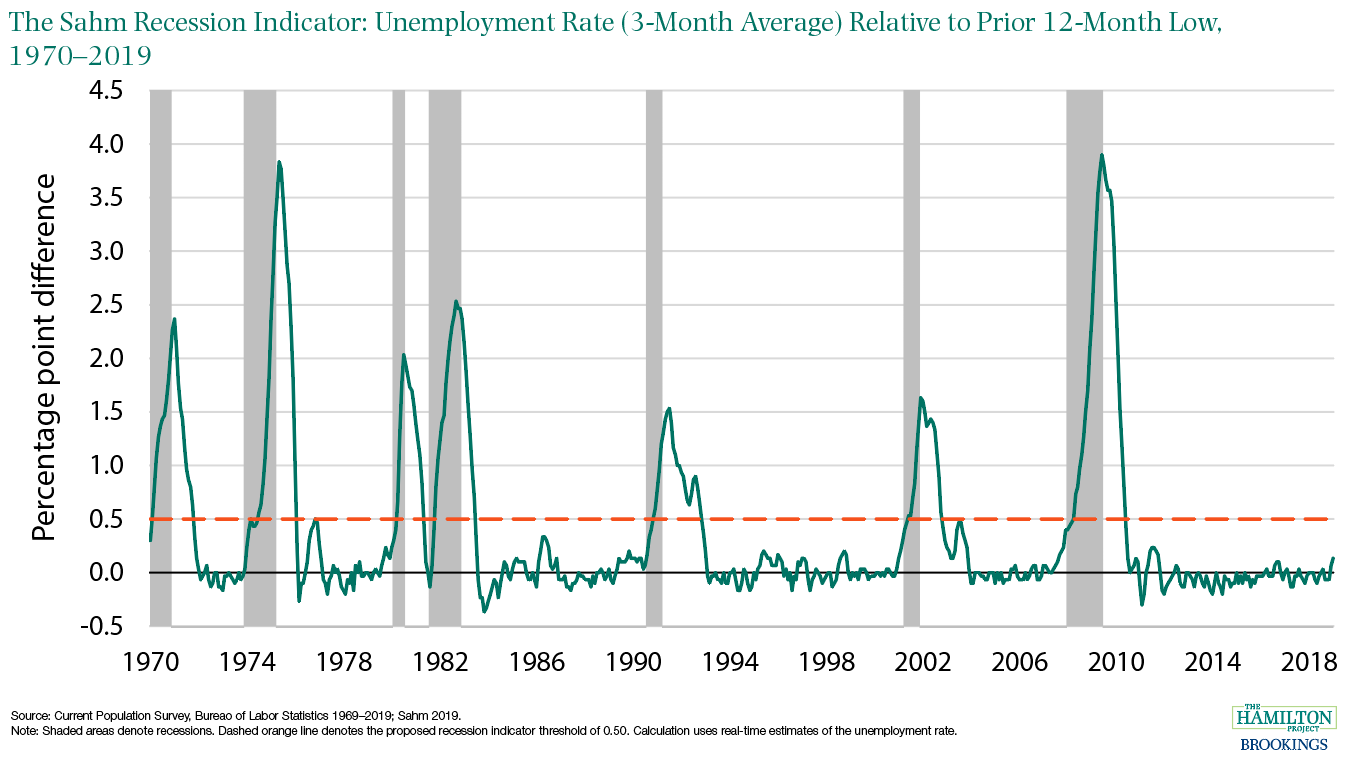
A Hamilton Project blog post—updated monthly—analyzes how the Sahm Indicator can be used to provide additional guidance on when the next recession will come.
July: All school and no work is becoming the norm for American teens.
From 2000 to 2018, the labor force participation rate of 16- to 64-year-olds fell 3.6 percentage points. Teenagers contributed 37 percent of the decline in the aggregate working-age labor force participation rate as their own participation rate fell sharply from 50 to 33 percent. While declining summer employment is part of the story, the figure below shows that the bulk of the teenage reduction in labor force participation comes from fewer teenagers being jointly enrolled in school and participating in the labor force during the academic year. A Hamilton Project blog post looks at the changing ways in which American teens spend their time.
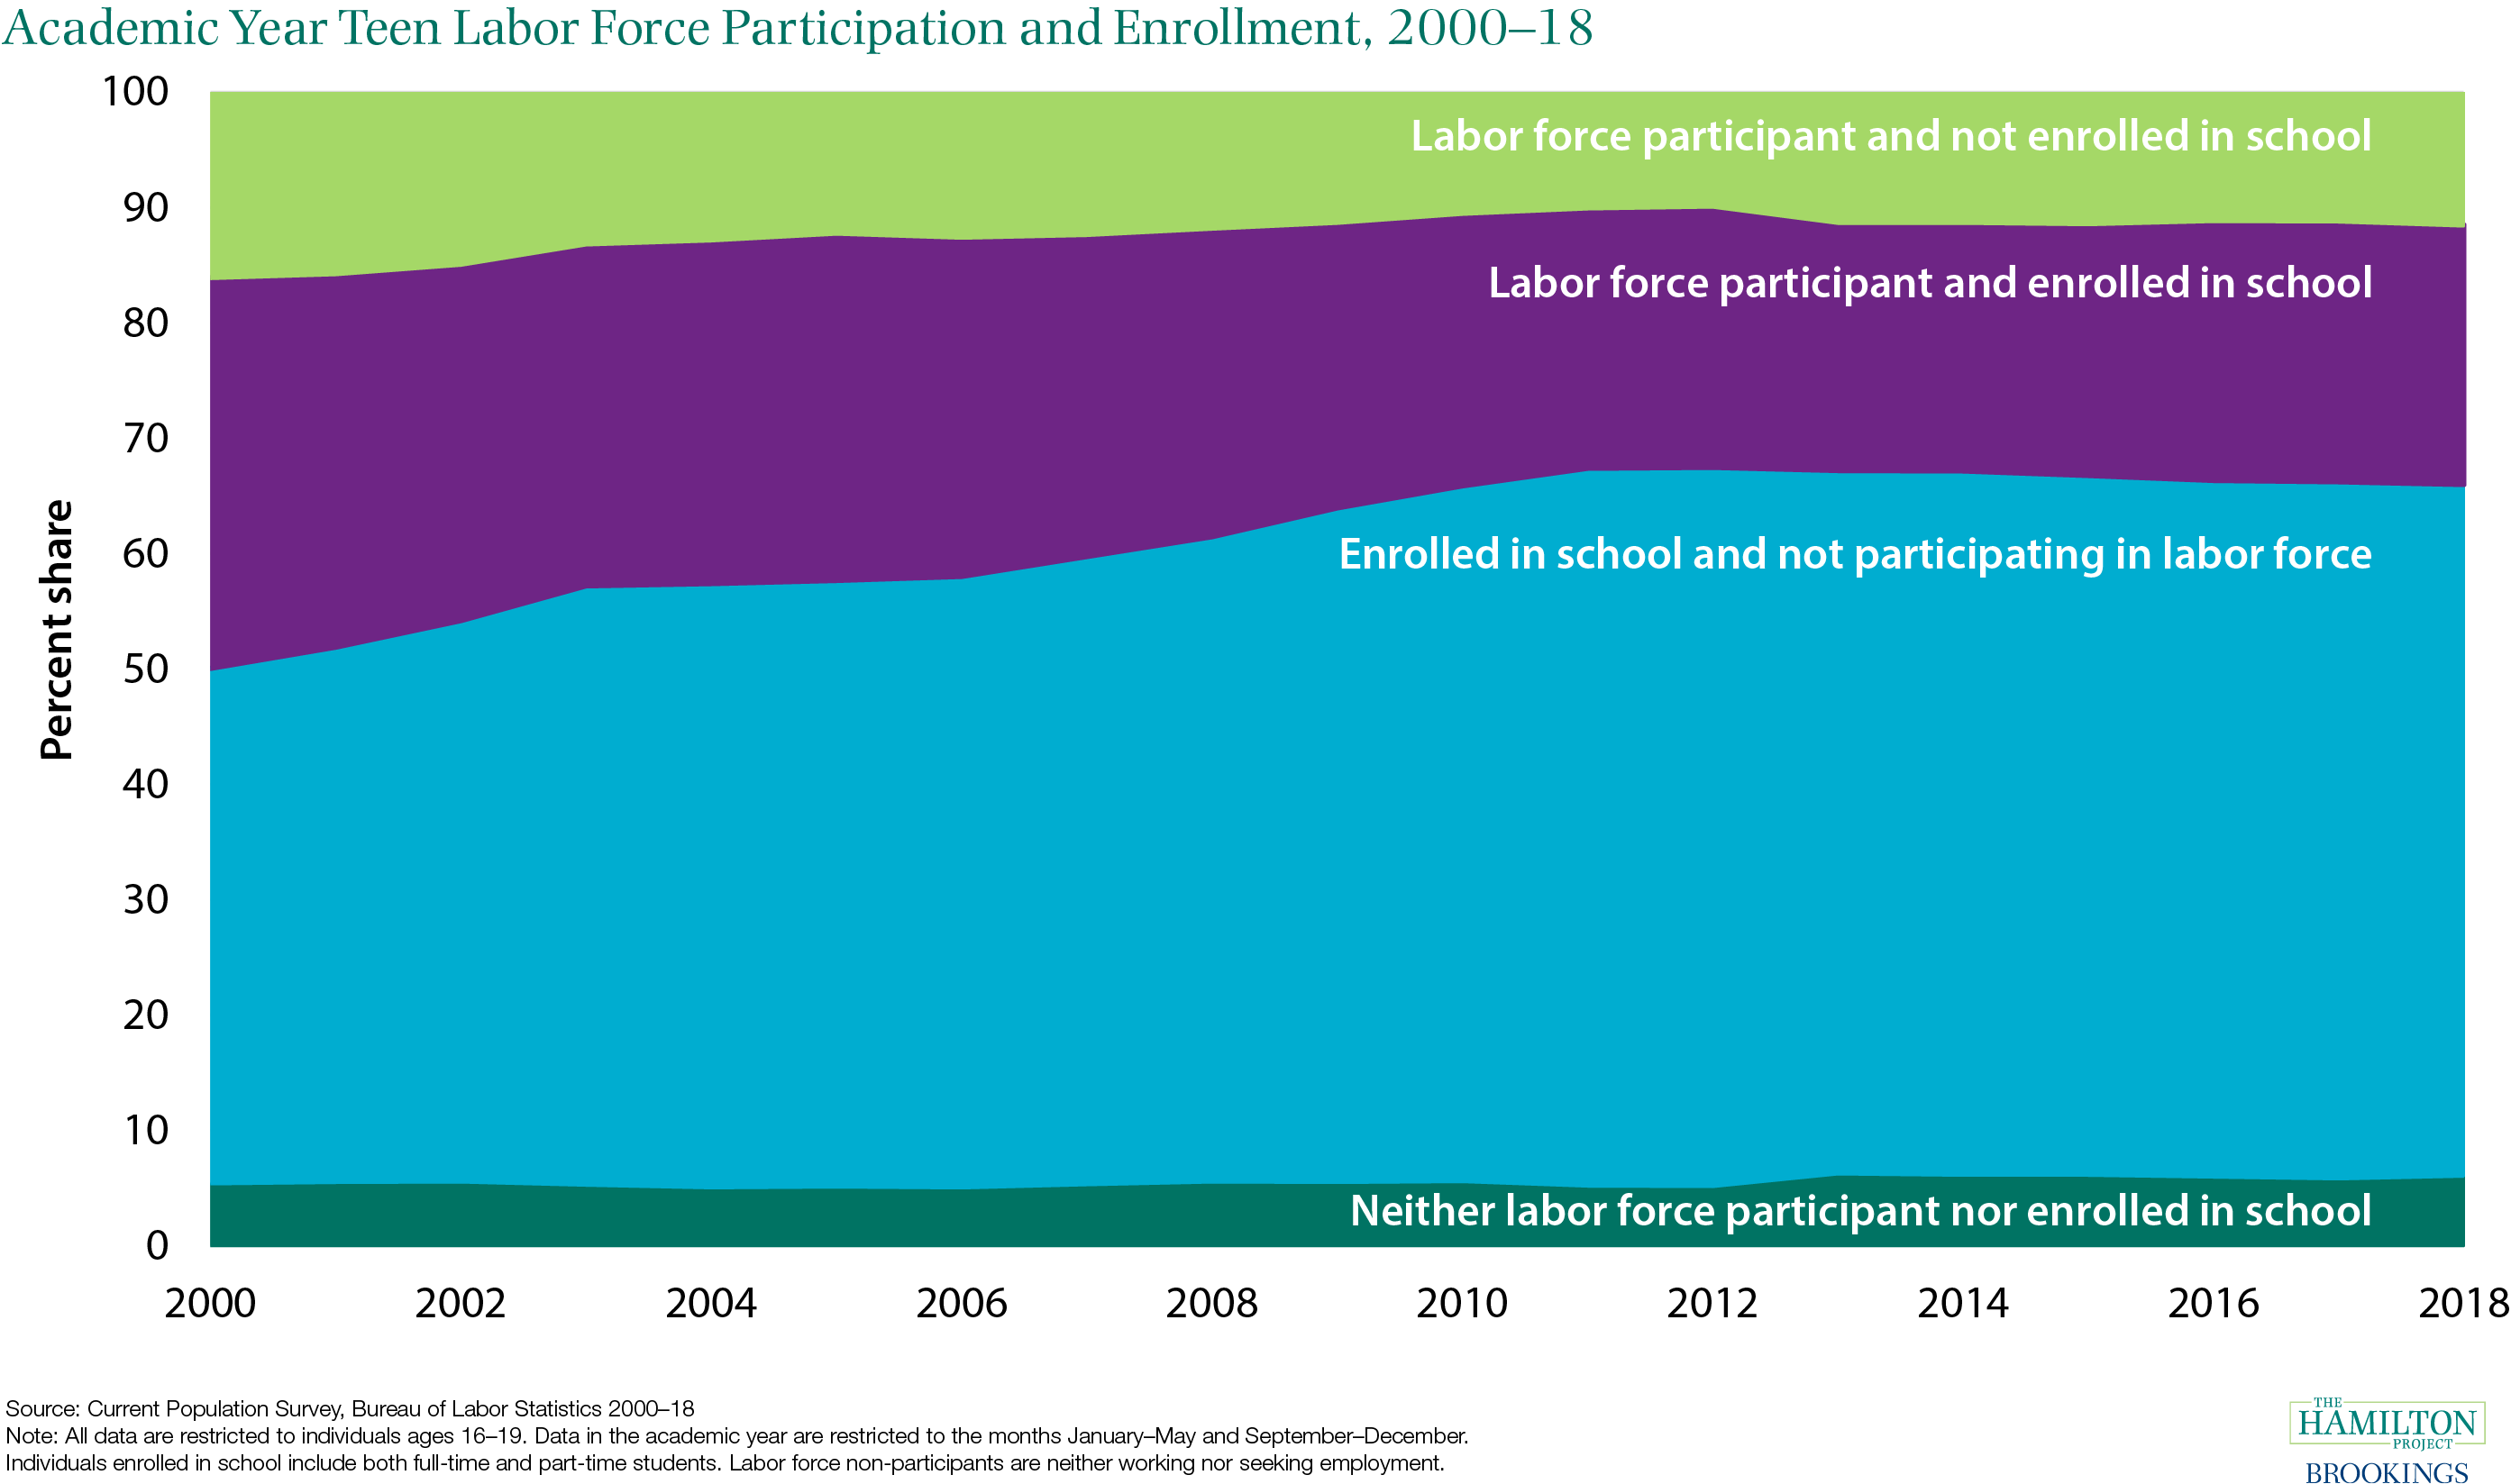
The Hamilton Project expanded upon this work in the economic analysis, “Employment, Education, and the Time Use of American Youth.”
August: Declining private sector union participation has weakened labor market outcomes for many workers.
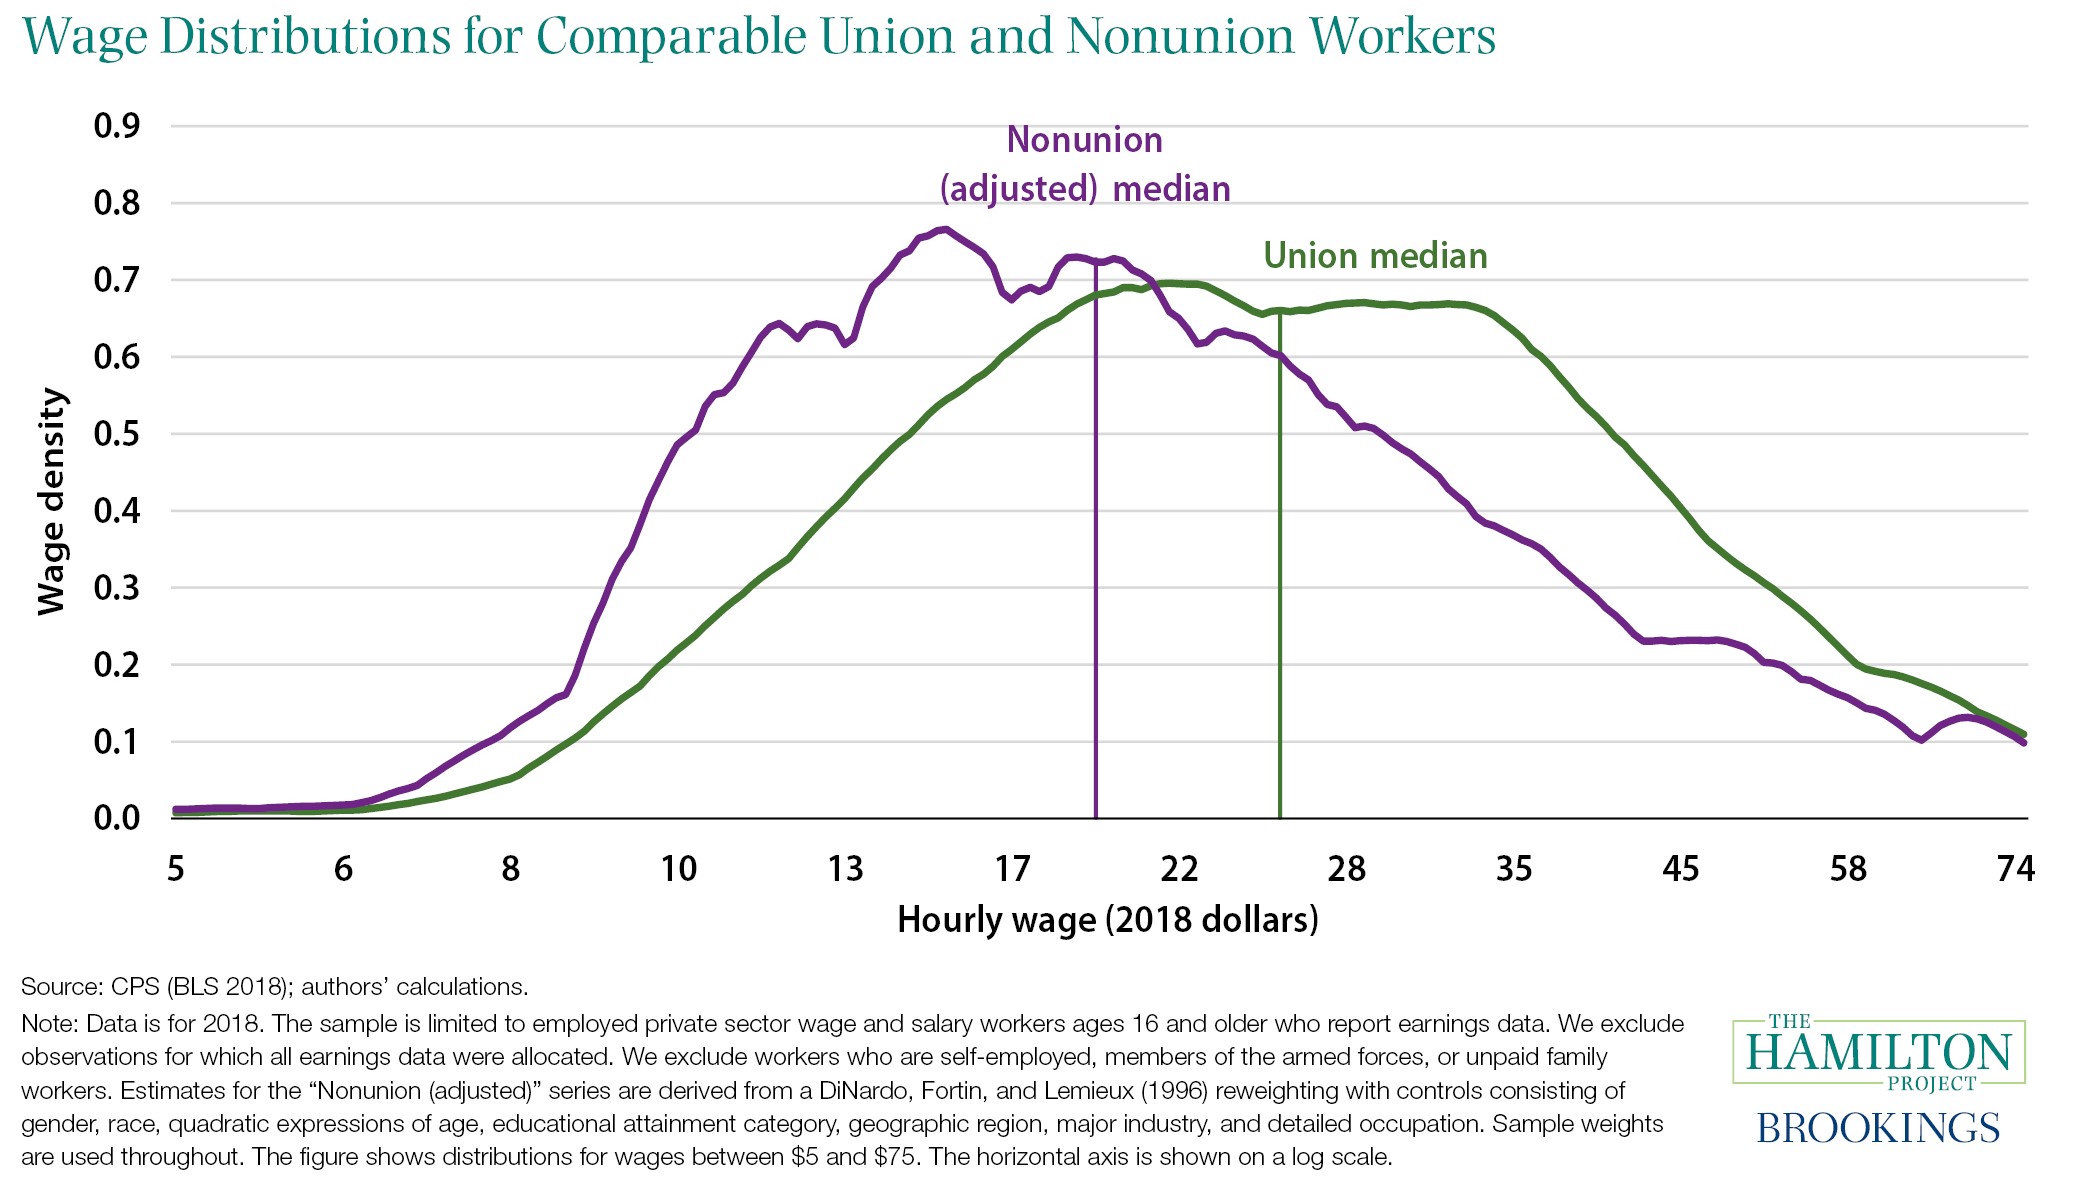
In the middle of the 20th century, more than 30 percent of U.S. workers were members of a union; today that number is only 10.5 percent. A Hamilton Project analysis described the reasons for this decline and the evidence about labor market effects of private sector unions. Private sector union rates have not declined just because of sectoral shifts (fewer high-union manufacturing jobs and more non-union service jobs) nor because of a shift of population towards less unionized states. Instead, there has been a decline in union rates across nearly all states and industries. This decline in union rates can be important because of the important bargaining role unions play. As shown below, the median hourly wage for workers covered by a union contract is $25.00, whereas workers not covered by a union contract (after adjusting for differences in their observable characteristics) have a median wage of $19.23. The wage gap is especially large in the low and middle parts of the distribution.
Hamilton Project policy proposals have addressed employer practices that limit worker bargaining power. Two of those proposals are “Strengthening Labor Standards and Institutions to Promote Wage Growth,” by Heidi Shierholz and “A Proposal for Protecting Low-Income Workers from Monopsony and Collusion,” by Alan Krueger and Eric Posner.
September: Chronic absence can be used to identify and improve school conditions for learning.
Just in time for the back-to-school season, The Hamilton Project launched an interactive that shows the rate of chronic absence and relevant school and community factors that affect learning for every elementary, middle, and high school across the country. The interactive accompanies the report “Using Chronic Absence Data to Improve Conditions for Learning” that Hamilton Project Fellow Lauren Bauer co-authored with Hedy N. Chang, David Osher, Mara Schanfield, and Jane Sundius. These resources jointly explain the problem of chronic absence and highlight actionable paths forward for school leaders and policymakers working toward improving school conditions for learning.
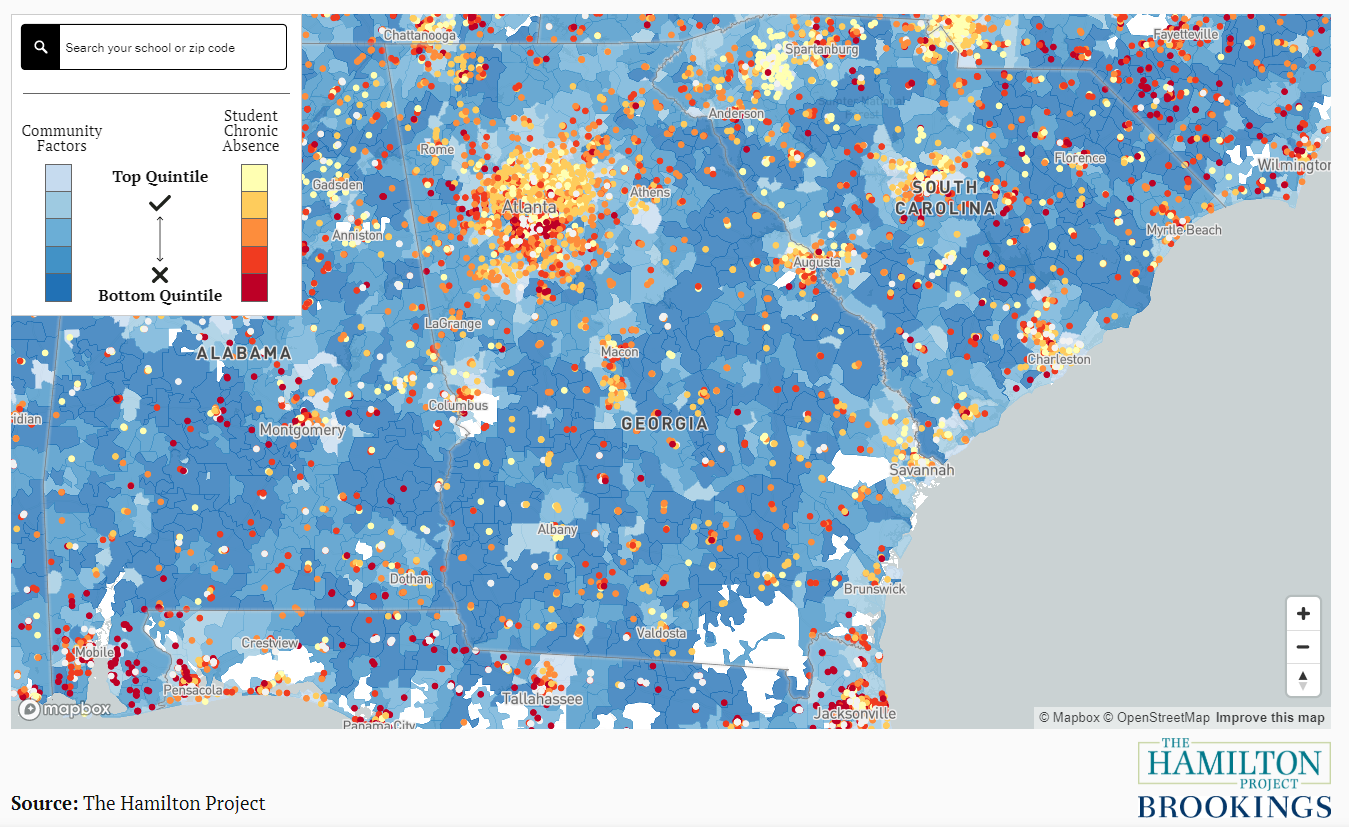
The Hamilton Project has released two strategy papers on chronic absence: “Lessons for Broadening School Accountability under the Every Student Succeeds Act” and “Reducing Chronic Absenteeism under the Every Student Succeeds Act.” Other Hamilton Project data interactives on chronic absence include “Chronic Absence across the United States, 2015-16 School Year” and “Chronic School Absenteeism in the United States.”
October: Struggling U.S. counties will be hit hardest by climate change.
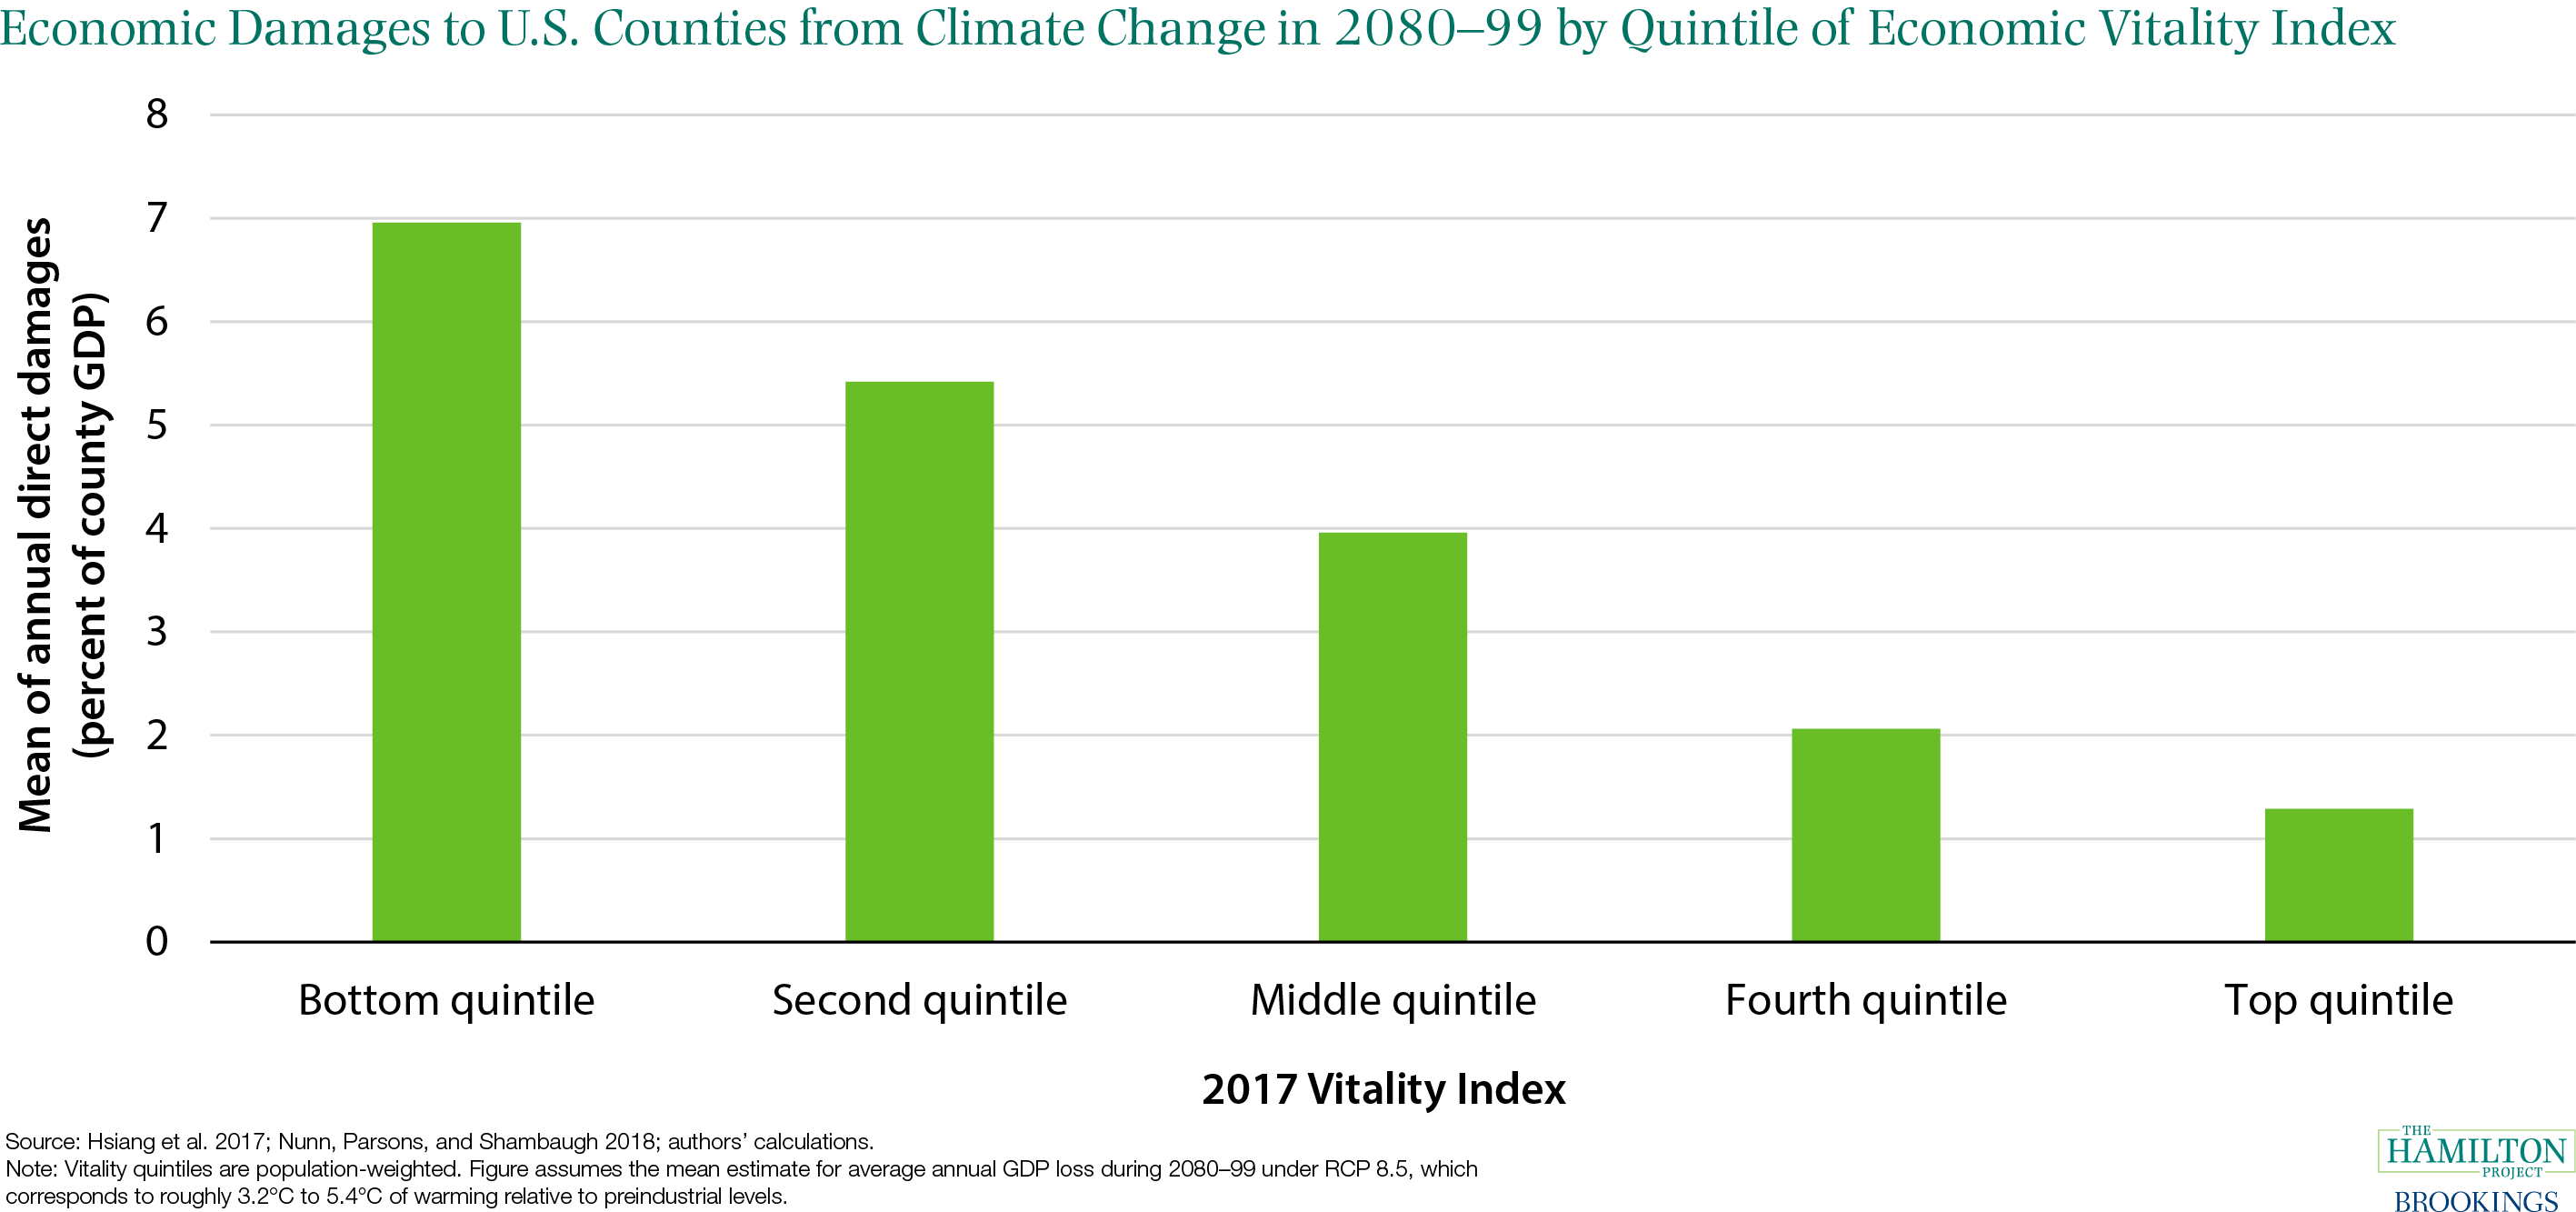
In a set of economic facts, The Hamilton Project and the Stanford Institute for Economic Policy Research found that the effects of climate change will not be shared evenly across the United States. Places that already have weaker economies (particularly those in the Southeast and Southwest) will tend to be hit the hardest by the effects of climate change, as shown in the figure below. The figure shows the direct damages from climate change across counties sorted by the Hamilton Project’s Vitality index (which ranks counties based on an index combining household income, labor market outcomes, poverty, and life expectancy). The concentration of climate damages in the South and among low-income Americans implies a disproportionate impact on Black, Latino, and indigenous communities.
Recent Hamilton Project proposals addressing climate change include “Market-Based Clean Performance Standards as Building Blocks for Carbon Pricing” by Carolyn Fischer, “How to Change U.S. Climate Policy after There is a Price on Carbon” by Roberton Williams III, and “Promoting Innovation for Low-Carbon Technologies” by David Popp.
November: To raise the national labor force participation rate, policymakers should address the impediments to participation for different groups.
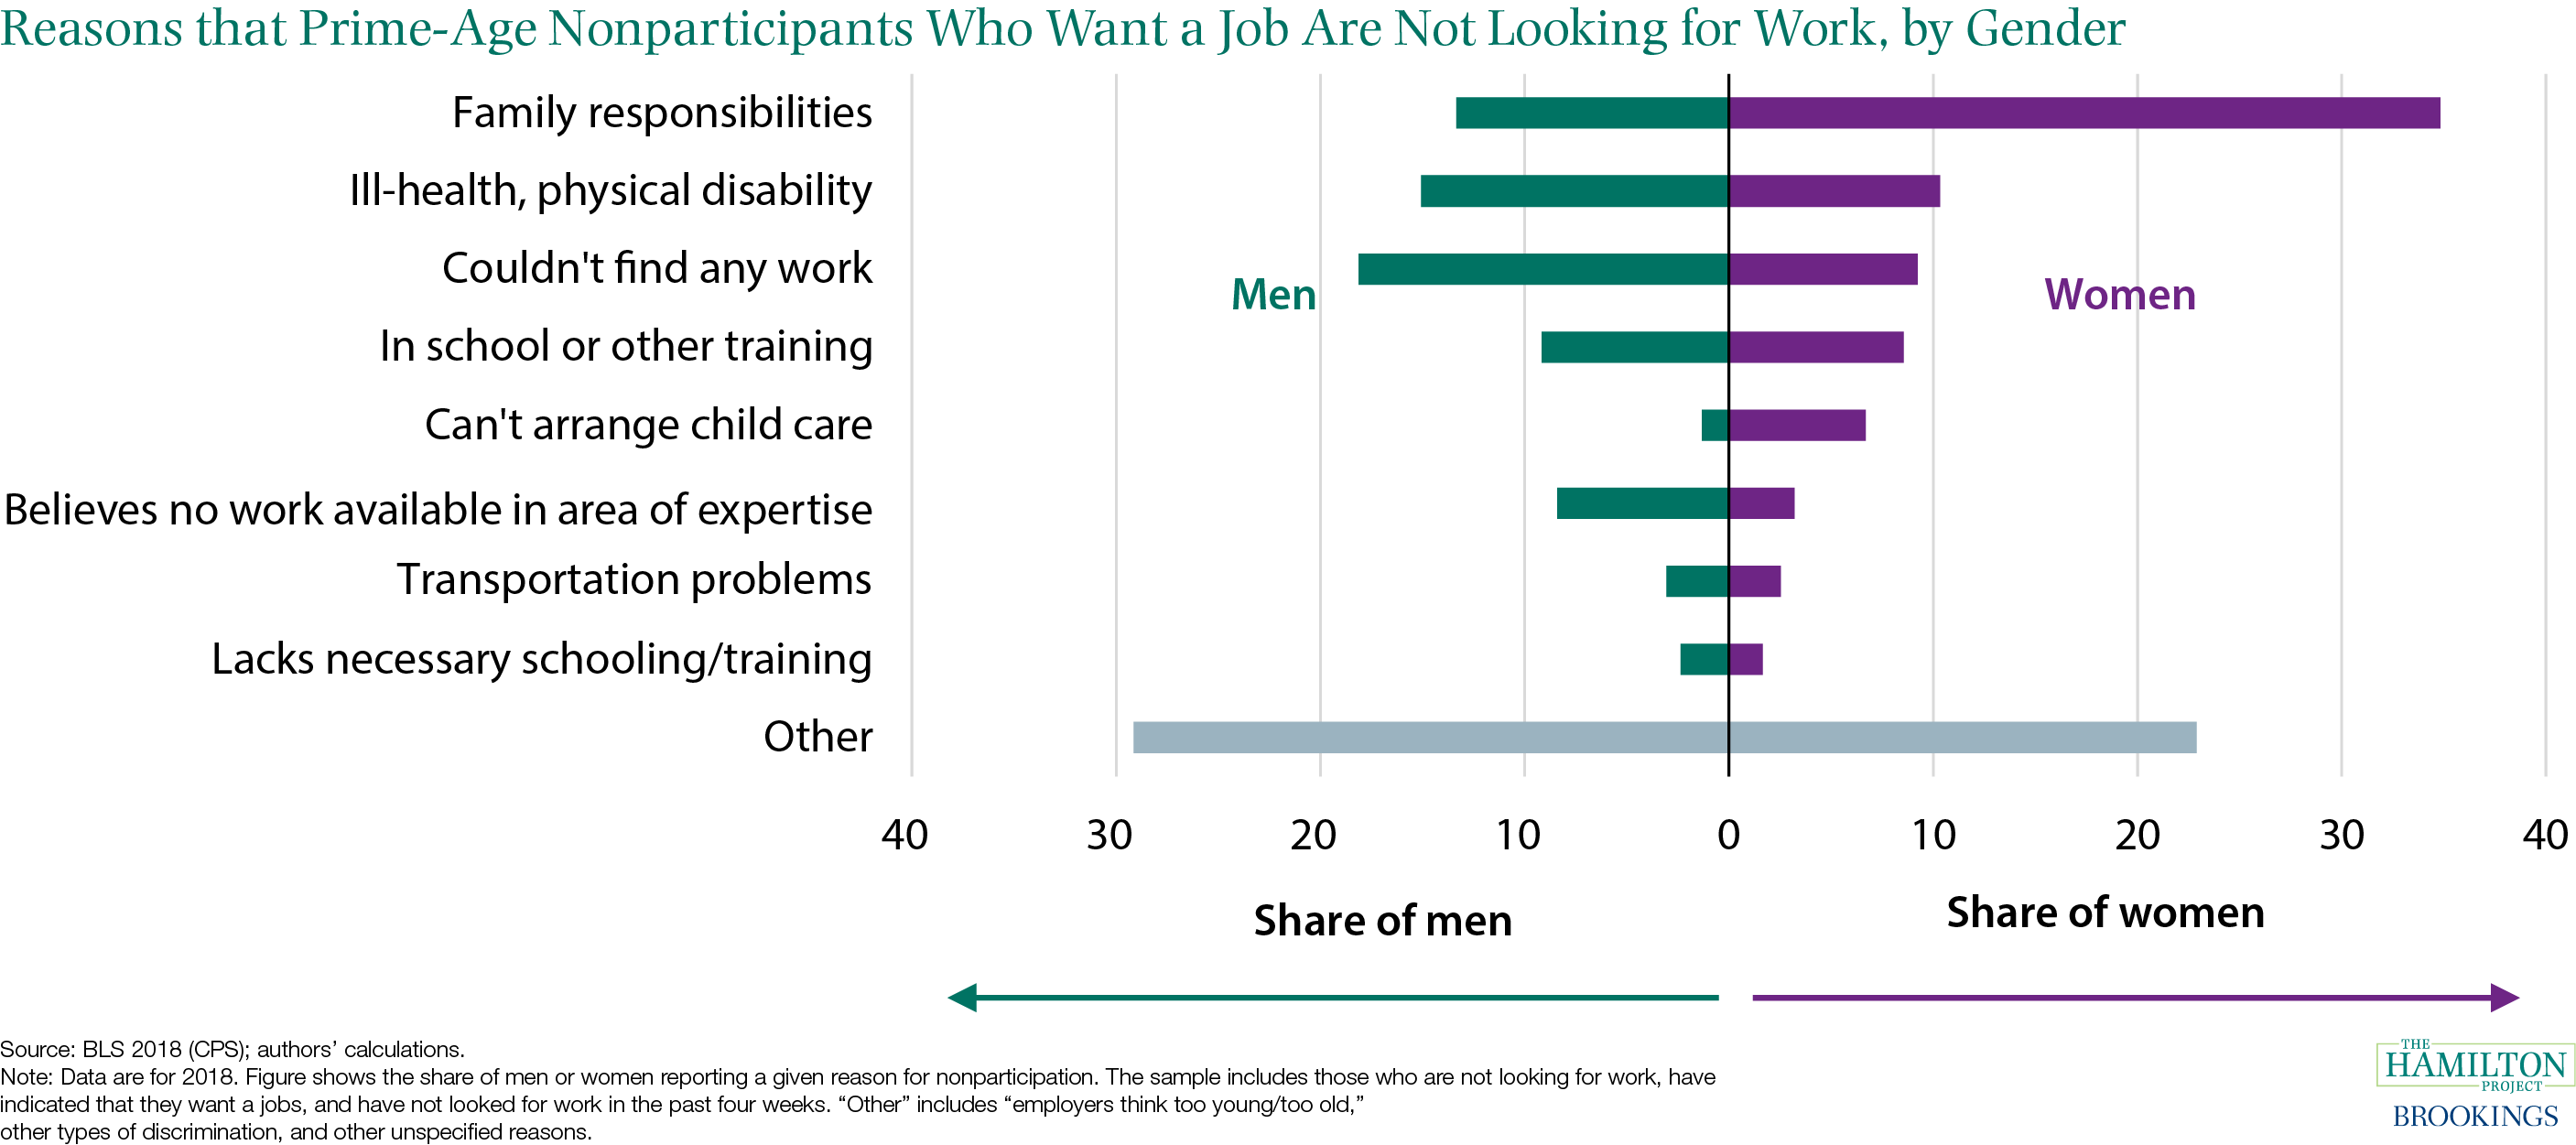
U.S. labor force participation has declined over the last two decades, partly due to an aging population. A weak economy is also a factor in declining labor force participation, however as the job market strengthened, participation has been rebounding since around 2015. But, U.S. labor force participation rates also vary widely across groups, as do the reasons that keep some out of the labor force. The figure below examines the 1.8 million prime-age nonparticipants who report wanting a job, finding that more than a third of women and about one in seven men report family responsibilities as their reason for nonparticipation.
A Hamilton Project strategy paper examines barriers that have prevented broad-based participation. It concludes that to target the barriers listed below, reducing the tax penalty for working spouses, providing earned sick leave, and improving child-care subsidies, among other policy reforms, would enable more people to pursue work. Maintaining a robust economy, raising skills and returns to work for those with less education, and targeting geographic disparities are other important policy levers.
Recent Hamilton Project books provide many proposals for increasing labor force participation rates, including “Place-Based Policies for Shared Economic Growth,” “The 51%: Driving Growth through Women's Economic Participation,” and “Revitalizing Wage Growth: Policies to Get American Workers a Raise.”
December: The official child poverty rate has fallen to pre-recession levels, while a large share of children have a parent in the labor force.
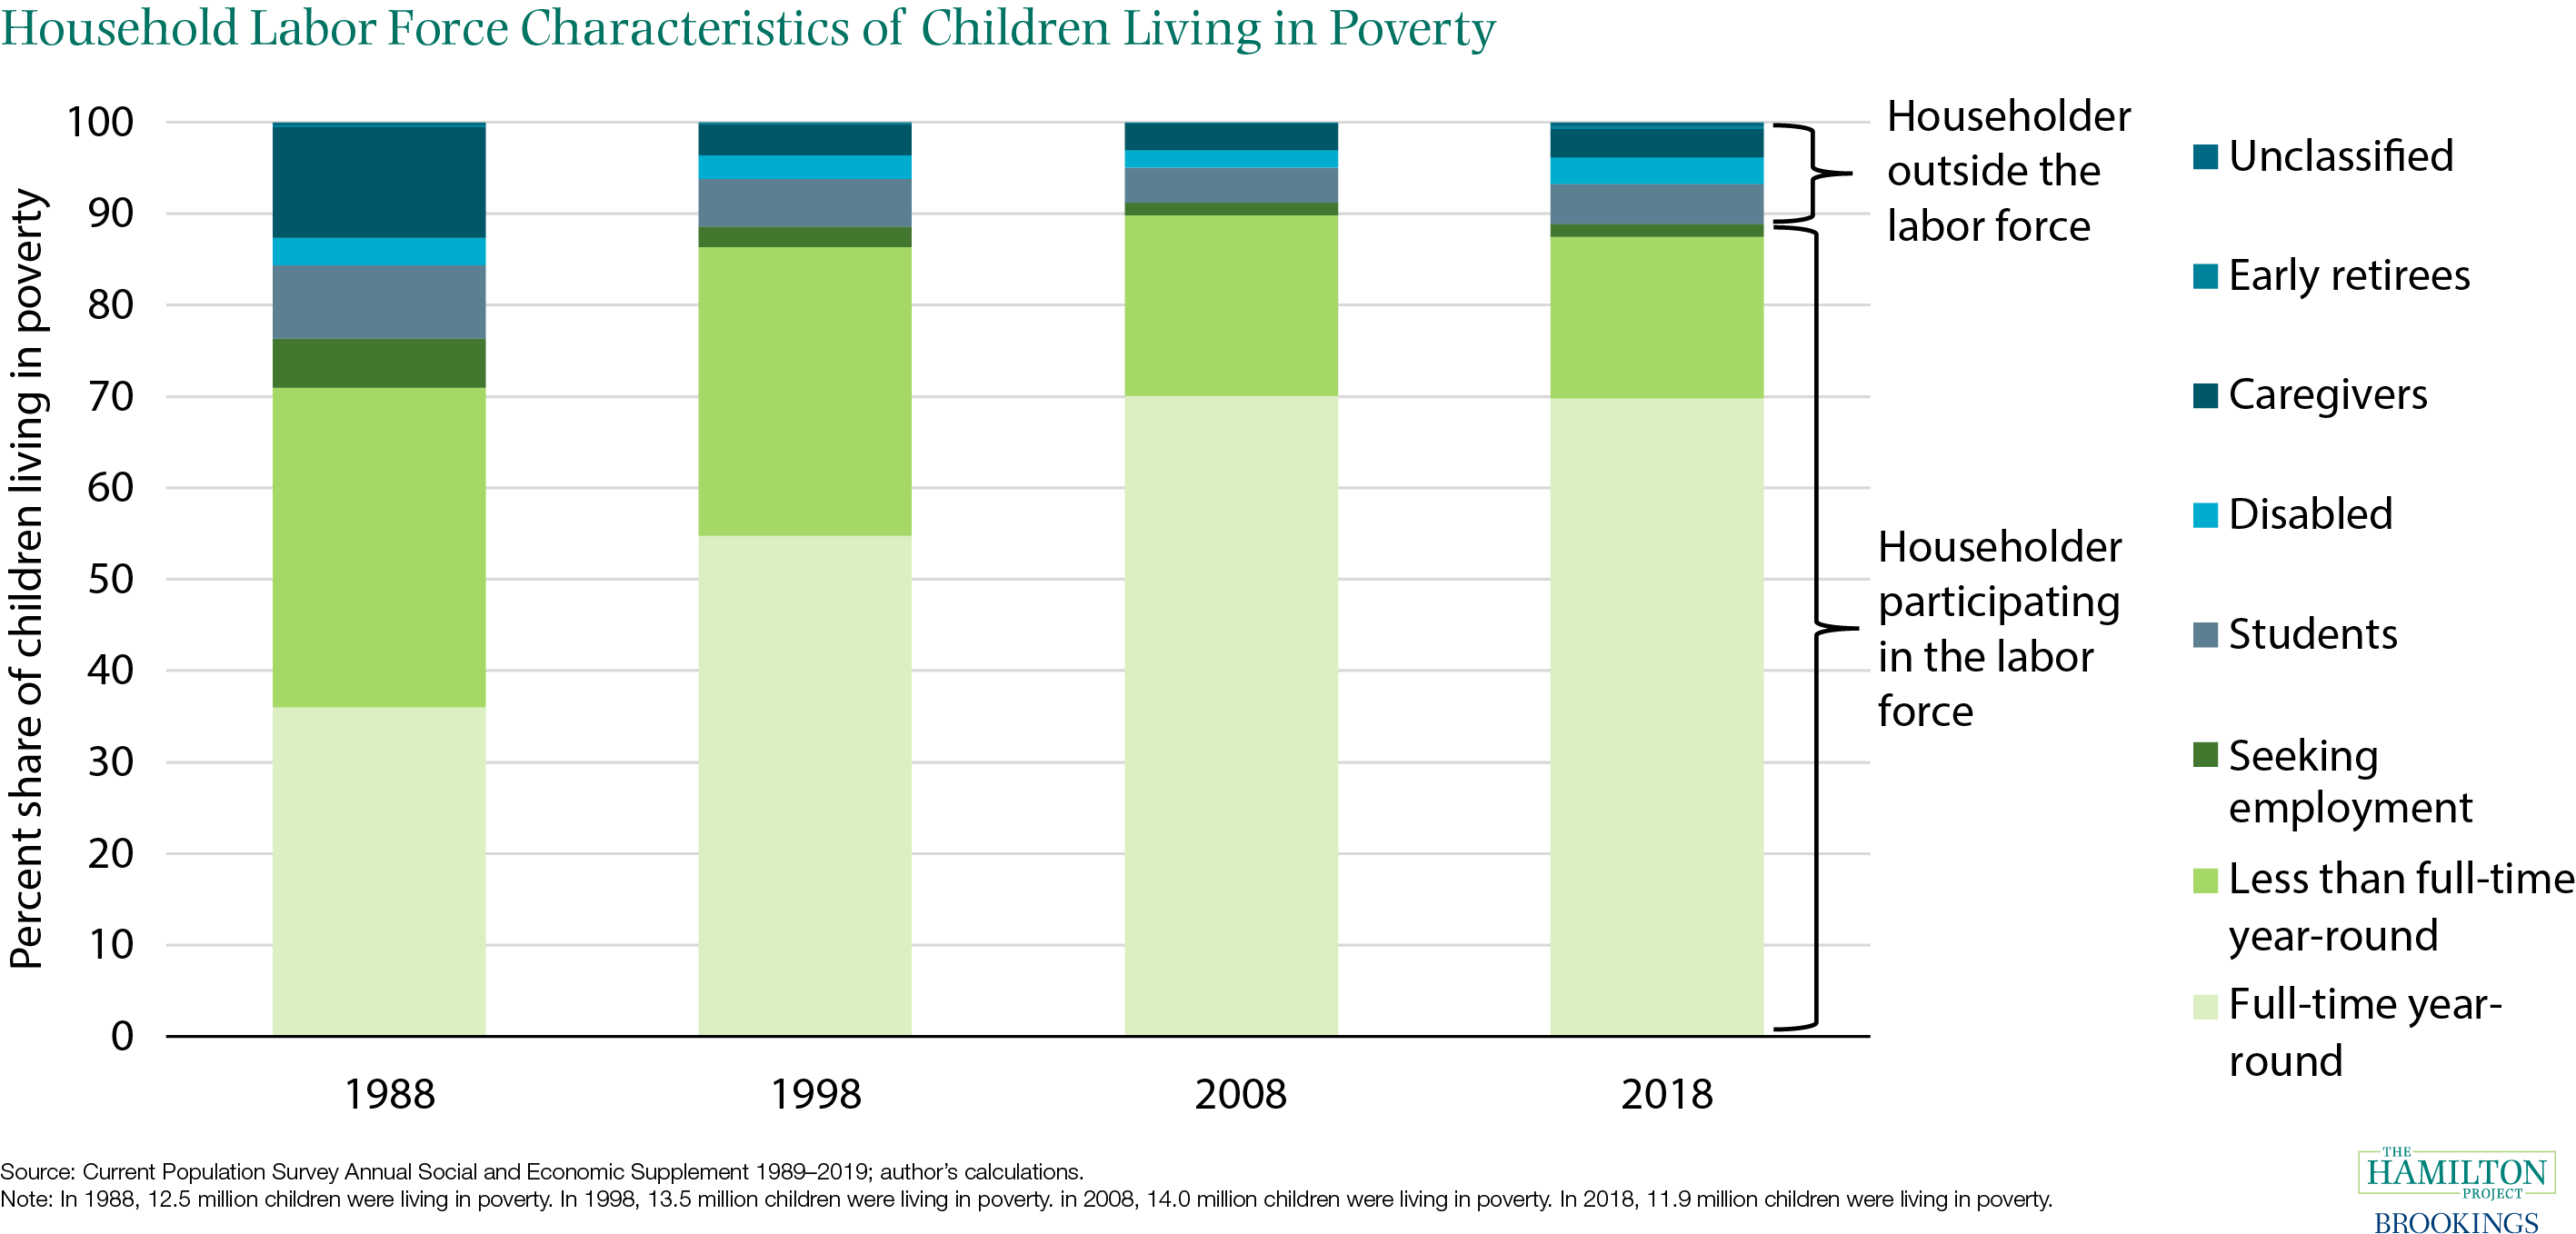
In the fifth annual “Who Is Poor in the US?” analysis, The Hamilton Project characterized poverty in 2018. More than half of those living in poverty in 2018 were working-age adults between the ages of 18 and 64 and just under a third of those living in poverty in 2018 were children. While the child poverty rate is back to pre-recession levels, child poverty is not eliminated by having a parent in the labor force. Almost 90 percent of children living in poverty (based on the official poverty measure that does not include transfers) in 2018 lived in a household where at least one member was a labor force participant, highlighting that labor market income alone is insufficient to draw many families with children above the poverty line.
Recent Hamilton Project analyses of poverty include “Who Was Poor in the United States in 2017?,” “Who Is Poor in the United States? A Hamilton Project Annual Report,” “An Update on Who is Poor in the United States,” and “Who is Poor in the United States?.”
The Brookings Institution is committed to quality, independence, and impact.
We are supported by a diverse array of funders. In line with our values and policies, each Brookings publication represents the sole views of its author(s).


Commentary
The Hamilton Project 2019: A Year in Figures
December 18, 2019