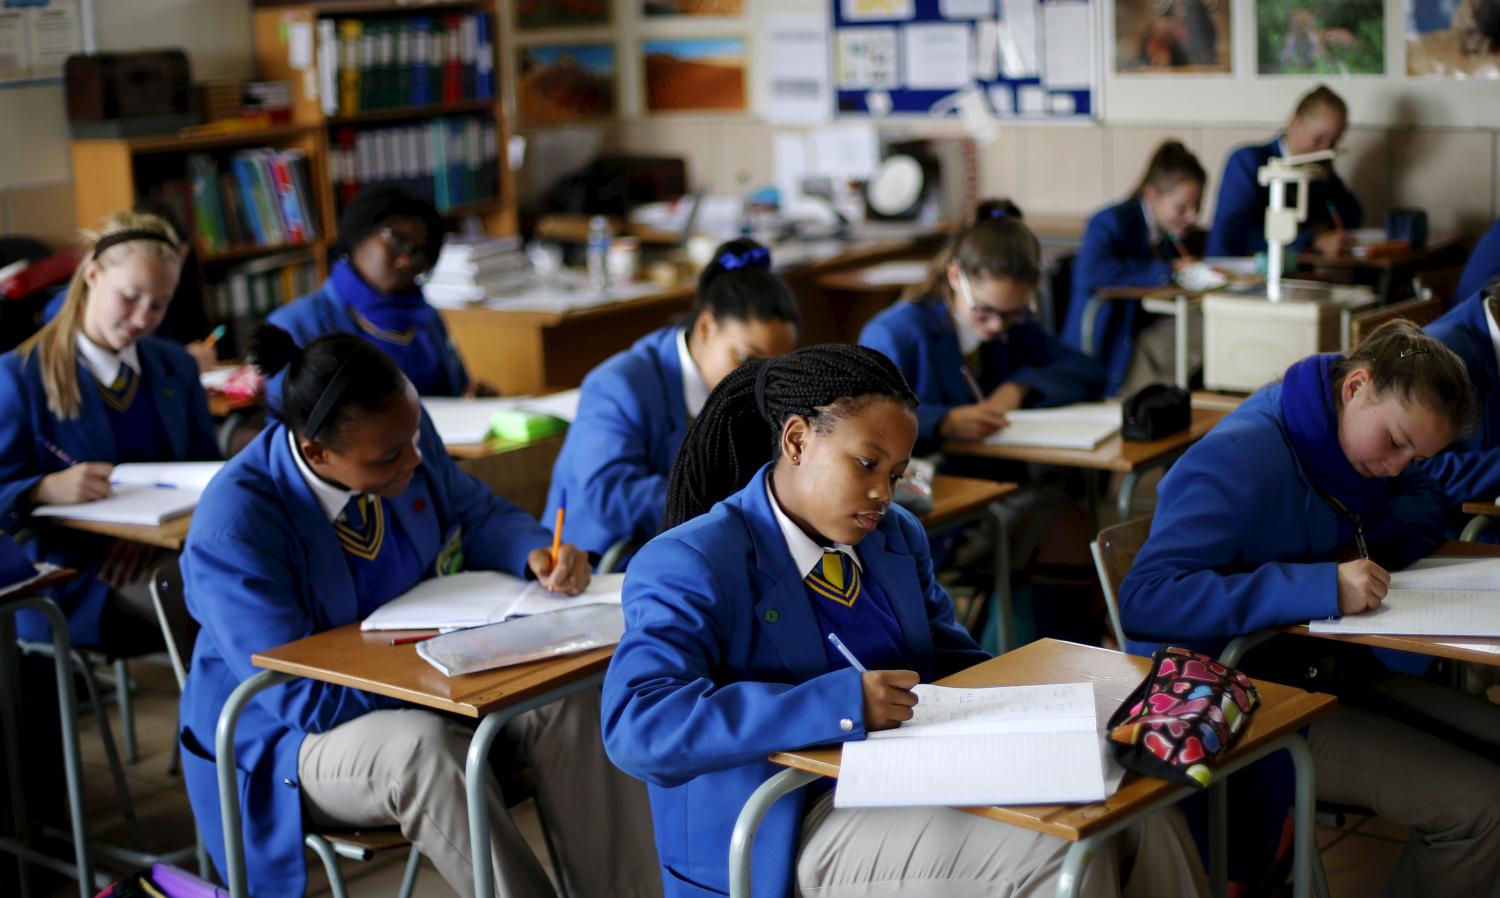
This has become a time of reflection on U.S. public education. The recent transition from the No Child Left Behind Act (NCLB) to the Every Student Succeeds Act (ESSA) provides an opportunity to reflect on the NCLB era and its emphasis on test-based accountability, while growing concerns about the country’s political and social climate have breathed life into efforts to nurture students’ civic knowledge, skills, and dispositions.
In this context, the 2018 Brown Center Report on American Education examines questions on where U.S. schools have been and where they might be going, with a focus on civics education. This post highlights parts of the first chapter, which explores trends over the last two decades in mathematics, reading, and civics scores on the National Assessment of Educational Progress (NAEP).
Trends in overall student performance
NAEP, or the “The Nation’s Report Card,” gauges the performance of nationally representative samples of U.S. students. It has assessed math and reading most consistently in recent years, with assessments in civics and other subjects more sporadic.
To compare trends over time in scores across subjects, we standardized average NAEP scores. In essence, we fixed the first score in each subject/grade at zero and calculated how scores changed relative to that starting point, with differences reported in standard deviations. As a general rule of thumb for interpretation, an increase of one-half of a standard deviation amounts to a jump from roughly the 50th to 69th percentile of scores, while an increase of one-quarter of a standard deviation represents a jump from about the 50th to 60th percentile.
The data indicate that scores in math (Figure 1) and reading (Figure 2) increased during the NCLB era. However, most of the math gains in grades 4 and 8 and the reading gains in grade 4 came in the early years of NCLB, with scores flattening since then. These trends seem consistent with what Mark Schneider called an “accountability plateau” in which test-based accountability policies might have provided an initial shock to schools that was not lasting enough to continue to propel performance upward.
In the context of NCLB’s emphasis on math and reading—and the incentives that it created or strengthened for schools—we probably should have expected gains in math and reading scores during this period. But what should we have expected in civics? On one hand, if schools narrowed their focus to math and reading, there might have been less time and fewer resources available for social studies. On the other hand, broader improvements in school quality—or, less optimistically, more practice in the art of test taking—might have pulled civics scores upward.
Figure 5 (numbered as it is in the report) shows trends in average civics scores during the NCLB era. Civics assessments have been administered less often than math and reading assessments—a reflection of its secondary status in education policy today. To some extent, this complicates comparisons with trends in other subjects, although civics trends do appear similar to reading trends.
Of course, trends in overall average scores do not tell the full story. They do not tell whether overall levels of performance are acceptably high, nor provide information about gaps across groups—a question we turn to next.
Trends in test score gaps
In the full report, we display and discuss trends in gaps between white and black students, white and Hispanic students, and students who were and were not eligible for free or reduced-price lunch (FRL).
The most recent assessments in math and civics (2017 for math, 2014 for civics) show nearly identically sized black-white gaps. However, the trends differ over time. While black-white math gaps in grade 8 remain distressingly wide—the equivalent of multiple years of academic learning—they have declined in recent years. In contrast, black-white civics gaps have widened slightly. Hispanic-white gaps and gaps based on FRL eligibility are slightly wider in civics than math, and again distressingly wide across the board, but follow similar patterns over this period. (See Chapter 1 for figures and discussion related to NAEP gaps.)
We worry that gaps in civics, like civics education more generally, has received too little attention in an era that has emphasized other academic subjects. Civic participation affords political power, and broad participation is essential for a healthy, inclusive democracy. Schools, more than any other public institution, are tasked with developing Americans’ civic knowledge, skills, and dispositions. While an assessment like NAEP provides only a limited glimpse of the civics-related opportunities and experiences provided to students of different backgrounds in American schools, the large gaps evident provide plenty of reason for concern.
More optimistically, a renewed focus on civics education and the increased flexibility that states have in designing their accountability systems under ESSA may provide a fresh opportunity for policymakers and educators to emphasize civics and the closing of civics gaps.
Bethany Kirkpatrick contributed to this post.
The Brookings Institution is committed to quality, independence, and impact.
We are supported by a diverse array of funders. In line with our values and policies, each Brookings publication represents the sole views of its author(s).


