After a period of intensive policy support, the U.S. electric vehicle (EV) market now faces an uncertain and fragmented policy environment, with likely consequences for efforts to reduce tailpipe-sourced air pollution.
Up until the early 2020s, federal policy sought to reduce vehicle tailpipe emissions in the transportation sector by creating strong incentives for EV manufacturing and adoption through tax credits and infrastructure spending. To this end, the Biden-era Infrastructure Investment and Jobs Act (IIJA) and Inflation Reduction Act (IRA) committed $119.1 billion to electrify vehicles through consumer rebates, credits to manufacturers, and new fuel research.
More recently, however, that national framework has disintegrated.
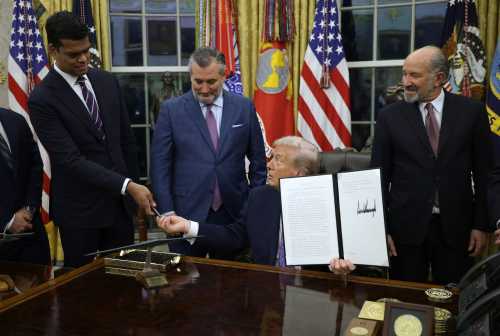
Starting last year, legislative and administrative actions have pulled back several of the most important federal supports for EV adoption. In 2025, a congressional tax-and-spending package accelerated the expiration of consumer EV tax credits and reduced support for deploying charging equipment, all while expanding subsidies for fossil fuels. In 2026, federal policymakers reconsidered key climate regulations and rolled back important EV-supporting policies. Most notably, the Environmental Protection Agency (EPA) moved to rescind the 2009 greenhouse gas endangerment finding and associated vehicle greenhouse gas standards, signaling a broader shift in federal climate policy.
Together, these changes have led to the decline of new EV sales starting in the second half of 2025 and continuing into the first quarter of 2026. Meanwhile, during this period, used EVs have seen increased uptake because of growing EV market inventory.
More broadly, however, the weakened economic case for EV adoption at both the consumer and industry level will likely continue to depress EV sales in the absence of incentives. Indeed, the evidence suggests that repealing federal clean-vehicle tax credits and EPA tailpipe standards could sharply slow EV adoption, reducing EV sales by about 30% in 2027 and 40% in 2030 relative to a 2025 policy baseline. That said, rising oil prices driven by the Iran conflict may give EV sales a lift, though the net effect on adoption remains uncertain.
In any event, these developments mark a shift from a period of strong federal support to one characterized by striking policy retrenchment.
All of which makes state EV policy more important than ever. States matter because they control many of the practical levers that influence whether consumers can or will buy, charge, and use EVs with confidence. These levers matter significantly to EV adoption, and range from consumer incentives, charging policy, and EV fleet procurement initiatives to environmental standards and dealership laws, among others. What’s more, these factors’ tangible importance to EV adoption are underscored by abundant research that shows EV adoption is highly responsive to policy design—by states as well as the federal government.
Hence this benchmarking of state policy moves to support EV adoption. At a time of significant shifts in the federal-state policy mix, this report benchmarks how well states are using their policy levers at a time of federal EV policy retrenchment. To start, the report situates the policy moment and its challenges, and introduces our benchmarking approach. After that, the report outlines a series of findings about states’ disparate EV policies and provides a few reflections. Throughout, the report’s purpose is to evaluate whether states have put in place policies that make EV adoption more likely over time.
Ultimately, the goal is to help leaders promote EV diffusion from coast to coast.
Related Content

Background
Electric vehicle adoption is shaped by a combination of economic, behavioral, and structural factors. Lower long-term costs, the accessibility of charging ports, and a sense of environmental responsibility encourage use. On the other hand, higher upfront costs, limited charging port access, and “range anxiety” (consumers’ negative reactions to the limited range ascribed to EVs) create barriers to adoption.
Along these lines, policy—whether state or federal—can play a major role in EV adoption. Adoption can be promoted through the deployment of purchase subsidies and tax credits. Regulatory standards, such as Corporate Average Fuel Economy (CAFE) standards, can drive demand and force technology investment, just as investment in battery research and development and public charging infrastructure can address range anxiety. At the same time, carbon pricing—such as through fuel taxes or emissions trading—can raise the effective costs of fossil fuel use and subsequently improve the total cost of EV ownership advantage, while the promotion of market access can encourage sales by easing hurdles to purchasing, such as among dealers or franchises.
In this way, federal and state policy has played an important role in correcting multiple market failures to support the EV adoption—most notably through the 2010s and early 2020s, when a combination of federal and state policies came together to provide robust support. Then, multiple federal policies reinforced and complemented a varied set of state rules by establishing subsidies, maintaining regulations, investing in infrastructure, and setting emissions and procurement targets.
Supporting these intentions were federal statutes, policies, and rules providing for: generous consumer tax credits of up to $7,500 per EV; tax and other incentives for chargers and charging networks; CAFE standards and EPA emissions rules; investments in charging networks; and federal goals.
Since 2025, however, actions by the Trump administration and Congress have eliminated most of the previous consumer-wide subsidies; weakened or neutralized regulatory pressure; and scaled back infrastructure investments and goals. Among the changes:
- Congress and the Trump administration eliminated the key consumer credits in 2025 legislation, ending them for most vehicles after September 30, 2025.
- CAFE standards were weakened and penalties for noncompliance were effectively eliminated.
- Federal fleet electrification targets and requirements were eliminated.
What’s more, pending legislation in the House of Representatives may require owners of EVs and plug-in hybrid cars to pay an annual fee to cover their share of the cost of repairing roads.
Given all of this, what remains of the EV policy stack is a patchy, variable array of state-level statues, rules, incentives, and stances that is now the disparate policy lineup on which EV adoption must rely on. Assessing the strength of that lineup is important for considering how to maximize the effectiveness of state-focused approaches to EV adoption.
Authors


Approach
To examine these issues, this report benchmarks the presence of key state EV policies across all 50 states and the District of Columbia. To do that, the analysis compares how states are using policy tools to support EV affordability, market development, charging access, emissions reductions, and public sector leadership. Ultimately, it assesses whether states have adopted the policy conditions that can enable EV growth over time.
In this vein, the scorecard focuses on policy presence. Outcomes such as EV registrations and charger deployment are presented separately and used for mapping, comparison, and correlation analysis. This distinction is important because outcomes reflect factors beyond state policy alone, including income, fuel prices, vehicle availability, electricity rates, housing type, and federal funding, which this report does not evaluate.
The framework is organized around five pillars: 1) consumer incentives; 2) environmental standards; 3) charging infrastructure; 4) market access; and 5) government procurement. Together, these five pillars are grounded in multi-disciplinary, peer-reviewed literature that spans environmental economics, transportation planning, and public policy, as well as other frameworks policy research organizations tracking state-level EV policy have developed. Together, the pillars seek to cover the major ways in which states can shape the EV policy environment.
Each pillar is then measured through a set of observable indicators that can be compared across states.
The resulting framework includes 13 indicators in total, each representing a concrete policy signal that can be measured across states. The first three pillars—consumer incentives, environmental standards, and charging infrastructure—each include three indicators, given that they capture the broadest and most direct levers for EV readiness that we observed in the literature. The remaining two pillars—market access and government procurement—include two indicators each because they reflect narrower but still important enabling conditions.
The final score is calculated as a simple additive score out of 13. This means the framework is indicator-weighted rather than pillar-weighted; in other words, the weighting reflects the number of distinct state policy levers included in each pillar.
Data
Along these lines, the five pillars and underlying indicators are as follows:
1. Consumer incentives
Consumer incentives reduce upfront costs and behavioral barriers to EV adoption. Prior research finds that purchase rebates and non-monetary incentives, such as high-occupancy vehicle (HOV) lane access, are associated with increases in EV registrations, albeit with varying effect sizes.
This pillar measures whether state policy reduces the cost or inconvenience of EV ownership. It includes three indicators:
- EV purchase incentive: Captures whether a state offers a financial incentive for EV purchases. This includes light-duty EV rebates, medium- and heavy-duty EV rebates, and state purchase tax credits. These measures are grouped because they all reduce the upfront cost of buying an EV or electric fleet vehicle. A state receives credit if it has at least one of these policies.
- Non-monetary EV incentive: Captures whether a state offers convenience-based benefits for EV drivers. This includes EV parking perks and EV toll exemptions or discounts. These measures are grouped because they do not lower the purchase price of a vehicle, but they can make daily EV use more cost-effective.
- EV annual registration fee: Captures whether a state imposes an added annual registration fee on EV owners. This is included because added fees can increase the cost of EV ownership and may offset the value of other incentives. This indicator is scored differently from the incentive indicators, with states receiving a positive score when they do not impose an EV fee.
2. Environmental standards
Environmental standards provide long-term policy certainty that can shape manufacturer supply, investment decisions, and market expectations. Emerging research suggests that environmental policies and zero-emission vehicle (ZEV) standards may have effects comparable to or greater than financial incentives in driving EV adoption.
This pillar measures whether states have adopted policies that create a clear regulatory direction for cleaner vehicles and lower transportation emissions. It includes three indicators:
- ZEV mandates: Captures whether a state has adopted zero-emission vehicle requirements for light-duty vehicles, medium- and heavy-duty vehicles, or both. This includes policies such as California’s Advanced Clean Cars II and Advanced Clean Trucks, which other states have adopted. These measures are grouped because they both require a transition toward zero-emission vehicle sales in different parts of the vehicle market. A state receives credit if it has either type of ZEV mandate.
- Other vehicle emission reduction incentive, fuel standard, or target: Captures whether a state has broader transportation emissions policies beyond EV-specific mandates. This includes transportation greenhouse gas targets, low-emission vehicle standards, Low NOx Omnibus rules, and low-carbon fuel standards. These policies are grouped because they all support transportation decarbonization, even though they operate through different mechanisms.
- Electrification planning: Captures whether a state has an EV or EV charging infrastructure plan. Planning does not guarantee implementation, but it shows that the state has identified priorities, agencies, infrastructure needs, and investment pathways.
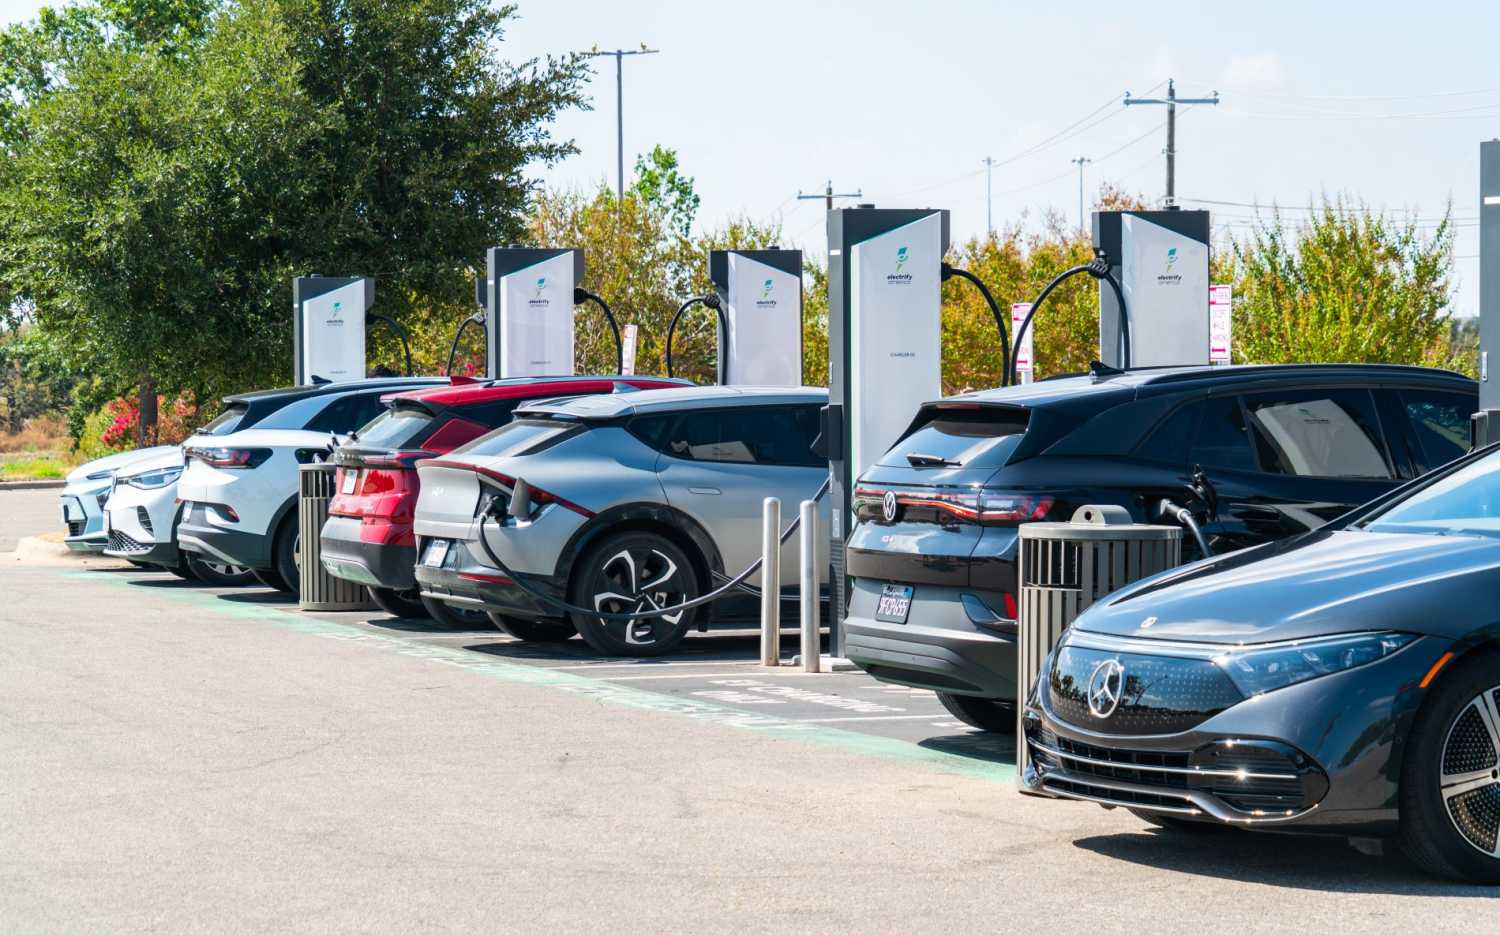
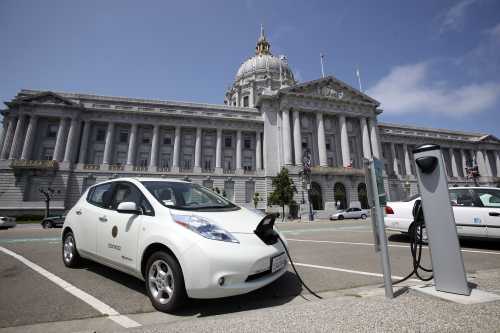
3. Charging infrastructure
EV markets exhibit strong indirect network effects: EV adoption increases the value of charging infrastructure, while charging expansion increases the value of EV ownership. Prior evidence suggests that public investment in charging infrastructure can be more effective than equivalent consumer subsidies in some contexts.
This pillar measures whether states are supporting the deployment, accessibility, and affordability of EV charging. It includes three indicators:
- Charging infrastructure incentives: Captures whether a state offers rebates or other incentives for EV charging infrastructure. These policies help reduce the cost of installing chargers and can support deployment across homes, businesses, and public sites.
- Charging infrastructure access and requirement: Combines charging infrastructure requirements or EV-ready building rules with right-to-charge policies. These measures are grouped because they both address non-financial barriers to charging access. EV-ready rules help ensure that buildings and parking facilities are prepared for charger installation. Right-to-charge policies help residents, especially those in multifamily housing or shared parking settings, gain the ability to install or access charging. A state receives credit if it has either type of policy, but the indicator only counts once.
- Utility charging rate: Captures whether a state has an EV utility charging rate requirement. This is kept separate because it addresses a different part of the charging ecosystem: electricity pricing. Utility rate policies can help make charging more affordable.
4. Market access
Dealer behavior and franchise restrictions can create barriers at the point of sale. Studies find that dealership incentives, technological orientation, and willingness to sell EVs can significantly influence consumer purchase outcomes.
This pillar measures whether state laws allow EV manufacturers and consumers to participate in the vehicle market without restrictive sales or service barriers. It includes two indicators:
- Direct sales: Captures whether all manufacturers are licensed to sell directly to consumers. This matters because restrictions on direct sales can limit consumer access to certain EV brands or purchasing options. Direct sales represent an emerging model increasingly pursued by EV startups that lack legacy dealer networks.
- Service access: Captures whether manufacturers are allowed to provide service facilities. This is important because EV readiness depends not only on vehicle sales, but also on maintenance and repair access. Sales and service are scored separately because a state may allow one but restrict the other.
5. Government procurement
Public procurement and fleet electrification can create demonstration effects and stimulate market development. Government fleet commitments are identified as best-practice strategies for accelerating adoption and signaling market confidence.
This pillar measures whether states are using public sector purchasing power to support EV market development. It includes two indicators:
- Fleet target: Captures whether a state has public fleet EV procurement targets. These policies indicate that the state is committing its own vehicle fleet to electrification. They can help create demand and support charging infrastructure deployment.
- Electric bus support: Captures whether a state has electric bus procurement targets. This is treated separately from broader fleet targets because buses have distinct operational, infrastructure, and funding implications.
Scoring methodology
Each state is scored across 13 indicators. For most indicators, states receive one point if the relevant policy is present and zero points if it is not present. Where an indicator includes multiple measures, a state receives credit if it has at least one of the listed measures. This prevents double-counting states that have several policies within the same policy category.
For example, a state with an EV rebate, a medium- and heavy-duty EV rebate, and a purchase tax credit still receives one point for the EV purchase incentive indicator. Similarly, a state with both an EV-ready building rule and a right-to-charge policy receives one point for the combined charging access and requirement indicator.
The final score is the sum of all indicator scores, for a maximum of 13 points. This scoring structure is simple, transparent, and easy to compare across states.
The score is displayed alongside outcome measures—specifically, EV registrations and charger deployment are presented separately to show how EV policy readiness compares with observed market conditions. These outcome measures support our policy analysis, but they are not included in the policy score because they are shaped by many factors outside a state’s control.
Limitations
This framework measures the presence of state policies—which are generally straightforward—but it is subject to several limitations. First, it does not fully measure EV policy strength, funding levels, enforcement quality, implementation progress, or real-world impact. For example, a small rebate and a large rebate may both receive credit, even though they may affect adoption differently.
Second, some indicators group different policy tools together. This improves comparability and avoids double-counting, but it can also simplify important differences. For example, a right-to-charge policy and an EV-ready building rule both support charging access, but they operate through different practical mechanisms.
Meanwhile, several policies scored under the “Environmental standards” pillar face active legal uncertainty. Congressional Review Act resolutions signed in June 2025 revoked the federal waivers underlying Advanced Clean Cars II, Advanced Clean Trucks, and Low NOx Omnibus rules. A coalition of adopting states has filed suit challenging those revocations, and litigation remains ongoing. Scores reflect state-level adoption and do not capture whether policies are currently being enforced.
For that matter, the data sources are not all updated at the same time. Most State Climate Policy Dashboard and Alternative Fuels Data Center measures are updated as of March 2026; Tax Foundation data are from August 2025; and Northeast States for Coordinated Air Use Management (NESCAUM) data are from November 2025.
The scoring is mostly binary. This means it may not capture partial adoption, pending rules, pilot programs, local variation, or differences between enacted and fully implemented policies.
Finally, the framework focuses on state-level policy readiness. It does not fully capture utility-led programs, local government action, private charging investment, federal funding deployment, rural access, grid capacity, or equity outcomes. These factors should be considered for a full picture of state performance.
Findings
So, what does the scorecard presented here say about states’ EV readiness as of 2026? Most strikingly, the scorecard depicts large differences in how states are using EV policy tools in the wake of federal retrenchment. Some states have adopted broad policy packages that combine incentives, standards, charging policies, market access, and procurement over time. Others have adopted only a few of these measures, or none at all.
The findings below compare states by showing where EV policy scores are highest and lowest, while also comparing those scores with EV adoption outcomes, measured as EV registrations per 1,000 vehicles.
EV policies are concentrated in a relatively small group of states.
Map 1 shows that state EV policy scores vary widely across the country. Scores range from zero to 11 out of 13. The highest scores are concentrated in the Northeast, the West Coast, and a few additional states such as Colorado and Maryland.
California and Massachusetts have the highest scores, at 11. They are followed by a group of states scoring 10: Colorado, Oregon, Maryland, New York, Delaware, Connecticut, Rhode Island, and Maine. These states have adopted policies across several parts of the EV policy landscape rather than relying on one policy area alone.
At the other end of the distribution, Indiana, Ohio, Nebraska, Montana, Louisiana, and South Dakota all score zero on the Brookings scorecard. These states do not receive points for any of the policy indicators included in the scorecard.
Top-scoring states tend to use policy packages rather than isolated interventions
The highest-scoring states generally accumulate points across multiple pillars. California and Massachusetts both score 11, but they get there through different policy combinations. California receives points across all five pillars, with full points for environmental standards, market access, and procurement. Massachusetts also scores across all five pillars, with full points for consumer incentives, charging infrastructure, and procurement.
Looking at the group of 10-point states also shows that there is more than one pathway to a high score. Colorado and Oregon combine strong environmental standards with market access. Maryland, Delaware, and Maine receive two points across all five pillars. New York and Connecticut score highly despite receiving no points for market access.
The broader takeaway is that high-scoring states do not all follow the same policy sequence strategy. But they usually have policies supporting several parts of the EV ecosystem. For states looking to strengthen their policy portfolios, the takeaway is that single policies are less effective than the overall mix.
Higher-scoring states tend to have higher EV adoption rates
EV adoption rises with policy scores. States scoring zero to 2 average four EVs per 1,000 vehicles. States scoring 3 to 5 average seven per 1,000. States scoring 6 to 8 average 12 per 1,000. And states scoring 9 or higher average 17 per 1,000. This means the highest-scoring group has more than four times the average EV adoption rate of the lowest-scoring group.
California is the clearest example. It has one of the highest policy scores and the highest EV adoption rate in the dataset, at 40.5 EVs per 1,000 vehicles. New Jersey, Hawaii, the District of Columbia, Delaware, Colorado, Oregon, and New York also combine relatively high policy scores with above-average EV adoption.
But several states sit above or below the broader pattern. Georgia and Texas have low policy scores, at 1, but EV adoption rates near 10 EVs per 1,000 vehicles. North Carolina also has a low score, at 2, but an EV adoption rate of eight EVs per 1,000 vehicles. These states may have market momentum that is not fully explained by the state-level policies captured in the scorecard.
Other states have high policy scores but lower EV adoption rates than many peer states. Maine scores 10 but has just 5.4 EVs per 1,000 vehicles. Rhode Island also scores 10 but has just 7.8 EVs per 1,000 vehicles. This suggests that factors unrelated to policy design may be driving adoption in these states.
The pattern suggests that broader state EV policy portfolios are associated with stronger EV market outcomes. This relationship should not be interpreted as causal on its own. But it does show that states with more policies in place tend to have higher EV adoption than states with fewer policies.
The scorecard points to different next steps for different types of states.
Based on policy scores and EV adoption levels, states fall into three broad groups, each with different implications for action. The first group— California, Massachusetts, Colorado, Oregon, Maryland, New York, Delaware, Connecticut, Rhode Island, Maine, the District of Columbia, New Jersey, Hawaii, and Vermont—scores 8 or above and has broad policy coverage and strong adoption outcomes for the most part, as measured by EV registrations and charger deployment. What distinguishes these states is not just the number of policies in place, but their spread across pillars. These states have adopted purchase incentives, charging infrastructure requirements, environmental standards, and others in tandem. With that in mind, the immediate policy priority for these states should be defensive: preserving adopted policies and regulations and continuing to support and expand purchase and charging infrastructure incentives that previously relied on federal co-investment.
A second group, scoring between 4 and 7—Florida, Illinois, Virginia, Nevada, Washington, Pennsylvania, Minnesota, New Mexico, Michigan, Arizona, Utah, and North Dakota—has made meaningful policy commitments, but coverage remains uneven across pillars. Market access is the clear strength of this group: Ten of the 12 states score the maximum on this pillar, suggesting that retail-side access policies are broadly in place. On consumer incentives, most of these 12 states have some policy in place, though three score zero—suggesting that direct purchase support remains absent in a portion of this group. Environmental standards are similarly mixed: Ten of the 12 states have some regulatory coverage, but only Nevada and Minnesota reach the higher end of the scale, while Illinois and North Dakota score zero. The most consistent gap is in charging infrastructure, where three of the 12 states score zero and most others score only at the minimal level, indicating that physical deployment requirements have lagged behind both incentive and regulatory efforts. Procurement scores are also low across the board, with most states scoring zero or 1, pointing to limited institutional commitment to EV policy. Adoption rates in this group vary widely, reflecting this uneven foundation. The priority for these states should be filling specific gaps rather than broad expansion. Particularly, they should look to expand charging infrastructure and, where absent, purchase incentives.
The largest group scores below 4 and shows low EV adoption. For these states, a full policy overhaul is neither realistic nor necessary; the scorecard points to more targeted, entry-level work. Eliminating EV-specific annual registration fees, which many of these states currently impose, will directly reduce ownership costs without new spending. Similarly, electrification planning requires no immediate spending commitment but establishes a framework for future investment.
The point for these low-scoring states, in short, is not to accelerate electrification solely to keep up with other states for their own sake. Rather, it is to ensure state residents gain a measure of access to affordable transportation as the federal policy floor disintegrates and affordability concerns rise amid global oil price instability.
Discussion and conclusion
Following on the Trump administration’s repeals and suspensions of pro-EV policies, state commitments to promote EV adoption are now the main source of real-world solutions to address market-related hurdles for adoption. Given that, U.S. states now carry the burden of maintaining American global competitiveness in the automobile industry and managing its broader societal impacts as peer countries continue to invest in EV manufacturing capacity and consumer incentives.
This benchmarking analysis documents the stark fragmentation of the state EV policy landscape in the wake of federal retrenchment. Overall, key aspects of the ideal EV policy stack remain absent in most states, notwithstanding impressive efforts in some.
In that sense, state policies are far from a sufficient stopgap in the drive toward economic and environmental progress nationally. The central problem is the patchiness of state commitment. Given the policy variation depicted here, the overall national stance on EVs remains fragmentary by global standards and uneven for U.S. citizens seeking the economic and environmental benefits of the EV transition.
To be sure, the states with robust frameworks depicted here—combining purchase incentives, zero-emission vehicle mandates, and charging infrastructure investment—demonstrate that subnational policy can meaningfully move markets, maintain consumer demand, and keep automakers committed to electric platforms. In response to the federal rollback, several states continued their existing programs or moved proactively to fill the incentive gap. Coloradoexpanded its consumer rebate to $9,000; Massachusetts continued its MOR-EV rebate program; and California directed regulators to develop an “Advanced Clean Cars III” framework as a contingency against federal waiver revocations.
Yet a parallel pattern of retrenchment has emerged alongside these efforts. Last year, Minnesota increased its annual EV registration surcharge, and Maryland and Vermont—both formal adopters of California’s Advanced Clean Cars II standards—issued executive orders delaying enforcement of penalties for not complying with ZEV mandates. Going forward, states with fewer pro-EV policies on the books would be wise to study the progress of leading states, copy what works, and evolve where they can.
In the meantime, the wide variance in state EV policy quantity and quality documented here reflects a structural inequity and national weakness. Notably, seven of the 10 states that housed 84% of EV manufacturing investmentbetween 2015 and 2024 rank in the bottom half of our scorecard. States that pair manufacturing investment with adoption policies stand to capture gains at both ends of the supply chain: building vehicles and selling them domestically.
As a matter of equity, residents of less EV-friendly states face higher costs, fewer vehicle choices, and sparser charging networks, through no fault of their own. As to the nation’s global standing, the withdrawal of coordinated federal support has weakened the United States’ competitive position relative to China and the European Union, where national industrial strategies continue to accelerate EV adoption and manufacturing at scale.
The findings of this report make clear that while state leadership is vital, durable and equitable electrification will ultimately require a renewed federal framework that raises the floor for all states, not just those with the ambition and resources to act alone. Until then, state-level EV policy has become an indispensable—if imperfect—bridge to the future.
-
Acknowledgements and disclosures
Brookings Metro extends its gratitude to the partners who generously supported this analysis. The program is also grateful to the Metropolitan Council, a network of business, civic, and philanthropic leaders that provides both financial and intellectual partners of the program.
This publication was made possible by Rivian, an unrestricted donor to the Brookings Institution. The views expressed in this article are those of its authors and do not represent the views of donors, their officers, or employees.
The Brookings Institution is committed to quality, independence, and impact. We are supported by a diverse array of funders. In line with our values and policies, each Brookings publication represents the sole views of its author(s).
The authors are indebted to many colleagues who offered input regarding the development of the analysis. We would like to thank the following staff for significant input: Rob Puentes, Adie Tomer, and Benjamin Swedberg. In addition, the authors wish to thank Leigh Balon and Michael Gaynor for their editorial and communications expertise. Thanks also to Alec Friedhoff and Nick Mourtoupalas for layout and graphic design.
The Brookings Institution is a nonprofit organization devoted to independent research and policy solutions. Its mission is to conduct high-quality, independent research and based on that research, to provide innovative, practical recommendations for policymakers and the public. The conclusions and recommendations of any Brookings publication are solely those of its author(s), and do not reflect the views of the Institution, its management, or its other scholars. Brookings is committed to quality, independence, and impact in all of its work. Activities supported by its donors reflect this commitment.
The Brookings Institution is committed to quality, independence, and impact.
We are supported by a diverse array of funders. In line with our values and policies, each Brookings publication represents the sole views of its author(s).