Larry Summers recently said something startling: “At this moment . . . the share of public investment in GDP, adjusting for depreciation, so that’s net share, is zero. Zero. We’re not net investing at all, nor is Western Europe,” he told a Princeton University audience.
In other words, total federal, state, and local government investment is enough to cover only the amount of wear and tear on bridges, roads, airports, rails, and pipes. “Can that possibly make sense?” asked the former Treasury secretary, who has been campaigning for more government spending on infrastructure.
I wondered whether Mr. Summers was hyping the data to make his point. So I checked. Net federal public investment spending, both defense and non-defense, in 2013 (the latest year for which data are available) works out to zero as a percentage of gross domestic product, according to the Bureau of Economic Analysis’s National Income and Product Accounts tables. Non-defense investment spending, which was nearly 1% of GDP in the mid-1960s – and hasn’t come close to that since–was about $9.8 billion in 2013, or a paltry 0.06% of GDP. Mr. Summers wasn’t exaggerating.
Those BEA tables proved more interesting than I anticipated. For instance:
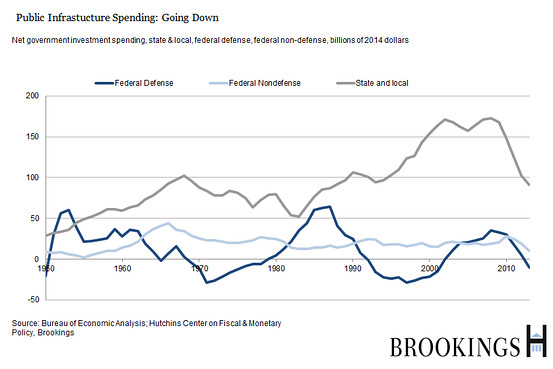
As shown in the chart above, the bulk of government investment in the U.S. is done at the state and local levels, not by Washington. That spending soared in the housing boom years before the financial crisis, when state and local governments were flush. It collapsed in 2010.
Net federal defense investment rises and falls with the Pentagon budget, not surprisingly. In 2013, the U.S. wasn’t spending enough on defense to offset wear and tear on its equipment. (The BEA relies on the Defense Department for depreciation estimates.)
Net federal investment spending outside of defense peaked in the late 1960s (at $45 billion in today’s dollars). It hit $28 billion in 2010 (presumably reflecting the 2009 fiscal stimulus spending) and dropped to $10.3 billion in 2013, the lowest level since 1958. (BEA estimates the depreciation, or wear and tear, of most government assets by using estimates for similar privately owned assets where possible. It puts the service life of highways at 45 years.)
All this is happening at a time when the U.S. government can borrow money at very low interest rates: 2.2% for 10 years, 2.8% for 30 years. It would seem a good time for the government to borrow for long-term investments, as Mr. Summers frequently says.
Infrastructure spending, highways in particular, used to be popular with both Republicans and Democrats in Congress. But, as the flap over the Highway Trust Fund and the gasoline tax indicate, any infrastructure spending bill is trapped by partisan gridlock and distrust. That accounts for at least some of the increasing appetite at the state and local levels for public-private partnerships. But the Obama administration has argued that “Private capital is not a substitute for public investment.” The president is pressing a reluctant Congress to spend more on infrastructure.
There is good reason to worry about the size of the debt we are bequeathing to the next generation: The U.S. government has made promises to pay future health and retirement benefits that exceed the tax revenues the current tax code will produce.
But we won’t be doing the next generation any favors by bequeathing crumbling asphalt and leaky water and sewer pipes–and a huge bill for deferred maintenance.
The Brookings Institution is committed to quality, independence, and impact.
We are supported by a diverse array of funders. In line with our values and policies, each Brookings publication represents the sole views of its author(s).

Commentary
Op-edSpending on our crumbling infrastructure
March 10, 2015