As readers of this space will certainly know, the Obama administration has proposed a $75 billion 10-year federal investment in state pre-K programs for four-year-olds, to be matched by roughly the same level of state investment. The administration has been marketing its plan with about the same amount of balance that any large business brings to the task of selling a new product in which it is heavily invested, which is to say that it is putting forward the best possible case. This frequently takes the form of citing James Heckman’s analysis of $7 of public savings for every $1 invested in the Perry Preschool Project. Secretary of Education Duncan did just that at an event at Brookings on May 29, saying:
“Rigorous, longitudinal work by folks such as Nobel Prize winning economist James Heckman … found a return of $7 to every $1 of public investment in high-quality preschool programs. Children who went to preschool have fewer special needs as they move through school. Less go into special ed. They get better jobs. They have better health and they commit less crime. A seven to one ROI. That’s a much better return than any of us would typically get in the stock market and real estate or anywhere else that we can put our money.”
Since the Fact Checker at the Washington Post awarded President Obama a couple of Pinocchios for using this same rhetoric in his State of the Union address, you would think that Secretary Duncan and others in the administration would be more circumspect. As I have noted in a previous Chalkboard report, Perry was an intensive, expensive, multi-year, hothouse program carried out 50 years ago with less than 100 black children in Ypsilanti, Michigan. The mothers stayed at home and received home visitation. The control group children had no other preschool services available to them. The Perry findings demonstrate the likely return on investment of widely deployed state pre-K programs for four-year-olds in the 21st century to about the same degree that the svelte TV spokesperson providing a testimonial for Weight Watchers demonstrates the expected impact of joining a diet plan.
I’m willing to bet the farm that the typical state pre-K program for four-year-olds that would be expanded if the Obama administration’s proposal were enacted isn’t going to have the impact of Perry (or Abecedarian – the other iconic pre-K program with long-term follow-up and impressive outcomes).
If we aren’t going to extrapolate from Perry to the typical state pre-K program (and we shouldn’t) what then is the magnitude of the impact we might expect from increasing the proportion of children enrolled in state pre-K?
There are a variety of ways of trying to address this question. For example, Maria Fitzgerald has examined the impact of the Georgia universal pre-K program by comparing outcomes on the 4th grade NAEP test for cohorts who came before and after the introduction of the program. She finds minimal differences in their academic outcomes. Of course, her research addresses the Georgia program and cannot be generalized to state pre-K programs everywhere. In fact, every approach to answering the question of the impact of state pre-K has limitations because no state has had the good sense to stagger the introduction of its state pre-K program over a year or two and randomly assign counties or school districts to be in the first or second wave of implementation. And, of course, state pre-K in one state doesn’t necessarily look like the program in another state, and short-term outcomes may not be good proxies for long-term outcomes. But absent randomization and long-term follow-up into adulthood of a representative sample of state pre-K participants across the states, the best we can do is try to triangulate an estimate of impact of state pre-K programs from different sources of information and imperfect research designs.
Here, I’ll add to the information that can be used for triangulation by crunching some numbers that I don’t think have been previous analyzed and reported. I’ll use the same outcome variable as Fitzgerald, the 4th grade NAEP results in reading and math. But rather than focusing on one state as she did, I’ll use all 50 states. I’ll ask what the association is between the percentage of four-year-olds enrolled in state pre-K in each state in 2006 and the performance of the state’s 4th graders on NAEP in 2011 (when the four-year-olds who were eligible for pre-K in 2006 would have reached 4th grade).[1] The range of pre-K enrollment across states is substantial, from 0% in 10 states to 70% in Oklahoma, so all other things being equal, if state pre-K has a positive influence on subsequent academic achievement then states with higher levels of state pre-K enrollment should have higher NAEP scores.
The simple correlations of state NAEP scores and pre-K participation rates are very low and not statistically significant (0.02 for reading and -0.08 for math). But this is misleading because all other things are not equal across states, particularly with respect to the demographics of their populations. If, as happens to be the case, southern states with high proportions of low-income minority families have been leaders in implementing state pre-K programs, then the dominating influence of family characteristics on achievement test scores would generate correlations like those I found. But making causal assumptions about the impact of pre-K from such correlations would be like concluding that doctors cause illness because there is a negative correlation between the frequency with which individuals see a doctor and their health. To avoid this problem to the extent possible, I control statistically for demographic differences across states in the analyses I report subsequently.[2]
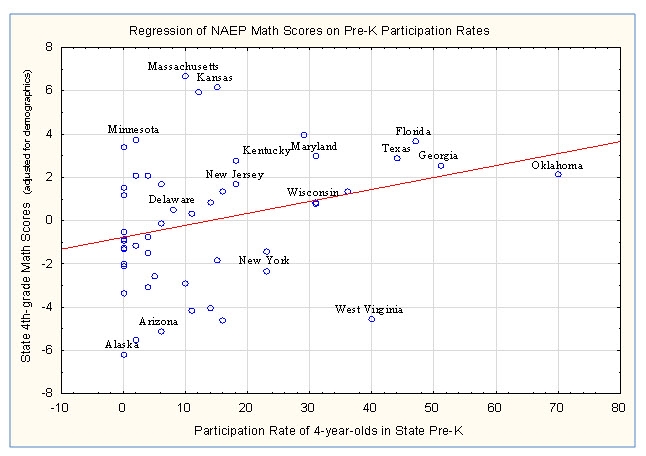
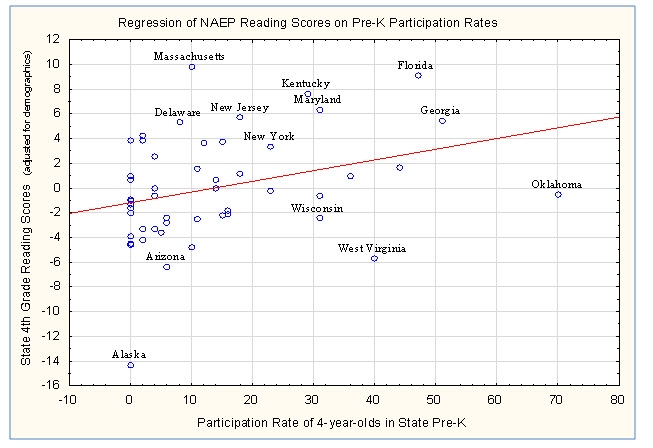
I find that participation rates in state pre-K programs are modestly associated with demographically adjusted NAEP scores in 4th grade. The correlation between participation rates in state pre-K and demographically adjusted state NAEP scores five years later is 0.29 for math and 0.32 for reading, which means that roughly 10% of the differences among states in demographically adjusted 4th grade NAEP scores is associated with the level of participation of four-year-olds in state pre-K programs. These relationships can be represented in a prediction formula such that, for example, a one standard deviation increase in state pre-participation rates, which happens to be 16% (or about the difference between participation rates in Maryland and Texas), would be associated with a bit more than a one point increase in NAEP scores five years later. A one or two point increase in NAEP isn’t unimportant, but it isn’t a lot.
The next two graphs, the first for math and the second for reading, provide more detail. A few states are labeled in both graphs to provide a basis for interpretation. NAEP scores on the Y-axis are represented as the difference between the score predicted for a state based on its demographics and the actual mean for the state. Thus states with scores greater than zero beat their demographic odds whereas those with scores less than zero underperformed relative to their demographics. The participation rate on the X-axis is the percentage of the population of four-year-olds attending a state pre-K program. The red diagonal line represents the best linear fit to these data points.

Note that some states with above average participation rates such as Georgia and Florida are also above average performers on demographically adjusted NAEP scores in math and reading. These states are poster children for state pre-K in that they beat their demographic odds on NAEP and they have high levels of pre-K participation. But there are other states such as Massachusetts and Kansas for math and Massachusetts and Delaware for reading that do much better than the aforementioned states on NAEP but have much lower participation rates in state pre-K. There are other states such as West Virginia that have relatively high participation rates but below average performance on NAEP. Oklahoma’s pre-K program most closely matches the ideal as set forth by the Obama administration in that it is universal, has very high participation rates, and is staffed by certified teachers. However, 4th graders in Oklahoma do no better on reading than would be predicted from the demographics of their state and only modestly better in math.

What do I conclude?
- There are modest positive associations between enrollment levels in state pre-K and later academic achievement once demographic differences among states are taken into account.
- If these associations reflect a cause and effect relationship then raising the level of state pre-K enrollment would enhance academic achievement.[3]
- The impact of very substantial increases in the level of state pre-K enrollment (e.g., two standard deviations of current enrollment levels or about 32%) would likely be no more than a few points on NAEP.
- Raising NAEP scores a couple of points is worth pursuing in the context that national NAEP scores on reading in 4th grade were only four points higher in 2011 than they were in 1992, but this falls far short of the impacts that advocates of the expansion of state pre-K have touted based on extrapolations of findings from studies of a few high-cost, multiyear, boutique preschool programs from many years ago, such as Perry.
- If we are to move forward with a new federal program to support state pre-K programs we need to think carefully about the costs and benefits and figure out how to minimize the former while maximizing the latter.
As I see it the goals of efficient and effective pre-K programs are more likely to be achieved if states and the federal government:
- Invest as much as possible in supporting the costs for disadvantaged families to send their children to high quality preschool programs rather than spreading the resources thinly by providing a new preschool entitlement for all families;
- Allow parents to choose their preschool provider rather than creating a new zip code education system in which the local school district assigns preschoolers to schools;
- Assess the quality of individual program providers based on outcomes, such as the school readiness of the children they serve, rather than based on inputs, such as the credentials held by their teachers; and
- Nudge low-income parents who are receiving federal and state subsidies to choose high quality pre-K providers by such means as assuring that parents receive and consider information on center quality as part of the choice process, linking subsidy rates to center quality, and assuring that the reimbursement rates for the best pre-K centers are high enough to encourage them to compete for children whose tuition is covered by government.
[1] State pre-K participation rates are from the NIEER preschool yearbook, and state NAEP outcomes are from the NAEP data explorer.
[2] The control variables include the state’s median family income (from the Census), the state’s percentage of the school aged population that is non-white (from NCES), and the percentage of 4th graders who qualify for a free and reduced priced lunch (from NCES).
[3] The analyses I have reported are not intended to identify causal relationships. They substantially eliminate the possibility that the association between pre-K participation rates and NAEP scores is driven by demographics while leaving many other variables unexamined. Of particular concern is the possibility that states that have invested the most in their pre-K programs have also been more active than other states in instituting other education reforms. These other reforms could be responsible in whole or in part for the tendency of states with higher pre-K participation rates to perform better on NAEP.
The Brookings Institution is committed to quality, independence, and impact.
We are supported by a diverse array of funders. In line with our values and policies, each Brookings publication represents the sole views of its author(s).


