The global tightening cycle that started in 2022 to curb surging inflation has been unprecedented in speed, size, and international synchronicity. While higher interest rates can dampen activity through many channels, one often-neglected channel may turn out to be particularly important going forward: rising private sector debt burdens associated with past borrowing.
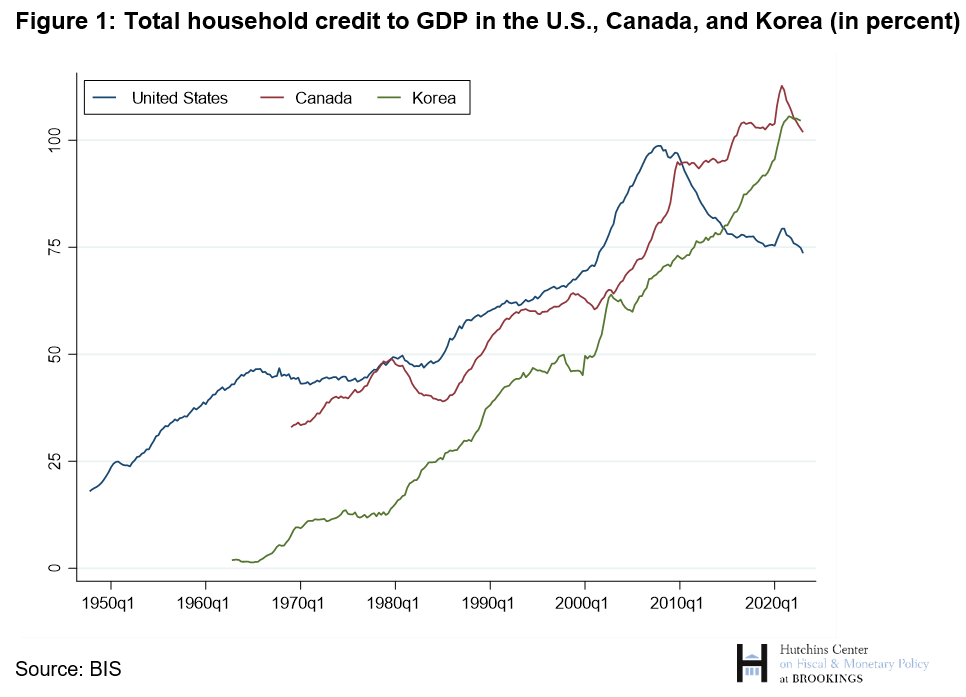
From a historical perspective, household debt levels in the U.S. as a fraction of GDP are high (Figure 1), even if they have come down substantially since the Global Financial Crisis (GFC). This deleveraging since the GFC has been facilitated by low interest rates, which prevailed for most of the post-crisis period and served to keep debt service costs manageable. Globally, household debt levels are equally at historical high levels, and many countries, such as Canada and Korea, have not seen any deleveraging since the GCF (also Figure 1). Hence, households and firms in the U.S. and many other economies may prove vulnerable to rapidly rising interest rates. Indeed, our research (Drehmann et al (2023)) highlights that past borrowing can cast a long shadow on economic activity.
In particular, examining the period from 1980 to 2019, we show that long-term debt—which comprises the bulk of private credit—together with natural inertia in the uptake of credit and transmission from policy rates to lending rates can lead to high debt service burdens which last long into the future. Importantly, we also show that higher debt service burdens reduce consumption and GDP. Hence, this propagation mechanism can cast a long shadow over future GDP growth, and more so the higher interest rates are and the longer they remain elevated.

The long-term debt propagation mechanism
Our research investigates a natural propagation mechanism through which rising debt-to-income ratios and higher interest rates systematically depress real activity for years in the future. The mechanism is rooted in the fact that most debt contracts are long-term and imply regular future debt service payments, consisting of interest and amortizations. During a credit boom, these future commitments pile up and eventually outweigh the flow of new borrowing. When this happens, the positive output effect from the credit boom reverses, and output falls.
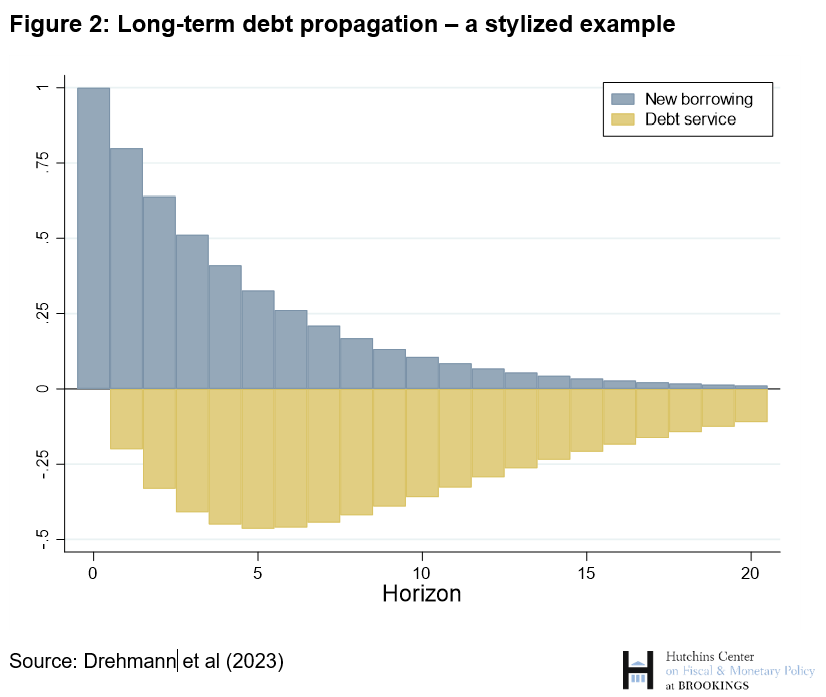
The mechanism can be illustrated in a stylized example that mimics a typical pattern during credit booms. The blue bars in Figure 2 correspond to new borrowing, which is highly persistent (or, in technical language, autocorrelated): once a boom in new borrowing has started, it typically lasts for several years. But new borrowing is not immediately repaid in the next period as the bulk of new debt is typically long-term—think, e.g., of mortgages.1 Hence, repayments kick in slowly and are even more drawn out. As a result, credit booms give rise to a buildup of debt which is mirrored by a hump-shaped pattern of debt service (i.e., interest payments and amortizations), as illustrated by the yellow bars in the figure.
This pattern implies that credit booms boost economic activity in the short term but lead to a reversal several years in the future. One of the drivers underlying this pattern is that borrowers consume a larger fraction of their available liquid funds than lenders, so that a positive net transfer from lender to borrowers boosts aggregate demand in the boom and, vice versa, depresses demand in the bust.

Long-term debt propagation in the data
A key question is how large the long-term debt propagation mechanism that we identify is in the data, and whether it gives rise to predictable movements in credit and GDP. Our paper shows two main results: (i) long-term debt propagation accounts for the bulk of the predictable credit-related dynamics for up to ten years into the future, and (ii) it has a sizable impact on real activity. Specifically, the pattern we describe accounts for the well-documented fact that output growth tends to systematically be high before a credit boom and to slow down for several years after a credit boom.
We assembled a novel multi-country dataset of debt flows and developed a statistical approach that allows us to isolate the long-term debt propagation mechanism from other forces in the data. Our sample covers 16 economies from 1980 to 2019.2
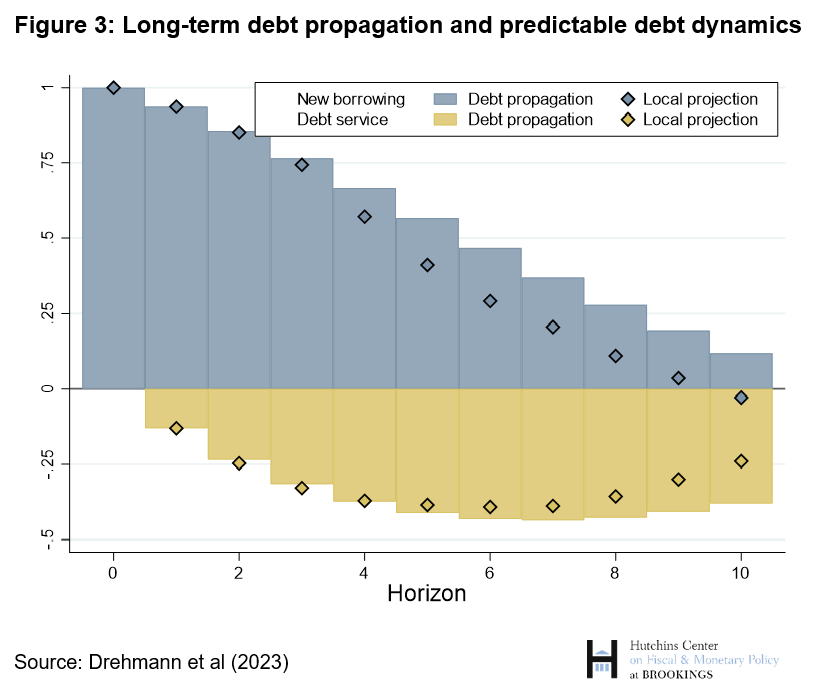
The blue and yellow bars in Figure 2 show the results of the estimated debt propagation mechanism following a 1% increase in new borrowing. The diamonds show the overall effects of a 1% impulse to new borrowing today on future new borrowing (in blue above the zero line) and on debt service (in yellow below the zero line), captured by what are technically called local projections. The blue and yellow bars capture what is predicted solely by the long-term debt propagation mechanism that we identified. As the figures illustrate, the patterns captured by the diamonds and by the bars are strikingly similar, especially for the first four to five years. This reflects that long-term debt propagation is responsible for the vast majority of dynamics in new borrowing and debt service after credit booms. The described patterns are also robust when we consider different time periods, control for alternative explanatory factors, and use different estimation techniques.

The systematic and predictable patterns of debt flows in Figure 3 have sizable effects on future output growth. A 1% increase in new borrowing increases one-year-ahead GDP growth by approximately 12 basis points, whereas a 1% increase in debt service reduces output by approximately 19 basis points. Again, these estimates are robust to changes in sample, alternative explanatory factors, and estimation techniques.
The real effects of long-term debt propagation are typically very large during credit booms. New borrowing is on average 4.6 percentage points higher than normal at the peak of credit booms. This implies a 0.55 percentage point boost to economic output. The subsequent peak in debt service is on average 2 percentage points above trend, depressing output by approximately 0.4 percentage points. Moreover, these effects accumulate as both new borrowing and debt service are persistent. Taken together, these dynamics give rise to substantial fluctuations in output.
Our results suggest that long-term debt propagation is a key mechanism through which debt and interest rates can affect GDP growth. Given pervasively high private debt level, the latest increase in interest rates will place an increasing drag on growth as households service their debts over the coming years. This is not only because rates may remain high for some time but also because debt contracts are long-lasting. The drag from debt servicing will be felt the fastest in countries with predominantly flexible rate mortgages, such as the United Kingdom or Australia, but in those countries, rates will reset to lower levels again if the rise in interest rates proves temporary. In countries where mortgages are predominantly fixed rate, such as the United States, various consumption-related loans are typically flexible rate and lead to similar dynamics.3 By contrast, the interest rates for mortgages are locked in for the maturity of the loan, and even though refinancing is possible in the U.S. if rates go down again, only a fraction of eligible borrowers do so.
Monetary policy needs to be mindful of the strong intertemporal tradeoffs generated by long-term debt propagation. Low interest rates front-load consumption but have the side effect of leading to the accumulation of debt, which borrowers need to pay off over a long period of time, during which economic growth is dragged down. The ability of monetary policy to alleviate this drag, should it find it desirable to do so (as it has done historically at points), is limited by the zero lower bound on the nominal interest rate.
At the current juncture, the calibration of monetary policy needs to be particularly mindful of the shadow of past borrowing. This shadow provides an underlying drag. To the extent that debt contracts have adjustable interest rates, raising interest rates today increases debt service payments on the stock of debt that has been accumulated over many years. This increases the drag on growth from past borrowing even further.
Long-term debt propagation also has financial stability implications. In past work, two of us have shown that a rising private debt service to income ratio is strongly associated with an increased risk of systemic banking crisis. And it is well known that such crises lead to longer and deeper recessions, as well as long-lasting output losses. At the minimum, authorities need to track the debt service flows from borrowers to lenders more closely to be able to alleviate some of these risks. But policymakers should also be mindful of its potential effect on the risk of financial crisis, using macro- and microprudential tools to manage it.
In sum, our results suggest that rising household debt service burdens should be a significant concern for policymakers and financial industry decisionmakers—especially considering recent global economic challenges. Better incorporating the long-term debt propagation mechanism in forecasts and policymaking and considering its implications for both economic activity and financial stability are crucial first steps.
-
Acknowledgements and disclosures
The Brookings Institution is financed through the support of a diverse array of foundations, corporations, governments, individuals, as well as an endowment. A list of donors can be found in our annual reports published online here. The findings, interpretations, and conclusions in this report are solely those of its author(s) and are not influenced by any donation.
-
Footnotes
- The typical contractual repayment period (maturity) for mortgage loans is above 20 years in most advanced countries.
- The countries are Australia, Belgium, Canada, Denmark, Finland, France, Germany, Italy, Japan, Korea, the Netherlands, Norway, Portugal, Spain, Sweden, the United Kingdom and the United States.
- The average share of mortgage credit to total household credit across countries was 78% most recently. The ratio was 68% in the United States in 2020 – the last data point we observe. Of this, close to 80% were fixed rate.


Commentary
Navigating the long shadow of high household debt
July 14, 2023