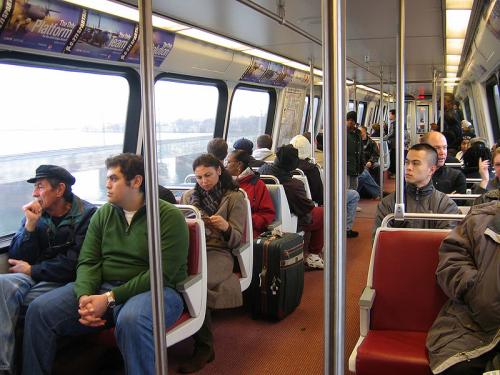
Public transit is a critical part of the economic and social fabric of metropolitan areas. Nearly 30 million trips are made every day using public transit. Almost all of these trips occur in the nation’s 100 largest metro areas, which account for over 95 percent of all transit passenger miles traveled. People take transit for any number of reasons, but one of the most common is to get to work.
View launch event highlights, featuring Cabinet secretaries Ray LaHood and Shaun Donovan »
However, when it comes to the question of how effectively transit connects people and jobs within and across these metropolitan areas, strikingly little is known. With governments at all levels considering deep budget cuts, it is increasingly important to understand not just the location and frequency of transit service, but ultimately how well transit aligns with where people work and live. To better understand these issues, the Metropolitan Policy Program developed a comprehensive database that provides the first comparable, detailed look at transit coverage and connectivity across and within the nation’s major metro areas.
An analysis of data from 371 transit providers in the nation’s 100 largest metropolitan areas reveals that:
Nearly 70 percent of large metropolitan residents live in neighborhoods with access to transit service of some kind. Transit coverage is highest in Western metro areas such as Honolulu and Los Angeles, and lowest in Southern metro areas such as Chattanooga and Greenville. Regardless of region, residents of cities and lower-income neighborhoods have better access to transit than residents of suburbs and middle/higher-income neighborhoods.
In neighborhoods covered by transit, morning rush hour service occurs about once every 10 minutes for the typical metropolitan commuter. In less than one quarter of large metro areas (23), however, is this typical service frequency, or “headway,” under 10 minutes. These include very large metro areas such as New York, Los Angeles, Houston, and Washington. Transit services city residents on average almost twice as frequently as suburban residents.
The typical metropolitan resident can reach about 30 percent of jobs in their metropolitan area via transit in 90 minutes. Job access differs considerably across metro areas, from 60 percent in Honolulu to just 7 percent in Palm Bay, reflecting variable transit coverage levels and service frequencies, and variable levels of employment and population decentralization. Among very large metro areas, the share of jobs accessible via transit ranges from 37 percent in Washington and New York to 16 percent in Miami.
About one-quarter of jobs in low- and middle-skill industries are accessible via transit within 90 minutes for the typical metropolitan commuter, compared to one-third of jobs in high-skill industries. This reflects the higher concentration of high-skill jobs in cities, which are uniformly better served by transit. It also points to potentially large accessibility problems for workers in growing low-income suburban communities, who on average can access only about 22 percent of metropolitan jobs in low- and middle-skill industries for which they may be most qualified.
Fifteen of the 20 metro areas that rank highest on a combined score of transit coverage and job access are in the West. Top performers include metro areas with noted transit systems such as New York, Portland, San Francisco, and Washington, but also Salt Lake City, Tucson, Fresno, and Las Vegas. Conversely, 15 of the 20 metro areas that rank lowest are in the South.
These trends have three broad implications for leaders at the local, regional, state, and national levels. Transportation leaders should make access to jobs an explicit priority in their spending and service decisions, especially given the budget pressures they face. Metro leaders should coordinate strategies regarding land use, economic development, and housing with transit decisions in order to ensure that transit reaches more people and more jobs efficiently. And federal officials should collect and disseminate standardized transit data to enable public, private, and non-profit actors to make more informed decisions and ultimately maximize the benefits of transit for labor markets.
Profiles of Transit Accessibility in the Largest 100 Metro Areas »
The Brookings Institution is committed to quality, independence, and impact.
We are supported by a diverse array of funders. In line with our values and policies, each Brookings publication represents the sole views of its author(s).


