Introduction
The Brookings Iraq Index presents numerical information on a range of security, economic, and political indicators of pertinence to the future of that country as well as the U.S. role within it. The Index was originally created in the early years of the 2000s, after a U.S.-led coalition overthrew Saddam Hussein, and sought to help Iraqis build a state that could avoid dictatorship and extremism going forward. Our goal, then and now, is to present a wide enough array of information to gauge many aspects of the effort, without swamping a reader in so much detail or arcana as to obscure attention to the big-picture policy questions facing the United States and its allies and partners there.
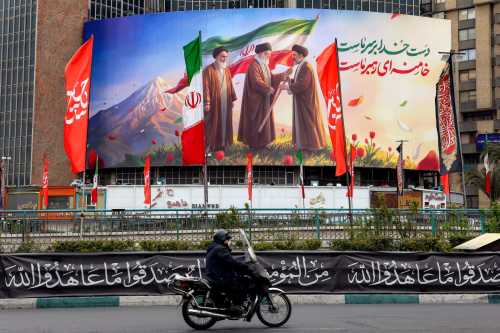
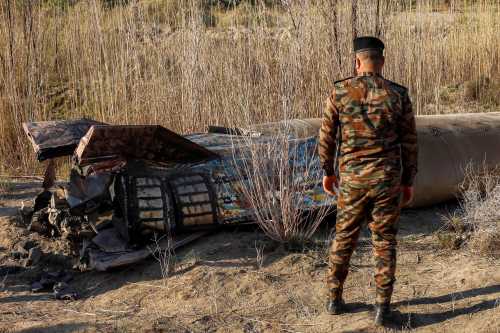
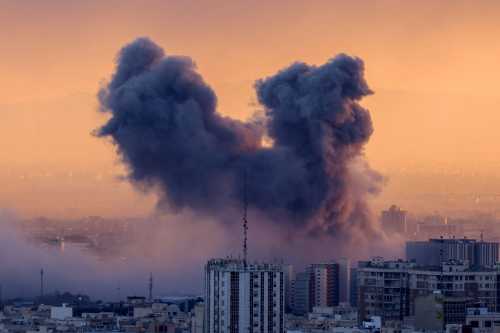
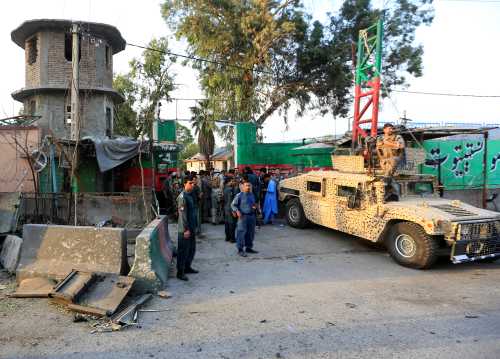
No compilation of statistics can ever convey whether a counterinsurgency campaign is being won or lost, and whether a country is managing to stabilize itself or not. This lesson was learned in Vietnam and must never be forgotten. But careful compilation and study of metrics, recognizing the uncertainties and complexities of the data going into them, can nonetheless provide grist for policy debates — and keep those policy debates grounded in empirical reality. As the data show, Iraq remains a troubled land — but is far improved by most indicators, at least for the moment, relative to many times in its past. It is gradually becoming a middle-income country, with notable improvements in the quality of life in recent times — even as corruption remains endemic, jobs for many youth remain scarce, and sectarian pressures (often inflamed by Iran) always threaten to boil over yet again.
Key Figures
Iraqi GDP estimates, 2002-201812 |
||||
| Year3 | GDP (constant 2010 U.S. dollars, billions) | Real GDP growth (%) | GDP per capita (constant 2010 U.S. dollars, billions) | Real GDP per capita growth (%) |
| 2002 | 96.8 | -6.9 | 3,881 | -9.6 |
| 2003 | 64.7 | -33.1 | 2,524 | -34.9 |
| 2004 | 99.8 | 54.2 | 3,792 | 50.2 |
| 2005 | 104.2 | 4.4 | 3,869 | 2.0 |
| 2006 | 114.8 | 10.2 | 4,181 | 8.0 |
| 2007 | 116.4 | 1.4 | 4,169 | -0.3 |
| 2008 | 125.9 | 8.2 | 4,436 | 6.4 |
| 2009 | 130.2 | 3.4 | 4,493 | 1.3 |
| 2010 | 138.5 | 6.4 | 4,657 | 3.6 |
| 2011 | 148.9 | 7.5 | 4,848 | 4.1 |
| 2012 | 169.7 | 13.9 | 5,322 | 9.8 |
| 2013 | 182.6 | 7.6 | 5,508 | 3.5 |
| 2014 | 183.9 | 0.7 | 5,344 | -2.9 |
| 2015 | 188.5 | 2.5 | 5,298 | -0.9 |
| 2016 | 217.1 | 15.2 | 5,931 | 11.9 |
| 2017 | 211.7 | -2.5 | 5,638 | -4.9 |
| 2018 | 210.5 | -0.6 | 5,477 | -2.8 |
Rachel Slattery performed graphic design for this report.
Related Content
Authors

-
Footnotes
-
These numbers are estimates provided by the World Bank, as there is some discrepancy between sources over the exact GDP value for certain years. Both GDP and GDP growth rate, as well as per capita, are adjusted for inflation and demonstrate the real GDP values for the given year. - “GDP (current US$) – Iraq,” The World Bank, https://data.worldbank.org/indicator/NY.GDP.MKTP.CD?cid=DEC_SS_WBGDataTwitter_EXT&end=2018&locations=IQ&start=2003. O’Hanlon and Livingston, “Iraq Index: Tracking Variables of Reconstruction and Security in Post-Saddam Iraq.”
- In 2002, the Iraqi population was 24,931,919; by 2019, the population had grown to 39,309,800.
-
These numbers are estimates provided by the World Bank, as there is some discrepancy between sources over the exact GDP value for certain years. Both GDP and GDP growth rate, as well as per capita, are adjusted for inflation and demonstrate the real GDP values for the given year.
The Brookings Institution is committed to quality, independence, and impact.
We are supported by a diverse array of funders. In line with our values and policies, each Brookings publication represents the sole views of its author(s).