While the rest of the world (including India) is assessing whether higher interest rates for longer is the new norm, China has cut rates, and the economy has entered deflation territory. The debt crisis has deepened with the default by the second largest property developer in China, Country Garden. China will no longer be publishing unemployment rates for those in the age group 16-24. Meanwhile, across the border, the economy in India could not be better. GDP growth is likely to top 7 percent (per capita 6.2 percent) in 2023, and unemployment rates are at a 12-year low of 4.1 percent.
Geopolitics has turned attention away from China—and toward India. Economics is responsible for this change, not geopolitics. In 2019, Indian PPP per capita incomes were 47.5 percent of China’s. We estimate that convergence in per capita income levels for India-China is very possible (and latest) by 2044. This means that per-capita growth rates in India should be higher than China on a sustained basis. This had already started to happen in the previous decade. Between 2010 and 2019, per capita GDP growth in India was higher than China: 5.2 percent versus 4.5 percent. This marked the first decade after the 1960s when India grew faster than China.
Convergence means the two incomes should be equal, or a ratio of 100. What will make the long road from 47.5 to 100 possible? Each determinant of growth (labor, capital, human capital, and TFP (total factor productivity) will likely play a part.
We date the start of our analysis/assessment/forecast from the last pre-COVID year of 2019, and estimate for the long run of next 25 years (till 2044).
Labor and human capital
Education
There is a revolution of aspirations associated with female education expansion in India. This expansion is an important X factor in the march toward convergence. It has also begun to show up in the data. There are more women in college in India today than men, and women in STEM disciplines (about 43 percent of women graduates) are among the highest in the world. In the U.S., 32 percent of female students graduate from STEM fields. This trend is suggestive of (and our expectation) that the female labor force participation rate (FLFPR) in India will move toward at least 50 percent over the next two decades.
Labor Force
Potential labor force (population age group 15-64 years) in China is expected to decline by 0.7 percent per year. China already has very high labor force participation rate (LFPR of 75 percent) and there is little prospect for it moving upward.
A mirror opposite of China is India. Potential labor force is expected to increase by 0.72 percent per year. However, LFPR for India, at 51 percent, is substantially lower than China. The difference between India and China LFPR is entirely because LFPR for women in India is around 25 to 35 percent (depending on definition) while China’s female LFPR is 70 percent!
Given the evidence presented above on female education and STEM (two strong correlates of labor force participation) it is reasonable to expect that Indian female LFPR will reach at least 55 percent over the next two decades. This will mean an expansion of effective labor force in India of 1.8 percent per year (increase per annum in labor force 0.7 percent and increase per annum in LFPR of 1.1 percent).
Advantage India: 2.5 percent (1.8 percent India, -0.7 percent China)
Physical capital
High aggregate rates of investment in China are set to decline from the 40+ levels over the last two decades—and Indian investment levels to increase from the 30+ levels. In China housing sector investments are a drag; in India public infrastructure investments are a huge plus. Going forward, investment levels in both countries are expected to converge in the mid-30s. Higher investment rate will add approximately 0.75 percent per annum growth for India; lower investment rate will subtract approximately 0.75 percent per annum growth for China.
Advantage India: 1.5 percent per annum.
Total factor productivity (TFP) growth
Also advantage India—over the last 20 years, Indian TFP growth exceeded that of China by 0.5 percent per annum. Over the last 10 years, excess TFP growth was 1.5 percent per annum.
A conservative conclusion—India to grow at an average 3.5 percent faster rate than China, 2020-2045
Assuming the share of labor to be 60 percent, and excess India labor/capital growth as 2.5 percent and 1.5 percent respectively, we obtain excess growth in India as: 0.6*2.5 + 0.4*1.5 = 2.1 percent. Excess TFP growth is 1.5 percent, hence aggregate excess growth for India is equal to 2.1 + 1.5 or 3.6 percent.
The first giant step toward convergence happened about a decade ago. In 2014, India’s per capita 2017 Purchasing power parity (PPP) income was 43 percent of China’s, the lowest in the modern era. Adding relative changes in demographics, education, labor force, investment, and productivity, it is likely that per capita growth in India will increase at more than 3.5 percent relative to China. Ultimately, the difference in growth rate of per-capita GDP in both countries will determine how fast Indian incomes catch up to those in China.
Given the information available as of 2023, a best guess is that it may take less than 22 years for per-capita incomes in both these countries to converge to a similar level. The chart below documents the evolution of India-China per-capita incomes from 2000. Excess per capita growth of 3.5 percent per annum (from 2019) will allow equality to be reached in 22 years (in 2041); 3.75 percent in 20 years; 4 percent in 19 years; and an unlikely low-ball estimate of just 3 percent per annum will mean convergence in 2045.
The long history of convergence favors India. For approximately 480 years (between 1500 and 198012) China and India had the same per capita income (constant PPP$). Then came the big divergence for 44 years; at its peak, in 2014, China’s per capita income was 2.34 times that of India. History does repeat itself, sometimes in a V-shaped pattern. The path to re-convergence is likely to take less than 30 years.
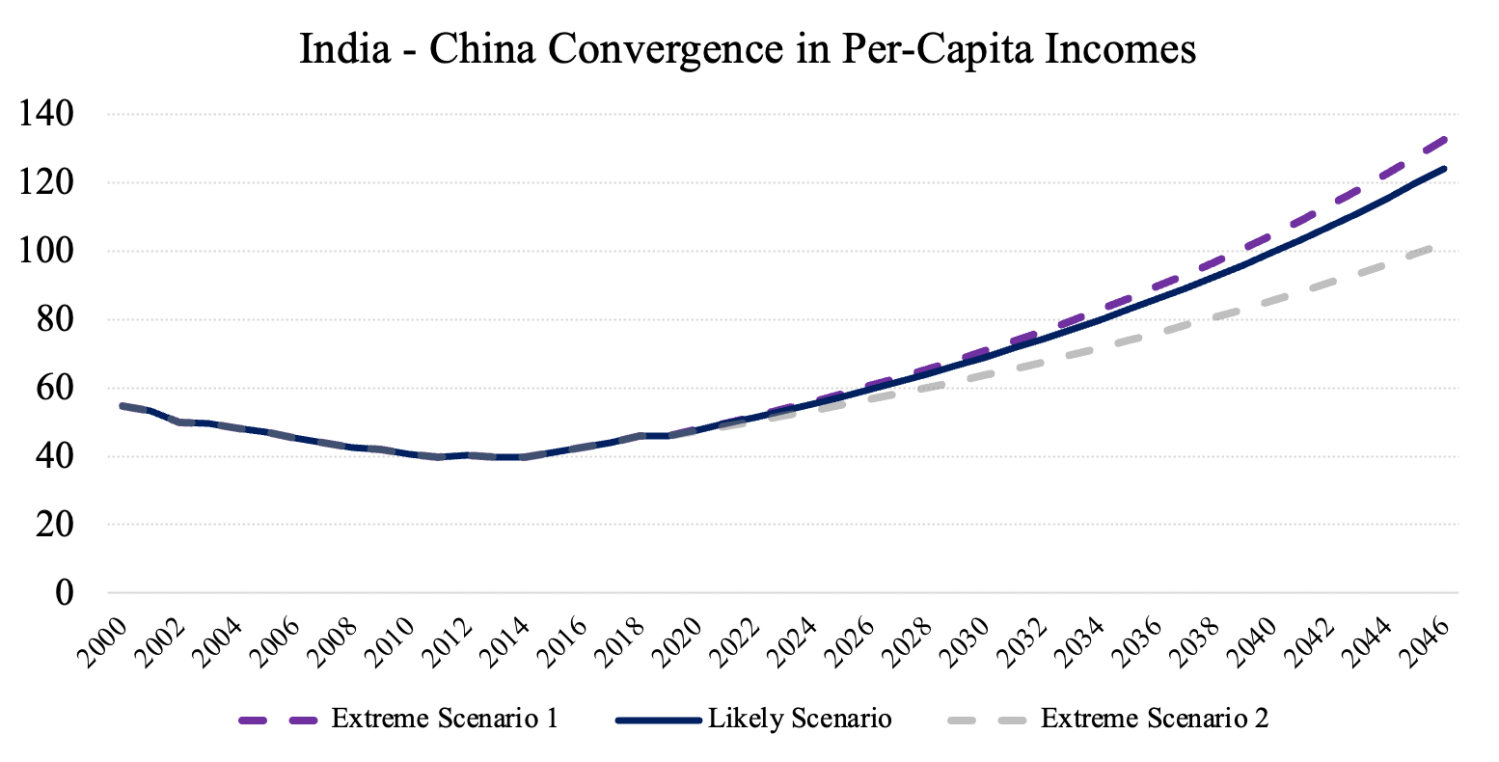
Source: Authors’ calculation.
Authors


-
Footnotes
- The New Wealth of Nations (2017), see Chapter 4 Progress: Lost in 480 years, Gained in 48 years.
- Bhalla, Surjit S. (2007). (mimeo) The Middle Class Kingdoms of India and China. Peterson Institute for International Economics, Washington, DC.
The Brookings Institution is committed to quality, independence, and impact.
We are supported by a diverse array of funders. In line with our values and policies, each Brookings publication represents the sole views of its author(s).

Commentary
India—China: Reversal of fortunes?
September 14, 2023