This post is part of “Teacher diversity in America,” a series from the Brown Center on Education Policy that examines minority underrepresentation among public educators in the U.S.
Minority teachers can impact minority students, but the public teacher workforce employs too few of them. As we’ve described in prior posts in this series on diversity in the teacher workforce, this is a problem in almost every region of the country and deserves our attention.
In this installment, we tackle the question of how we actually go about measuring minority representation (or lack thereof) among teachers. As we have written about and researched teacher diversity, we often find ourselves frustrated with the measure that is often referred to as “the diversity gap,” which is the most common way to quantify diversity among teachers. It has become clear to us that its shortcomings outweigh its usefulness and we feel it is time to explore other options.
In this post, we consider three alternative ways to measure diversity in the teacher workforce. Though no single approach we present here is perfect, considering the underlying ideas that each measure represents is a valuable exercise in thinking about how our metrics align with the aspirational values we want to convey when measuring diversity. We believe this discussion is important because how we measure teacher diversity across the country will almost certainly influence policymakers’ and practitioners’ priorities about where minority teachers are most needed.
Student-based diversity gaps and their shortcomings
The diversity gap is the most common method in analyses focusing on the topic. It is calculated by taking the difference between the share of minorities among full-time public school teachers from the share of minority students in the population. For example, roughly 50 percent of students are racial minorities nationwide, compared to fewer than 20 percent of teachers—producing a national diversity gap of roughly 30 percentage points. The intuition underlying this measure is that teachers should be as diverse as the students they serve.
Here is a map representing the student-based diversity gap in the U.S. (and what we presented in our last post):

Though this metric is commonly utilized amongst researchers and education experts, it has its problems. First, it overlooks the demographic reality that the adult population is not as diverse as the child (student-age) population. Therefore, even if a proportionate share of minority adults went into teaching as a profession, we would still be far shy of reaching student-teacher parity.
Second, the diversity gap applied to schools implies teacher demographics should match their students. But in a system in which schools are settings where students were historically and continue to be segregated by demographics, this would push us toward a segregated workforce. Instead, given this context, we should actually prefer a teacher workforce at the school level that is more diverse than its students.
And third, the numerical properties of the diversity gap—which nets out the underlying student demographic—do not enable it to be compared across different locales or over time in ways that are helpful. Having a metric that is more universally comparable is desirable.
Here we propose three different diversity metrics to address the shortcomings above. For each of the three alternative measures, we provide a map using data from the American Community Survey (ACS) and calculate diversity measures at the level of public use microdata areas (PUMAs)—Census-designated areas corresponding to regions of states containing at least 100,000 people. For brevity, we calculate each measure of diversity based on any minority status (black, Hispanic, others including Asian and Native American). We present the maps containing the breakdown by race/ethnicity group for each measure at the bottom of this post.
Diversity gaps based on adult population
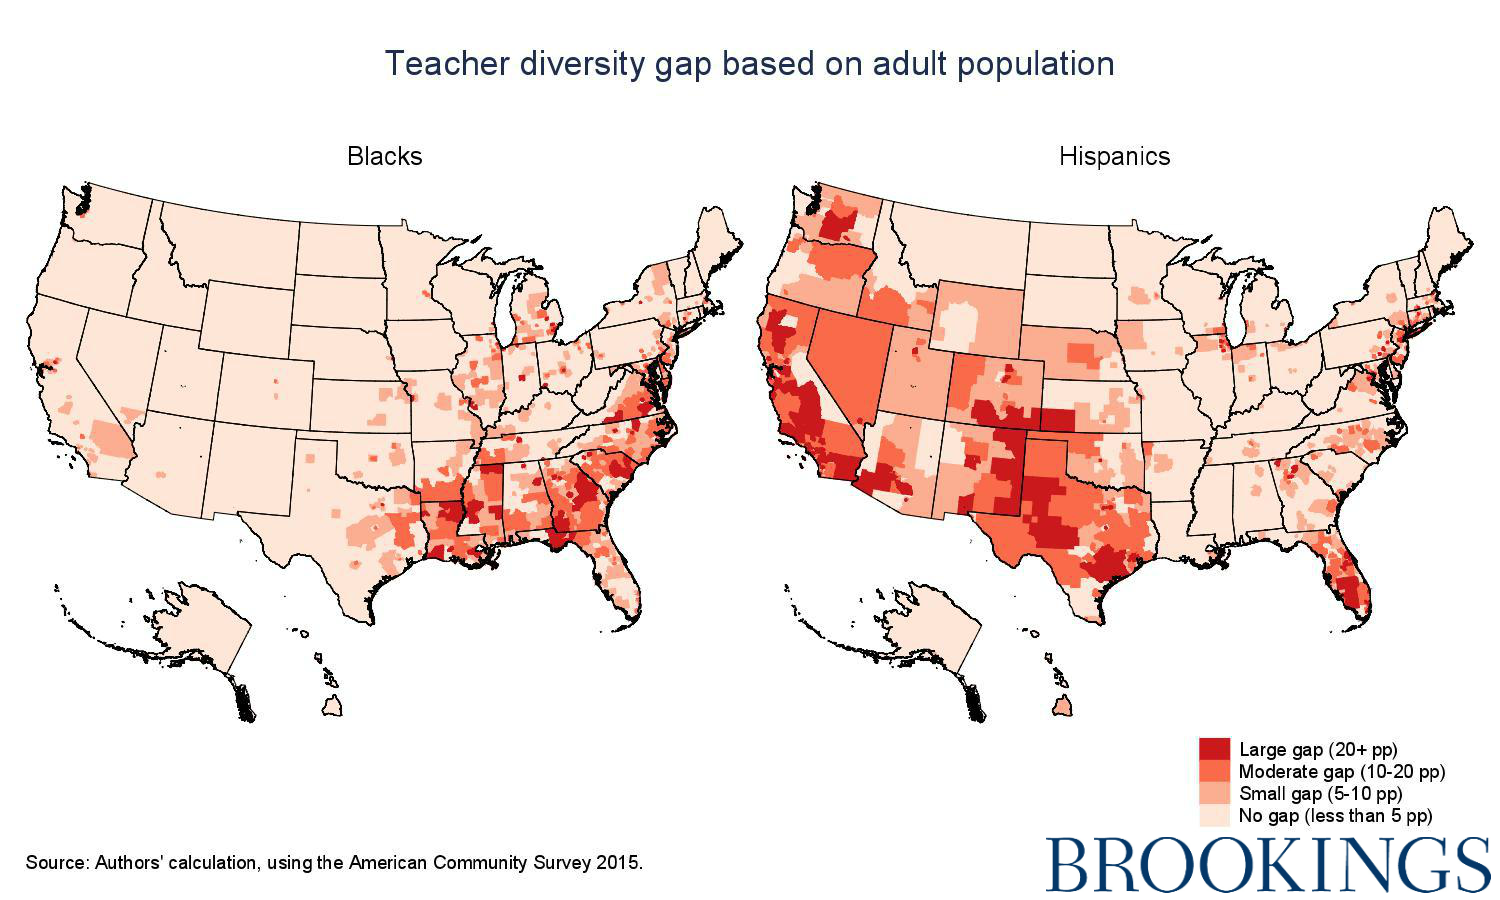
Our first alternate measure calculates a diversity gap, though with a slightly different reference group. Instead of comparing against students, this diversity gap is calculated as the difference between the share of minorities among the adult population (people aged 21-65) and the share of minorities among full-time public teachers. This is a more realistic baseline for comparison than the student-teacher metric.
In the last decade, U.S. schools have experienced a shift in their student demographics, driven by both immigration and racial differences in fertility rates—including low fertility rates among whites. Consequently, the share of minority students between 2003 and 2013 rose from 41 to 50 percent. Although the racial/ethnic composition of the adult population has changed slightly in the last decade, it has not matched the shift in the student-age population of children. Since minorities make up 34 percent of adults nationally, our adult-based diversity gap is considerably smaller, approximately 14 percentage points—less than half of the student-based diversity gap.
Figure 1 maps out the minority adult diversity gap down to the PUMA level. We categorize the gaps into four groups: “No gap” means the difference in adult and teacher representation is less than 5 percentage points; “small gap” represents gaps of 5-10 percentage points; “moderate gap” represents gaps of 10-20 percentage points; and “large gap” represents gaps of 20 percentage points or more.

The above map shows adult-based diversity gaps are still widespread, though not nearly as deep as the student-based diversity gaps—and should be more encouraging to education administrators. This approach highlights regions where minority adults are systematically underrepresented as teachers, and thus might encourage teacher preparation programs and school districts to join forces to promote more minority participation.[1]
Target-based diversity gaps
The second shortcoming of the common diversity gap is that, in a system where students are often racially isolated, it implicitly endorses similar isolation among teachers. In this regard, we believe the common diversity gap sends the wrong signal about diversity, particularly at the extreme ends of the minority representation spectrum.
For example, in regions of Maine and West Virginia both students and teachers are almost entirely white, but providing these students with a diverse teacher workforce is beneficial beyond racial matching. Teachers of color can help white students break down negative stereotypes about people of color, and a diverse teacher workforce in a heavily segregated district may help improve race relations to prepare students to participate in a multiracial society.
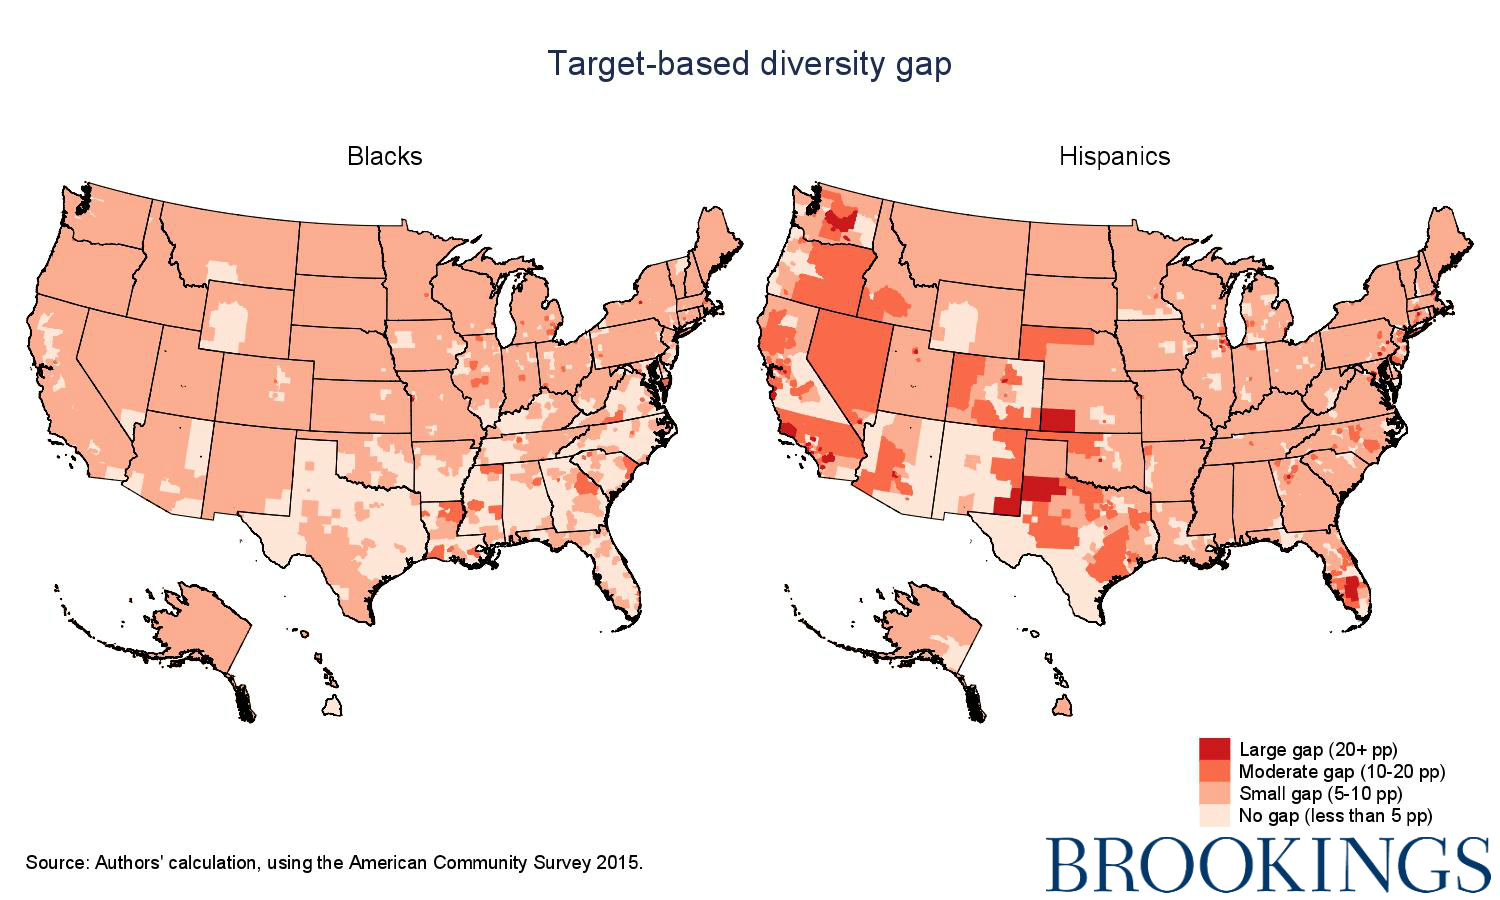
The second alternative measure addresses this issue by proposing a diversity target for minority teachers in each PUMA. This target is defined by the maximum between 50 percent of the national share of the minority adult population (17 percent) and 50 percent of the minority student population in the PUMA. The diversity gap is calculated as the difference between the target and the share of minority teachers among the teacher workforce. Exceeding the target does not benefit a district.
This metric penalizes regions with predominantly white adult and white student populations by setting a higher target on them, while still holding higher targets for regions with large shares of minority students without endorsing full segregation.
The map below shows the target-based diversity gap.

Under this measure, the diversity gap distribution across states is almost the inverse of what we originally observed. However, this measure may still be flawed as it may not be realistic for districts in rural Wyoming, for example, to really hire enough minority teachers to meet these targets.
Student-teacher parity index
Lastly, we desire a measure that is more comparable across contexts. For example, consider two school districts: 70 percent of District A’s students are minorities and 50 percent of its teachers are minorities; meanwhile, 25 percent of District B’s students are minorities and 5 percent of its teachers are minorities. Each has a 20-percentage-point difference in representation between students and teachers, but the standard diversity gap ignores the context.
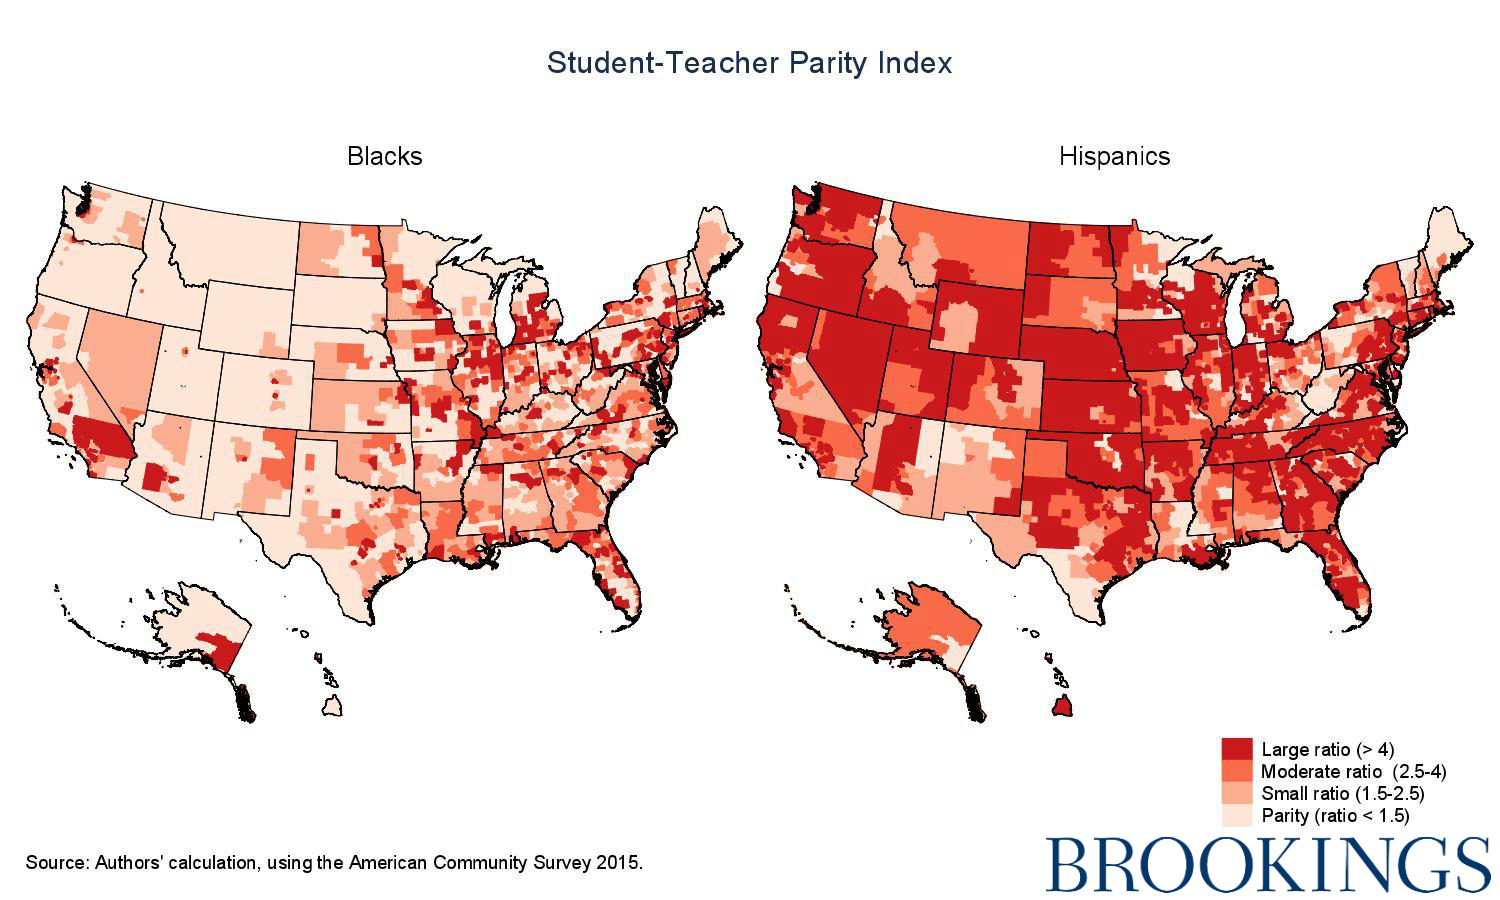
To address this issue, we use a student-teacher parity index calculated as of the share of minority students to the share of minority teachers. Though a variant of this measure has been occasionally used in research,[2] it helps us to explore opportunity for potential exposure between students and teachers, regardless of the size of the minority population in a region.
Given that this new measure is a ratio and no longer a gap, we relabel our four categories in the map in Figure 4: “parity” means the student-teacher parity index is less than 1.5; “small ratio” represents an index value of between 1.5 to 2.5; “moderate ratio” represents a value of 2.5 to 4; and “large ratio” represents index values greater than 4.

Interestingly, the parity index tends to be large in areas where minority-student shares are fairly modest, but still sizeable (approximately between 15-30 percent). This includes many areas of the northern half of the continental U.S.; minority students in these regions, including many rural areas, have a more pressing need for access to teachers that look like them than most in the South.
Considering alternatives
Which of these needs should be most satisfying as we consider teacher diversity? This is a subjective value judgment that may differ across communities. But in our view, the common diversity gap should be critically challenged to make way for an alternative that better aligns with public goals about the value of diversity and are more accurate representations of students’ diversity experiences.
Footnotes
- We also estimated a diversity gap that controls for the underlying student population with a regression model and flags locales based on deviations from their expected level of diversity in the teacher workforce. This method was highly correlated with both the student- and adult-based diversity gaps presented here, and for brevity we omit its discussion in this post.
- Villegas, Strom, and Lucas (2012) propose a student-teacher parity index. We use the inverse so that, when compared with the diversity gaps presented here, they point in the same direction where greater index values represent greater differences in diversity between students and teachers.




Commentary
4 ways to measure diversity among public school teachers
November 17, 2017