
This publication is part of a broader series examining the potential of office-to-residential conversions across six U.S. case studies. The project is part of a cooperative agreement with the US Department of Housing and Urban Development, and the research team is composed of contributors from Gensler, HR&A Advisors, Brookings, and Eckholm Studios.
Los Angeles County is the 20th-largest economy in the world, yet the city of Los Angeles has suffered from persistently elevated rates of poverty and homelessness—the latter driven by a long-standing housing crisis. Moreover, since the COVID-19 pandemic, the city’s commercial core has experienced soaring office vacancies and declining residential rents, even as it still lacks affordable housing. Los Angeles is no stranger to adaptive reuse: In 1999, the city adopted an Adaptive Reuse Ordinance, the scope of which was geographically expanded in 2003. The area the ordinance covered gained 12,000 units as a result.
However, as with the pace of residential delivery in Los Angeles generally, much more must be done to meet the city’s housing needs and revive its downtown’s fortunes. In recognition of this fact, the city adopted a Citywide Adaptive Reuse Ordinance in 2024, aiming to encourage conversions across Los Angeles by reducing regulatory barriers. Yet the city government’s efforts are limited by the state’s inaction on building code reform and by fiscal straits resulting in part from California’s Proposition 13.
Los Angeles history and context
Originally home to the indigenous Chumash and Tongva tribes, Los Angeles saw Spanish and then Mexican rule before California became a U.S. state in 1850. The California Gold Rush, alongside the construction of the Transcontinental and Sante Fe railroads, began to draw additional migration to the previously lightly populated area.
In the 20th century, Los Angeles became globally famous as the home of Hollywood. However, it was actually the discovery of oil that brought rapid population and economic growth to LA. Between 1900 and 1940, the city’s population skyrocketed from 102,479 to over 1.5 million, more than doubling between 1920 and 1930. By the 1920s, California produced approximately 30% of the nation’s crude oil supply.
As the city’s population grew, suburbs formed at the end of streetcar lines and around newly discovered oil fields. Completion of the Los Angeles Aqueduct in 1913, which ran water from Eastern California to the San Fernando Valley, enabled the city to expand further. Manufacturing and agriculture also made up a cornerstone of the region’s economic growth: The Ford Motor Company opened an assembly line in Long Beach, World War II spurred a local defense industry, and the port facilitated international trade.
During this rapid growth through the first half of the 20th century, discriminatory home lending practices by the Federal Housing Administration (FHA) attempted to concentrate and segregate minorities in the central city, favoring the construction of low-density suburbs for white families. These suburbs, such as Lakewood, were characterized by single-family detached homes reliant on arterial highways. As elsewhere, urban renewal projects following World War II targeted minority and working-class neighborhoods deemed “blighted.”
The 1980s and 1990s witnessed new triumphs and challenges for Los Angeles. The 1984 Olympic Games was wildly profitable. At the same time, the local aerospace industry and real estate market crashed, and competition from abroad depressed the manufacturing industry. In 1991, the brutal police beating of Rodney King led to riots, both captured on video for all to see.
Today, Los Angeles County ranks as the 20th-largest economy in the world, and Los Angeles’ old industries such as aerospace and manufacturing are now complemented by emerging fields such as bioscience technology. It still has an unusually high proportion of arts, entertainment, sports, and media workers. Yet Los Angeles is also home to some of the nation’s highest levels of homelessness, and over 16% of its residents live below the federal poverty line—1.4 times the rate of California as a whole.
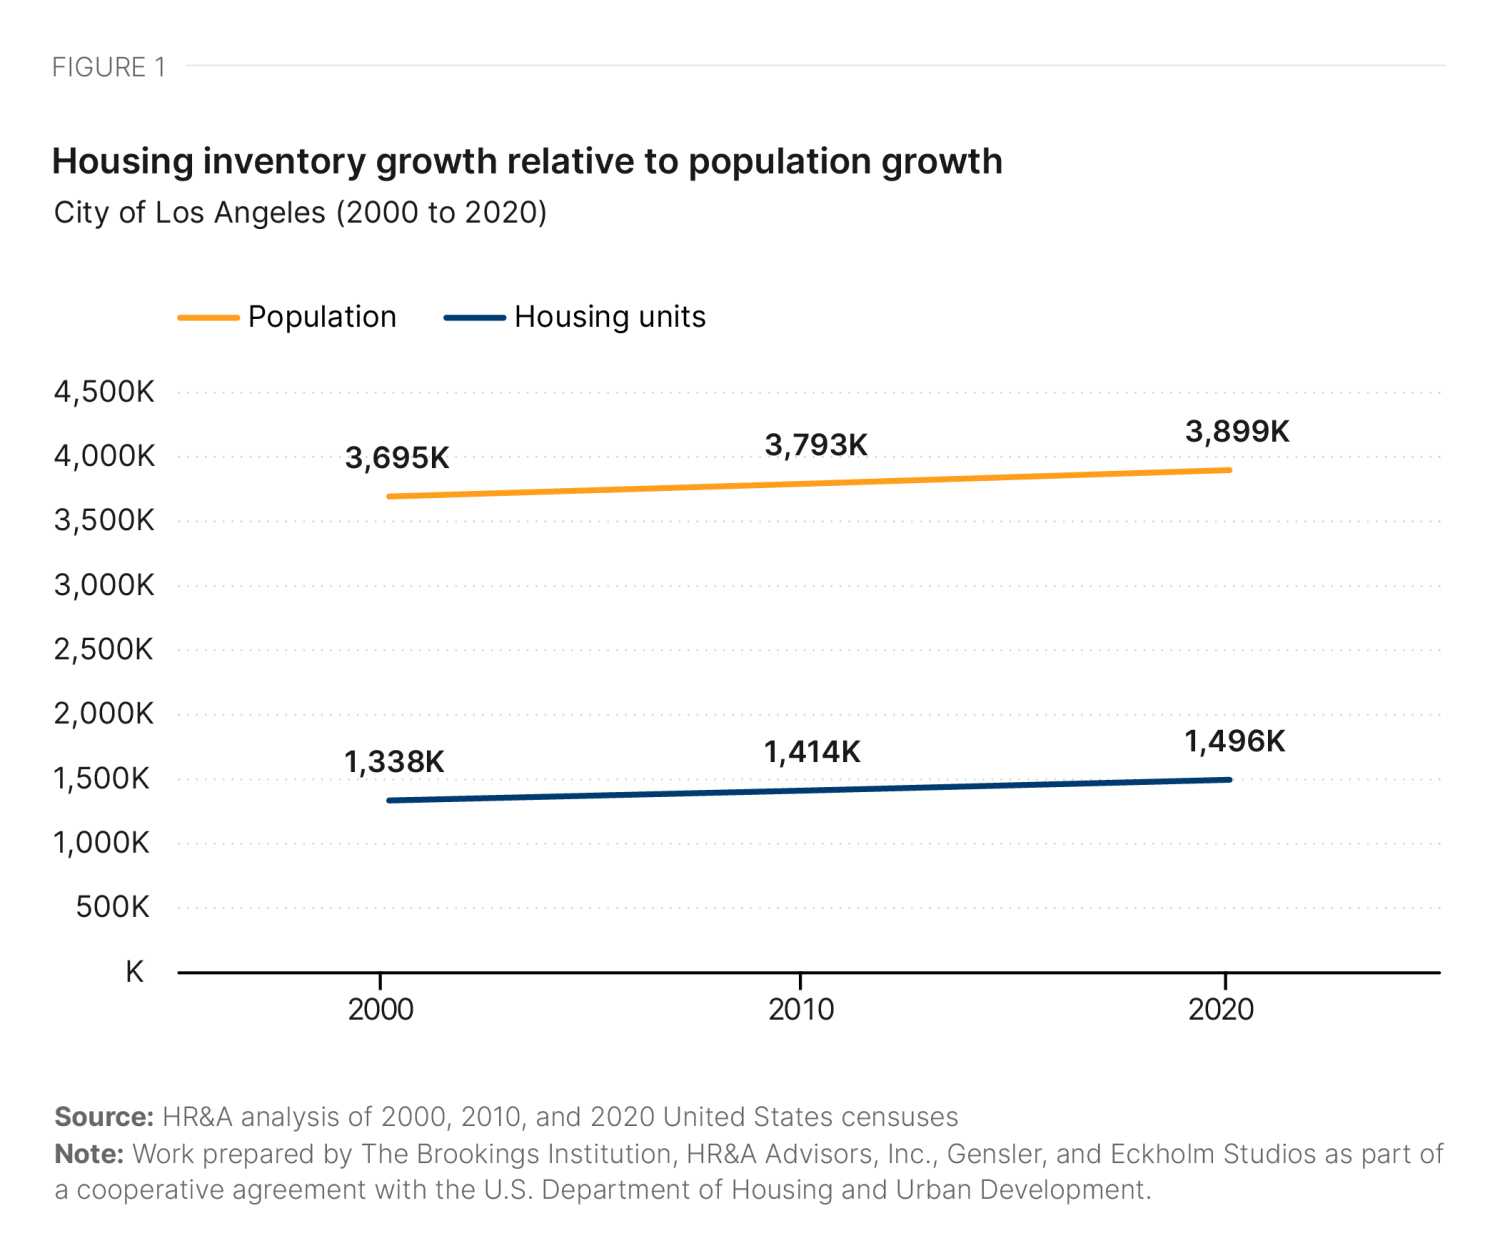
In short, Los Angeles is in desperate need of more housing. Between 2000 and 2020, Los Angeles grew by more than 203,000 residents while adding almost 160,000 net housing units (Figure 1), only slightly addressing the overall shortage.
Property taxes are the largest source of general fund revenue (35%) in the Los Angeles city budget, and have dramatically grown—almost doubling since 2010. The largest driver of this growth has been single-family residential home transactions. Since 1978, a state referendum known as Proposition 13 has strictly capped the growth of all assessed values for real property (both residential and commercial) at 2% per year. Over time, if actual transaction prices rise more than 2% per year, this creates a large gap between the market value and the assessed value of a property. When a property is sold, however, it is reassessed and the market value becomes the new base year value. This has the effect of producing a big incentive to hold property. Legal strategies to extend these holds over generations via corporate ownership are available—to those who can afford them. Over the almost five decades since Prop 13, single-family residential homes have gradually increased as a share of Los Angeles’ taxable value, while commercial and industrial property have proportionately gradually declined.
There are two notable fiscal issues with the Prop 13 cap. First, if the cost of services grows at more than 2% (and the annual rate of inflation is typically over 2%), then the tax base to support services will not grow fast enough to keep up without abundant new construction or revenue sources. This is one of the structural issues creating an anticipated multiyear municipal budget deficit in one of the most productive places in the country. Second, the Prop 13 disincentive to sell creates a structural lack of dynamism in the real estate sector that may impact office-to-residential conversions, which often begin with a transfer of ownership.
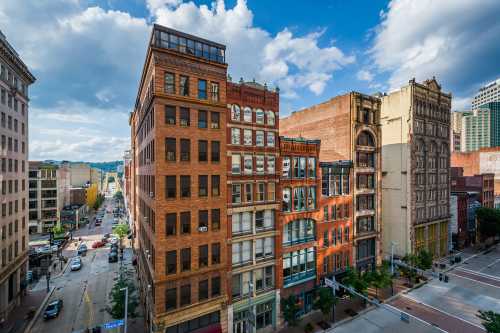
Downtown footprint and demand
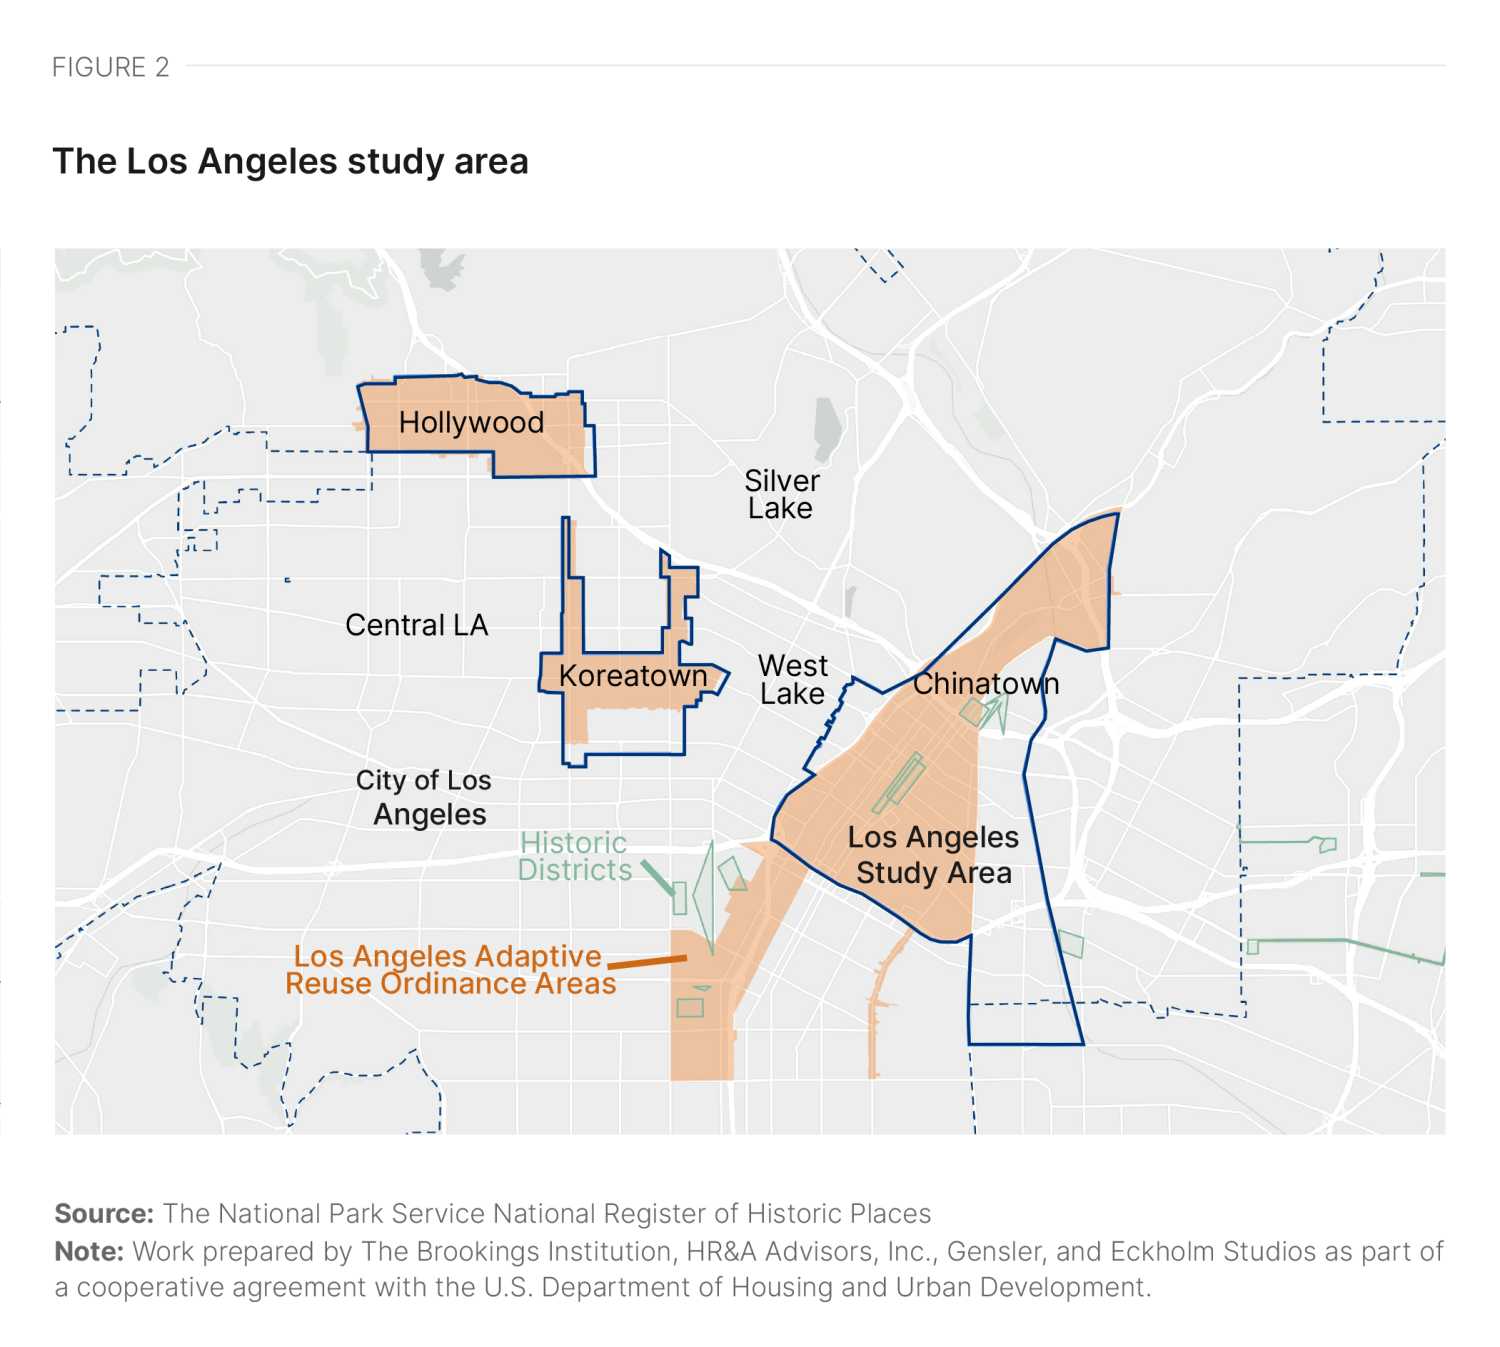
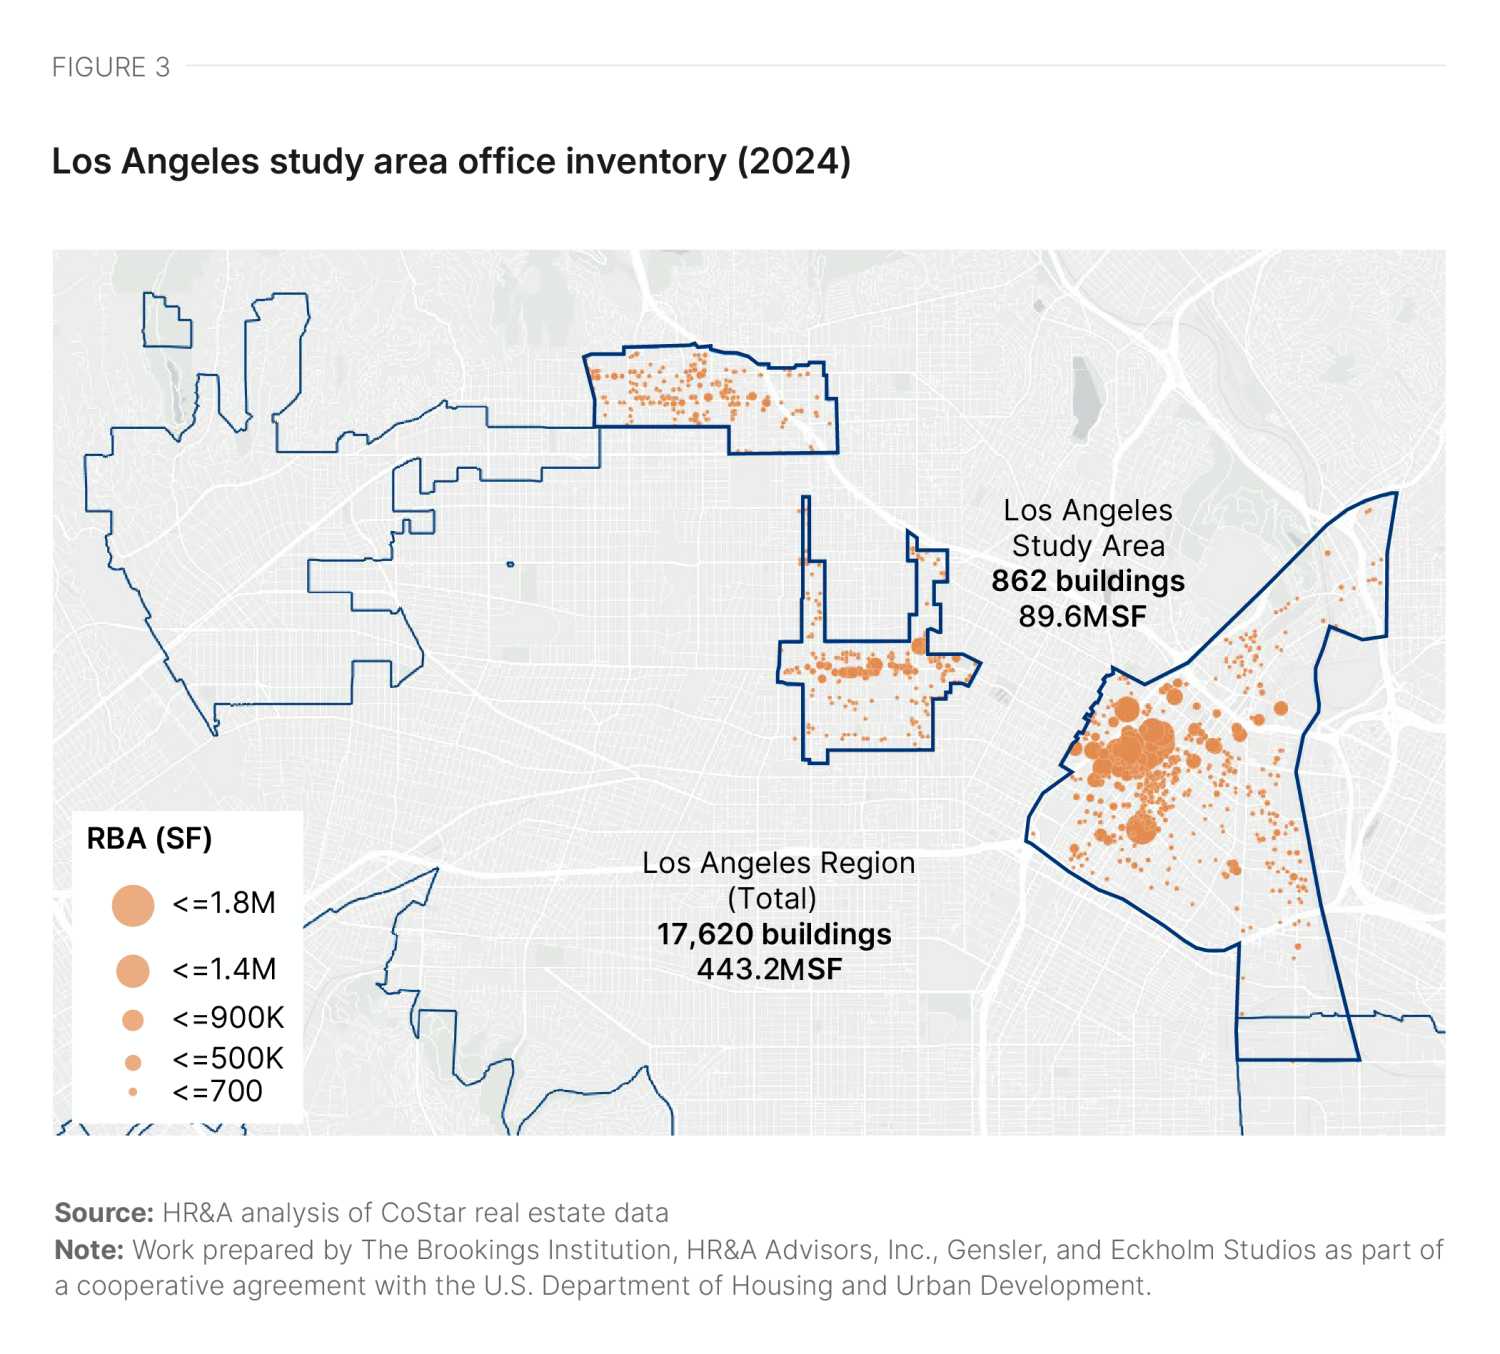
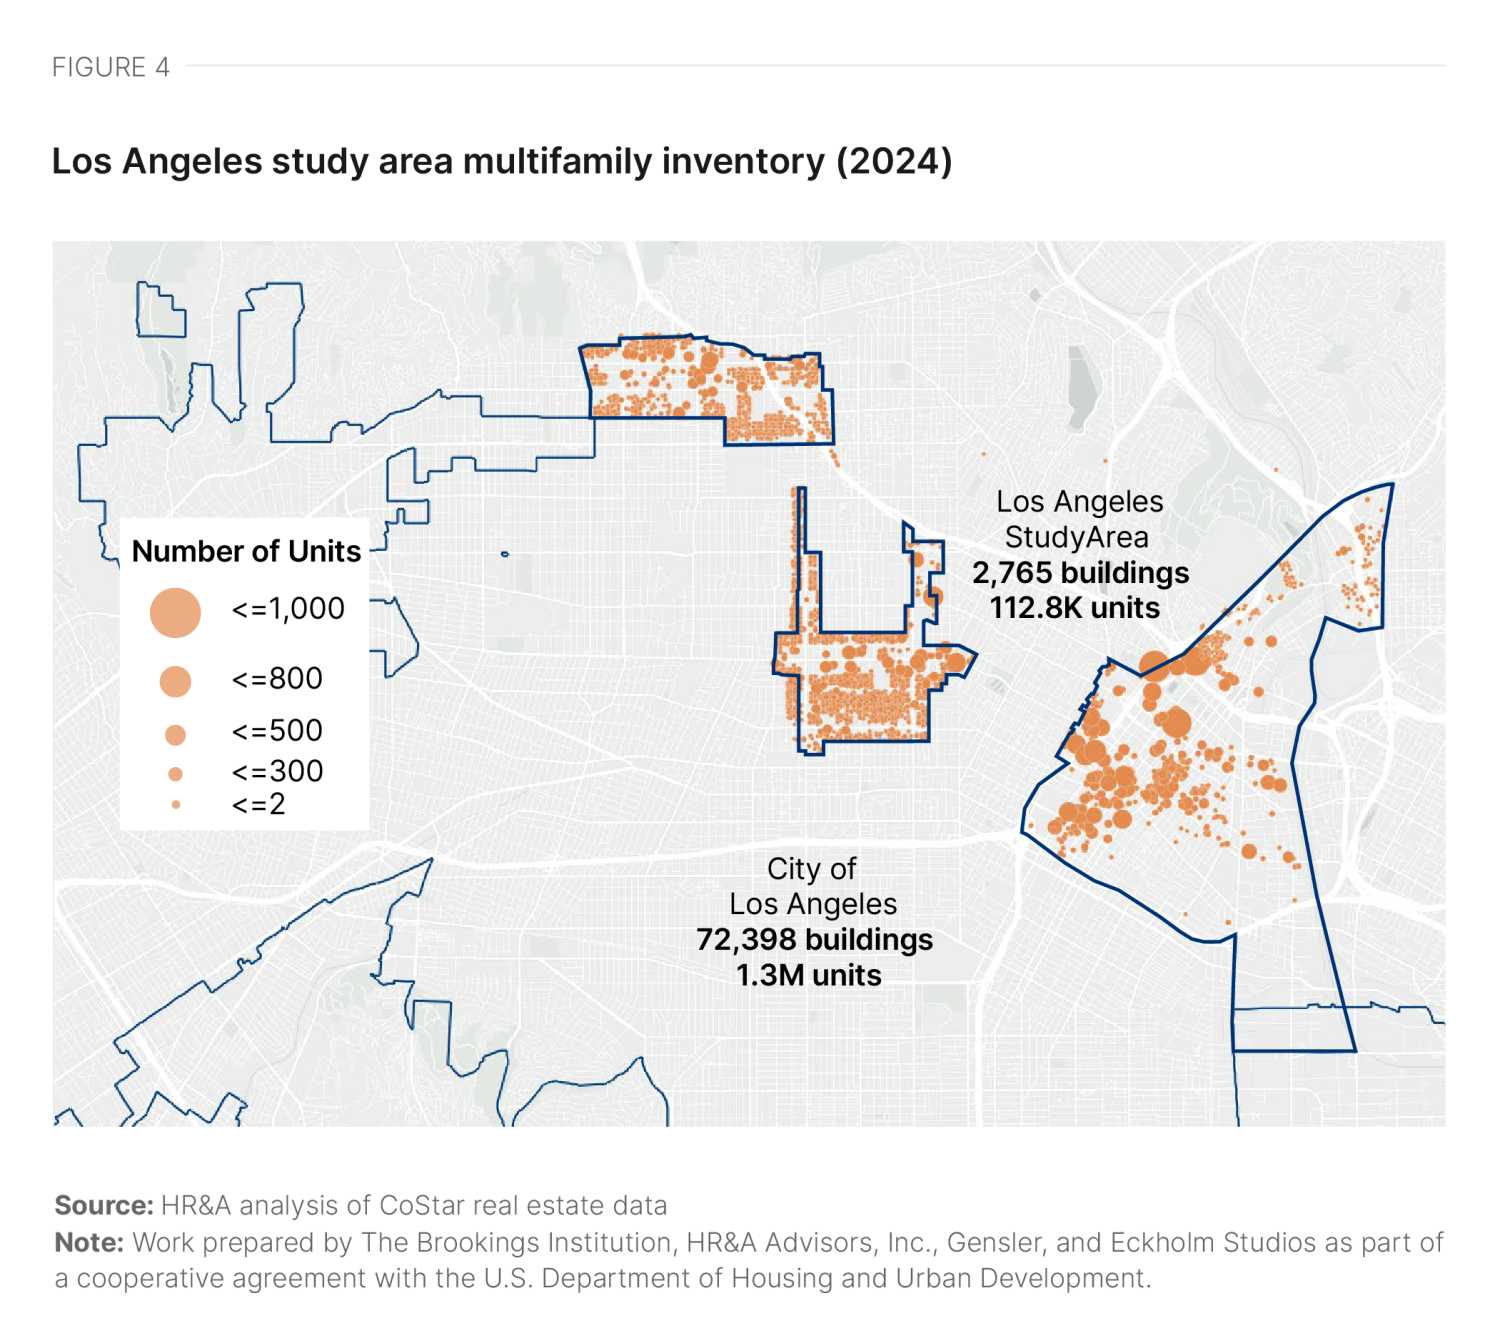
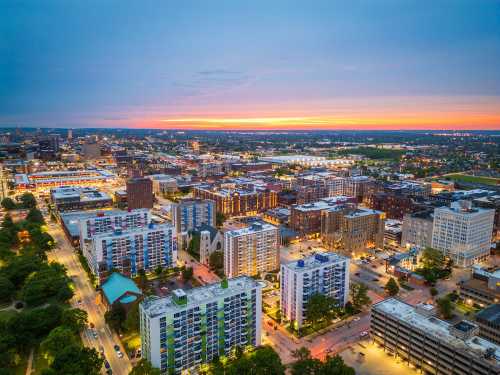
The area treated in this study includes not only Los Angeles’ downtown inner core, but also the larger area covered by the city’s 1999 Adaptive Reuse Ordinance (and successive 2003 expansion)—hereafter simply called the “study area.” The study area is where conversion activity in Los Angeles has largely occurred to date, and thus provides the most useful data. The study area’s footprint, as mapped in Figure 2, encompasses 11.6 square miles, spanning the inner core, Lincoln Heights, Chinatown, Hollywood, and Wilshire Center/Koreatown.1
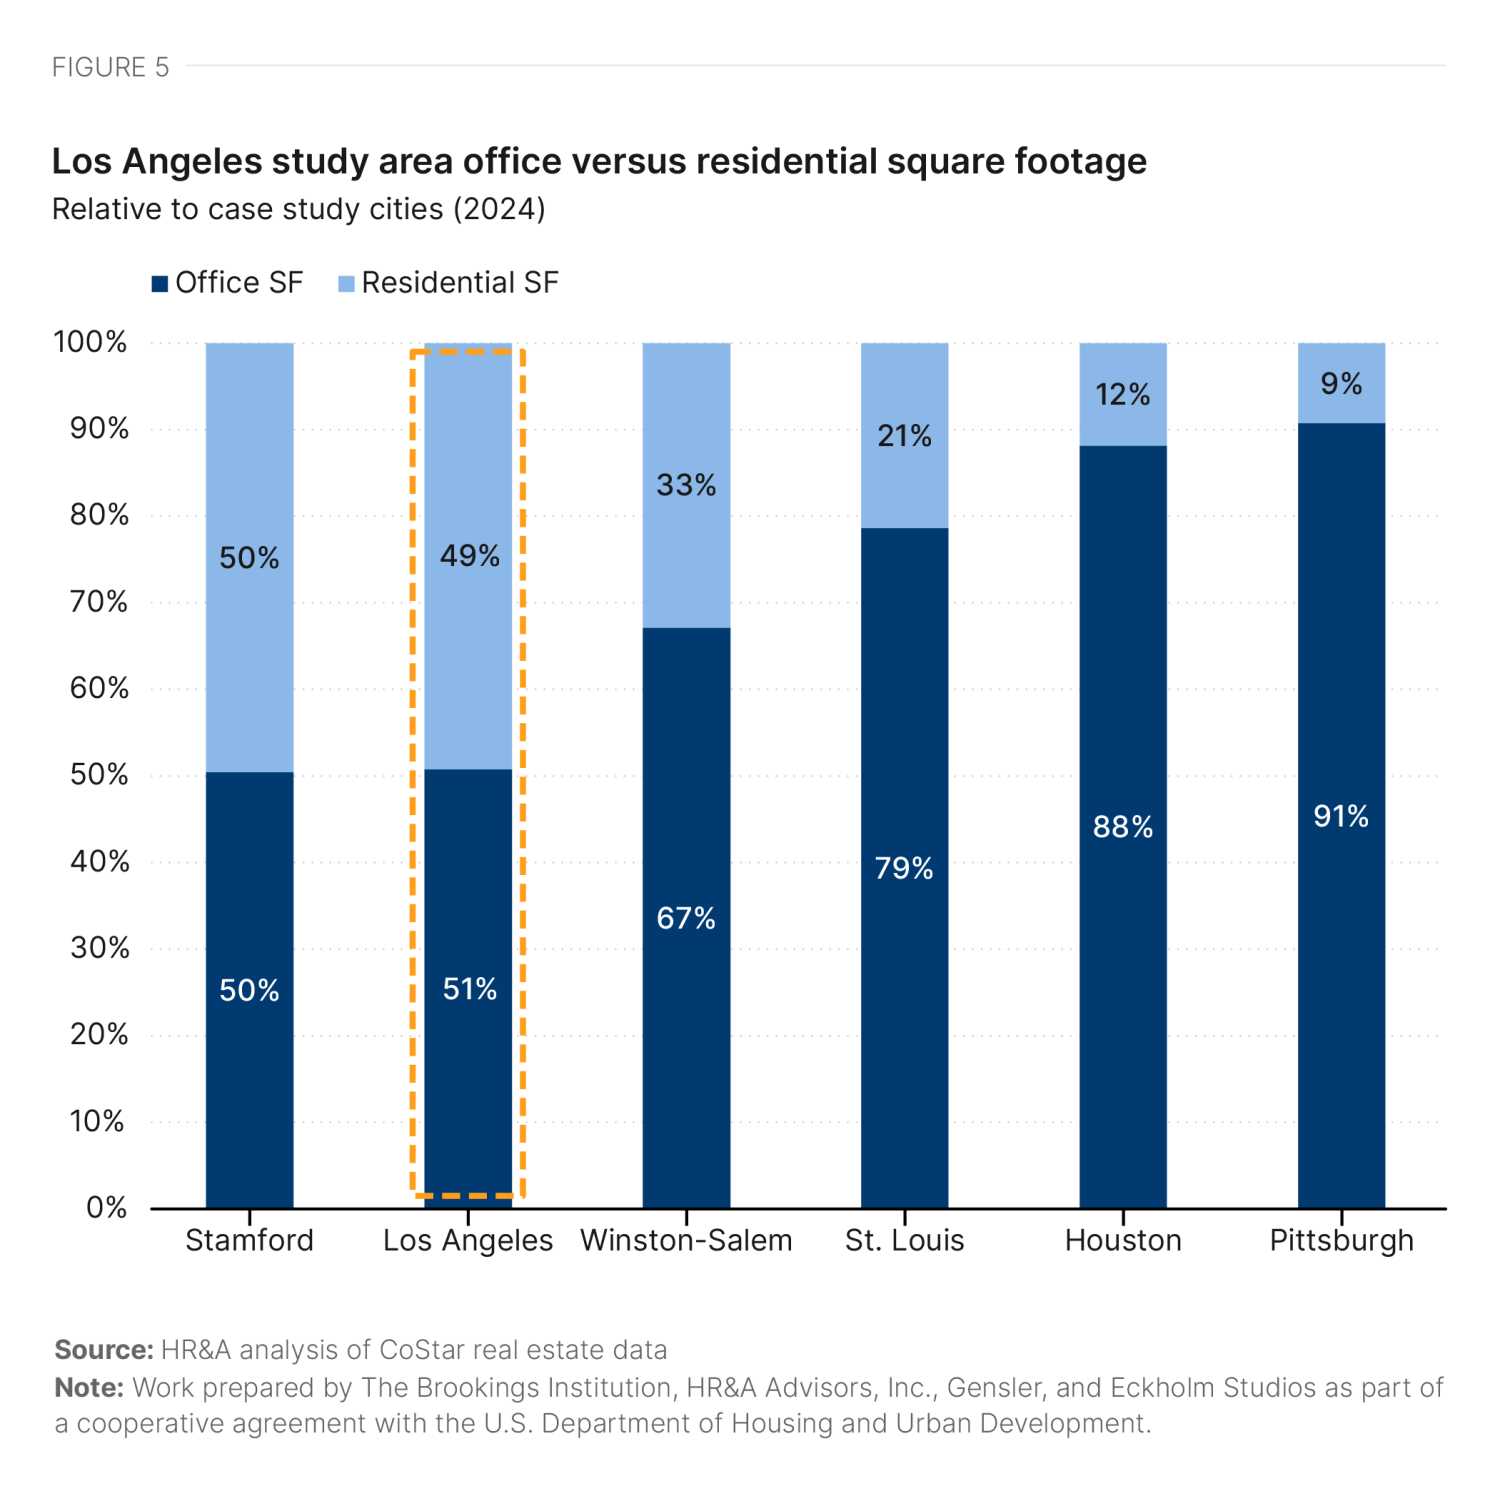
The study area contains 862 office buildings (Figure 3), comprising 20% of the region’s total office space, and 2,765 apartment buildings totaling 112,800 units, comprising 9% of the city’s apartment stock (Figure 4). This results in the study area having an even ratio of office space to apartment space (Figure 5).
While the median office building in the study area is approximately 71 years old, the area has seen more new office construction than any of the other five case study markets profiled, with 53 new office buildings (6% of all office buildings in the study area) delivered in the past 15 years. New apartment construction has been even more extensive over this same period, with 135 new buildings totaling 20,075 apartment units.2
Furthermore, the presence of a long-standing Adaptive Reuse Ordinance has enabled by-right office-to-residential conversions, resulting in an estimated 12,000 housing units created over 25 years. While more granular data on the location and the timing of these 12,000 converted units were unavailable, interviews and stakeholder outreach indicated that the bulk of the study area’s conversion activity in the past 10 years has been concentrated in Wilshire Center/Koreatown.
Office market conditions
The office market in the study area peaked in 2016 and has been declining in terms of rents and occupancy ever since, with the decline accelerating substantially following the COVID-19 pandemic. Average rent per square foot of apartment space has also declined in real terms, reflecting an abundance of luxury rental product, while the market for low- and moderate-income renters remains underserved.
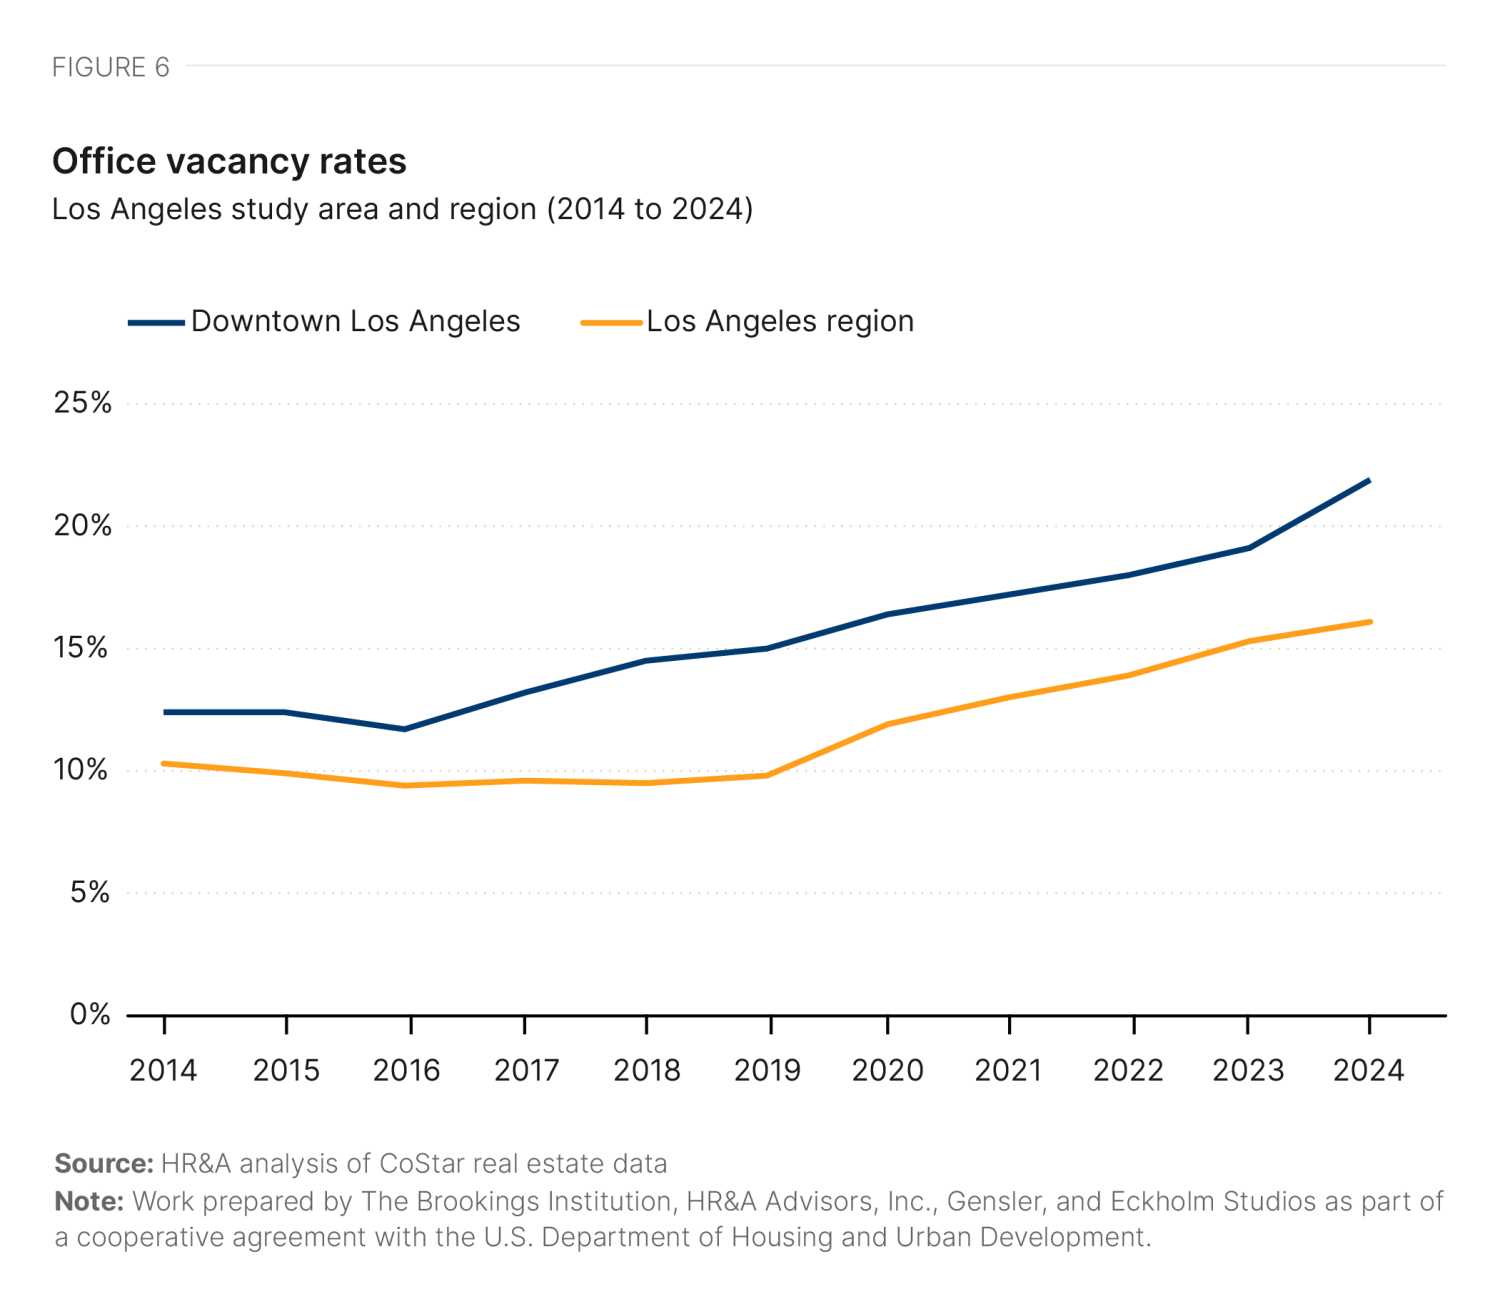
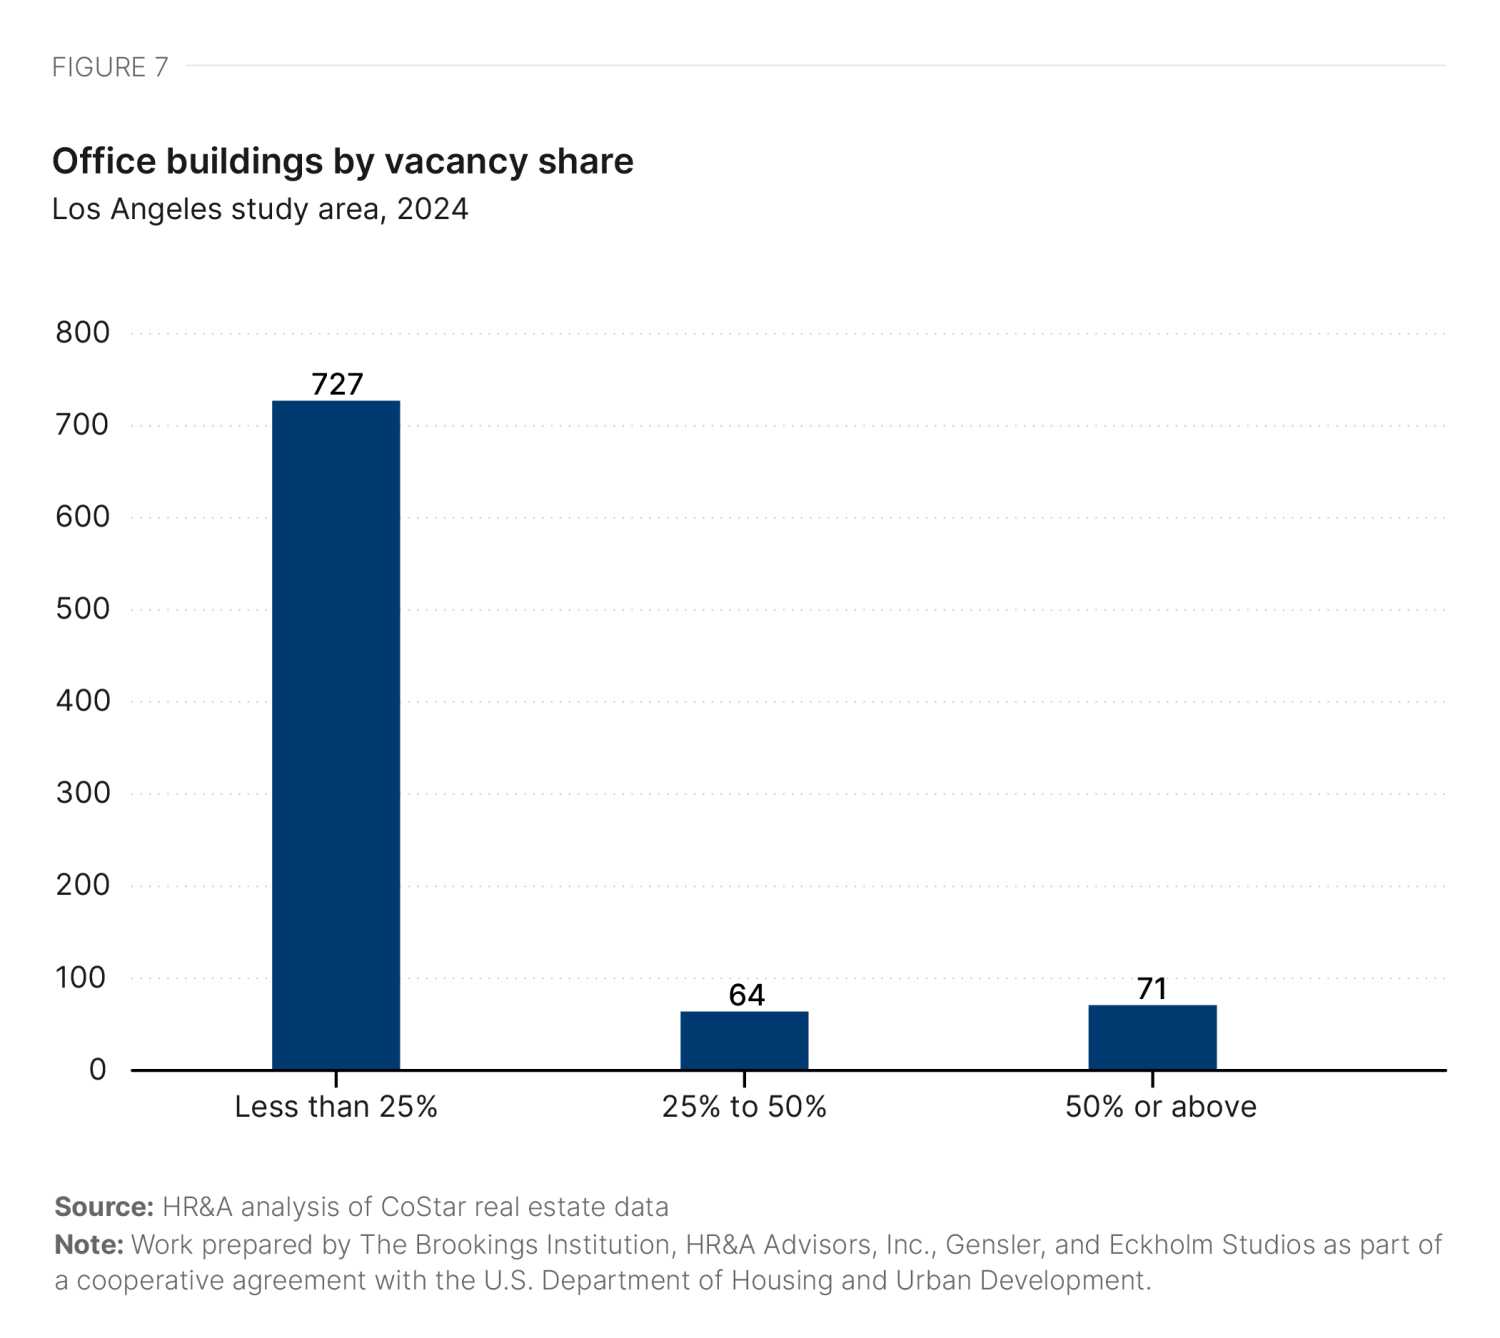
The office vacancy rate in the study area, shown in Figure 6, is 22% as of Q3 2024—an 87% increase from 2016, and higher than the 19% national average office vacancy rate in Q3 2024. Vacancy across the Los Angeles metropolitan statistical area (MSA) remained steady in the years before the pandemic, but has increased by over 60% since 2019 (Figure 6). As of 2024, however, office vacancy is significantly higher in the study area than in the broader region. In the study area, 135 buildings have vacancy rates above 25% (Figure 7). The declines in office rents and occupancy in the study area are due primarily to lease expirations alongside ongoing new deliveries. Leasing activity has fallen by 35% since the pandemic (Figure 8), a decline that is less dramatic than the downtowns of Pittsburgh and St. Louis, but more dramatic than those of Houston and Stamford.

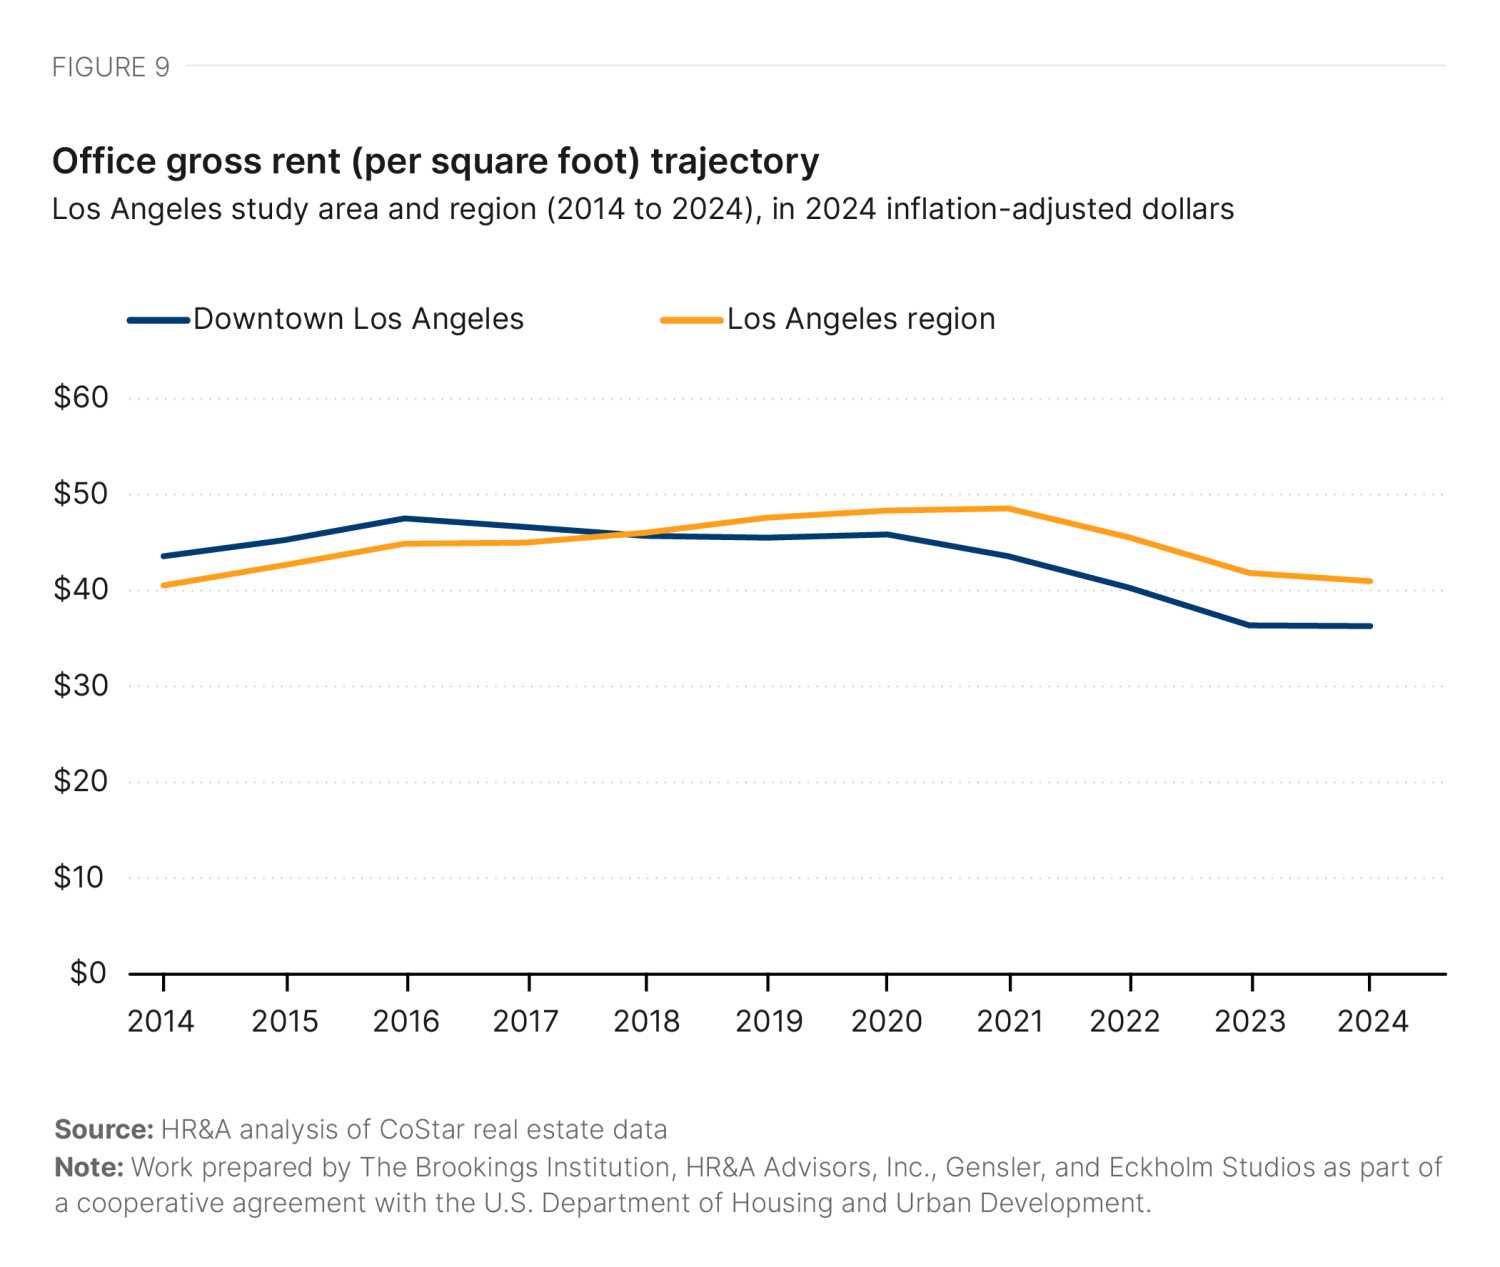
Office rents show an analogous decline in demand for study area office space relative to the rest of the region. In 2014, gross rent per square foot of office space was slightly higher in the study area than in the rest of the region. By 2024, however, the MSA-wide rent per square foot of office space had overtaken that of the study area. In inflation-adjusted terms, rents have increased by 1% MSA-wide since 2014, while declining by 17% in the study area over that same period (Figure 9). However, it is worth noting that both the study area and MSA have experienced meaningful declines in rents since the pandemic once inflation is accounted for.
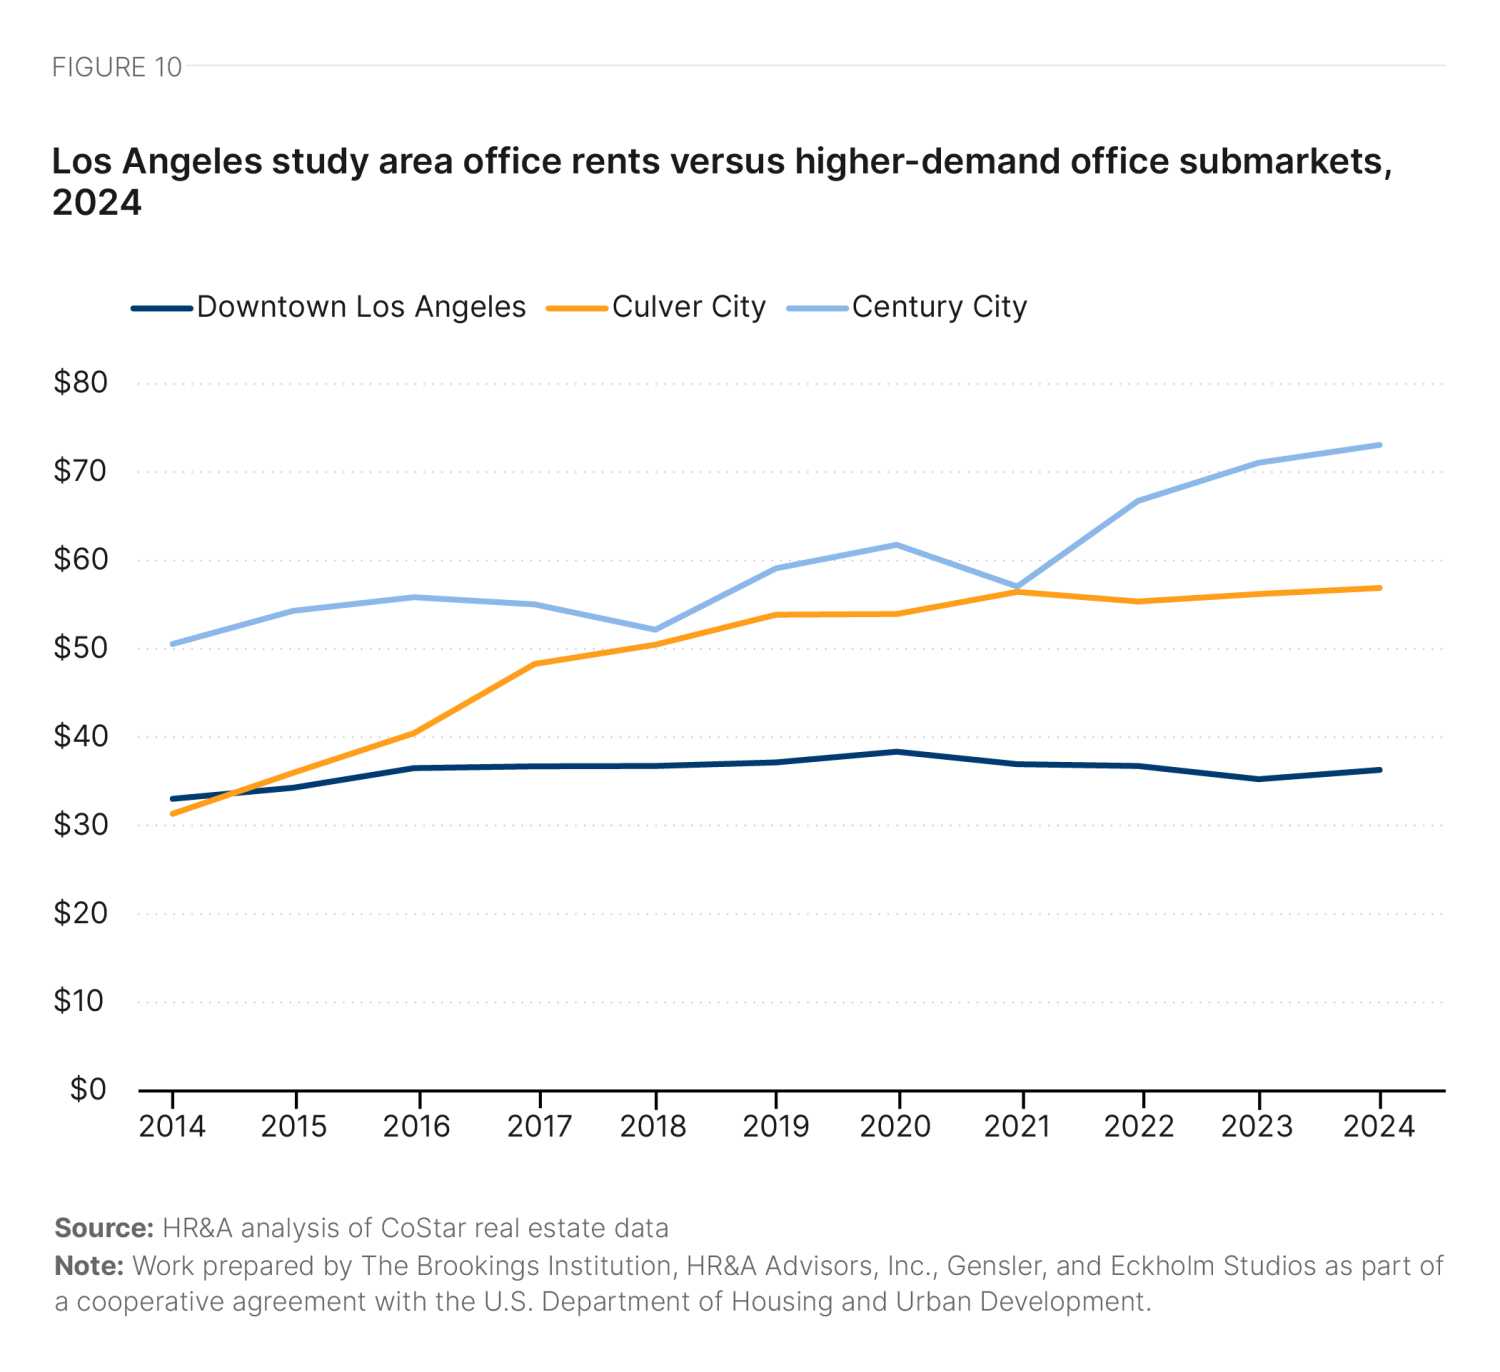
Within the region, top-of-market office tenants appear to be opting for submarkets such as Culver City and Century City. As Figure 10 details, Culver City saw dramatic increases in office rents in the years before the pandemic, while Century City has experienced dramatic increases in rents following the pandemic.3
Residential market trends
In some of the case study markets profiled, downtowns constitute a small share of their respective cities’ apartment stock. This is not true for Los Angeles, where the study area (encompassing both downtown and much of the broader commercial core) already has an established and growing residential market complementing the office space, amounting to a full 9% of apartment units citywide. Roughly 76,000 households are located within the study area, and 93% of them are renters. This is a high proportion even for a majority-renter city such as Los Angeles, in which 63% of households rent their homes.4
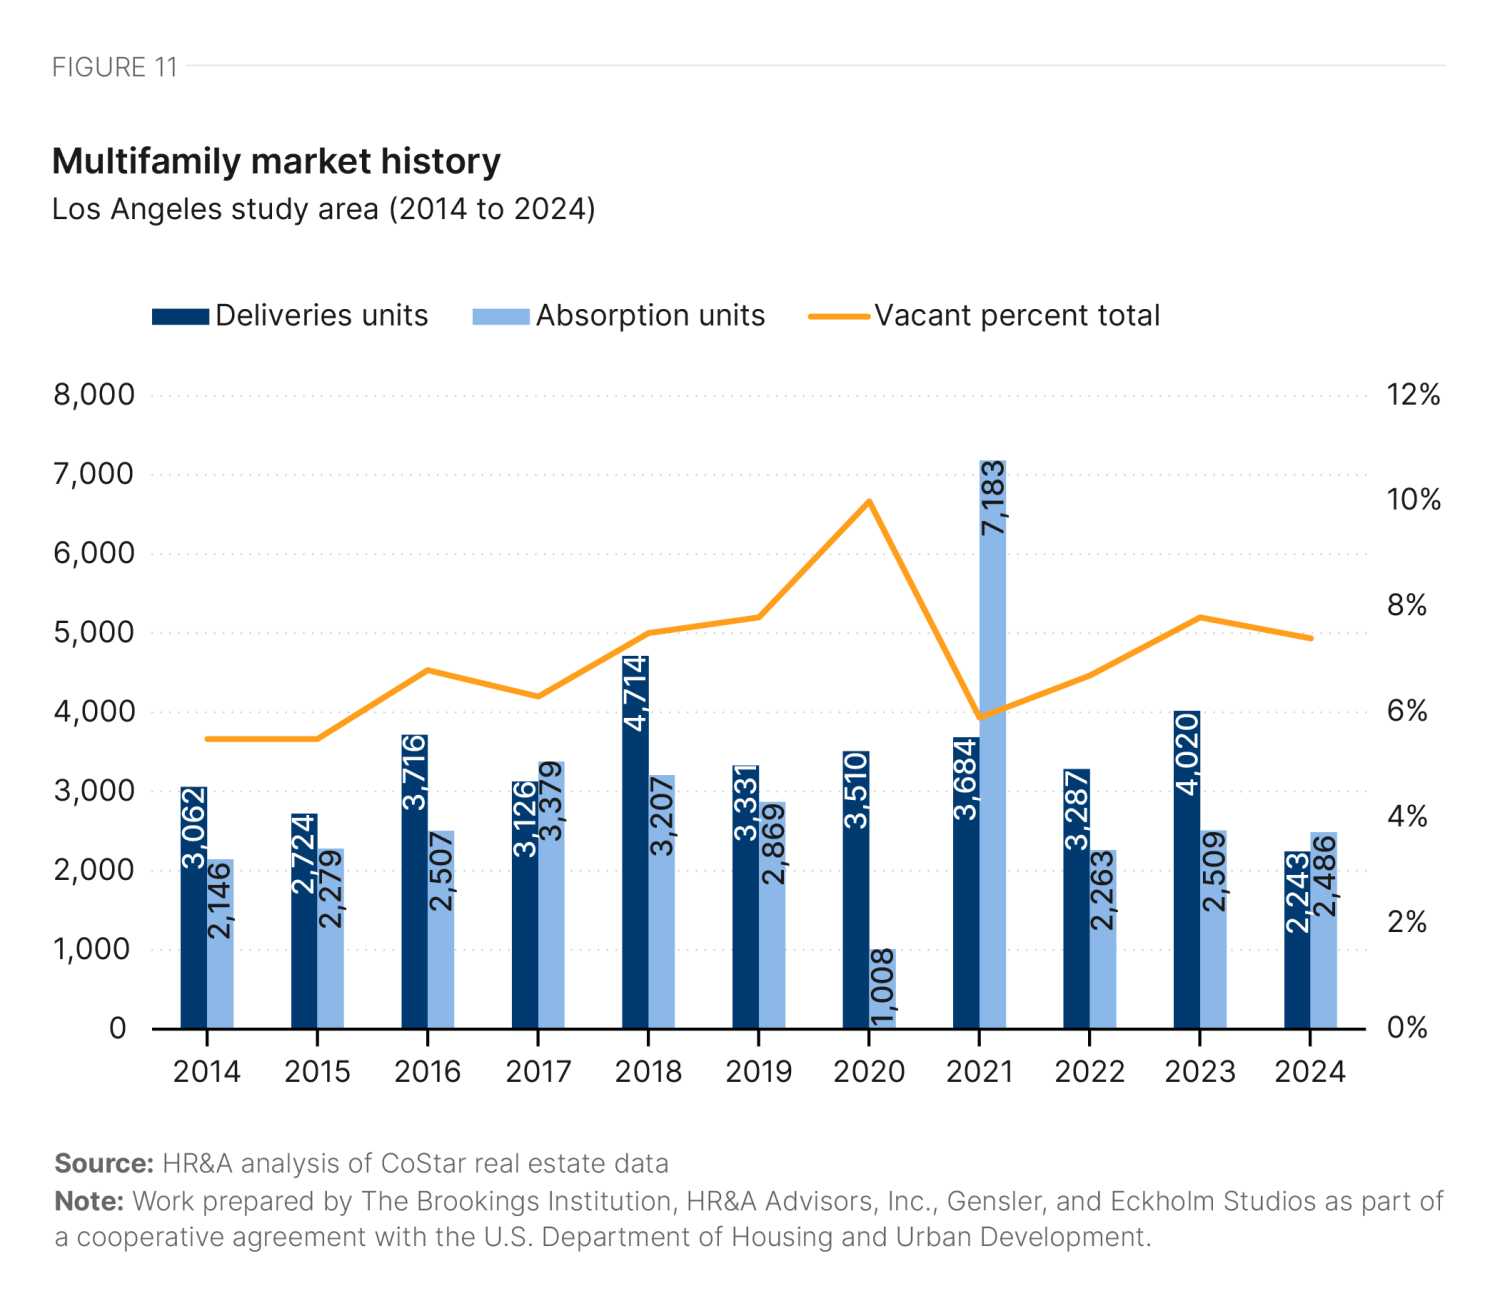
Excluding the pandemic disruptions of 2020-21, the study area saw deliveries of 2,500 to 4,700 units per year, with strong absorption between 2018 and 2023 (Figure 11). From 2014 to 2024, this amounts to an increase of 3.8% per year in apartment inventory in the study area. However, the rest of Los Angeles has added new supply much more slowly, at just 0.8% per year.5 After a spike to 10% in 2020, study area vacancy rates have fallen to their pre-pandemic levels (Figure 11).
When looking at apartment rents in Los Angeles in nominal terms, rents increased annually at substantial rates until 2023, when they appear to have plateaued in both the study area and entire city (Table 1).
|
Study area |
Citywide |
|
|---|---|---|
|
Annual rent growth, nominal, 2014 to 2022 |
2.2% | 3.3% |
| Cumulative rent growth, nominal, 2014 to 2022 | 20.7% | 33% |
| Nominal rent growth since 2022 | -1.4% | 1.6% |
Source: HR&A analysis of CoStar real estate data
Note: Work prepared by The Brookings Institution, HR&A Advisors, Inc., Gensler, and Eckholm Studios as part of a cooperative agreement with the U.S. Department of Housing and Urban Development.
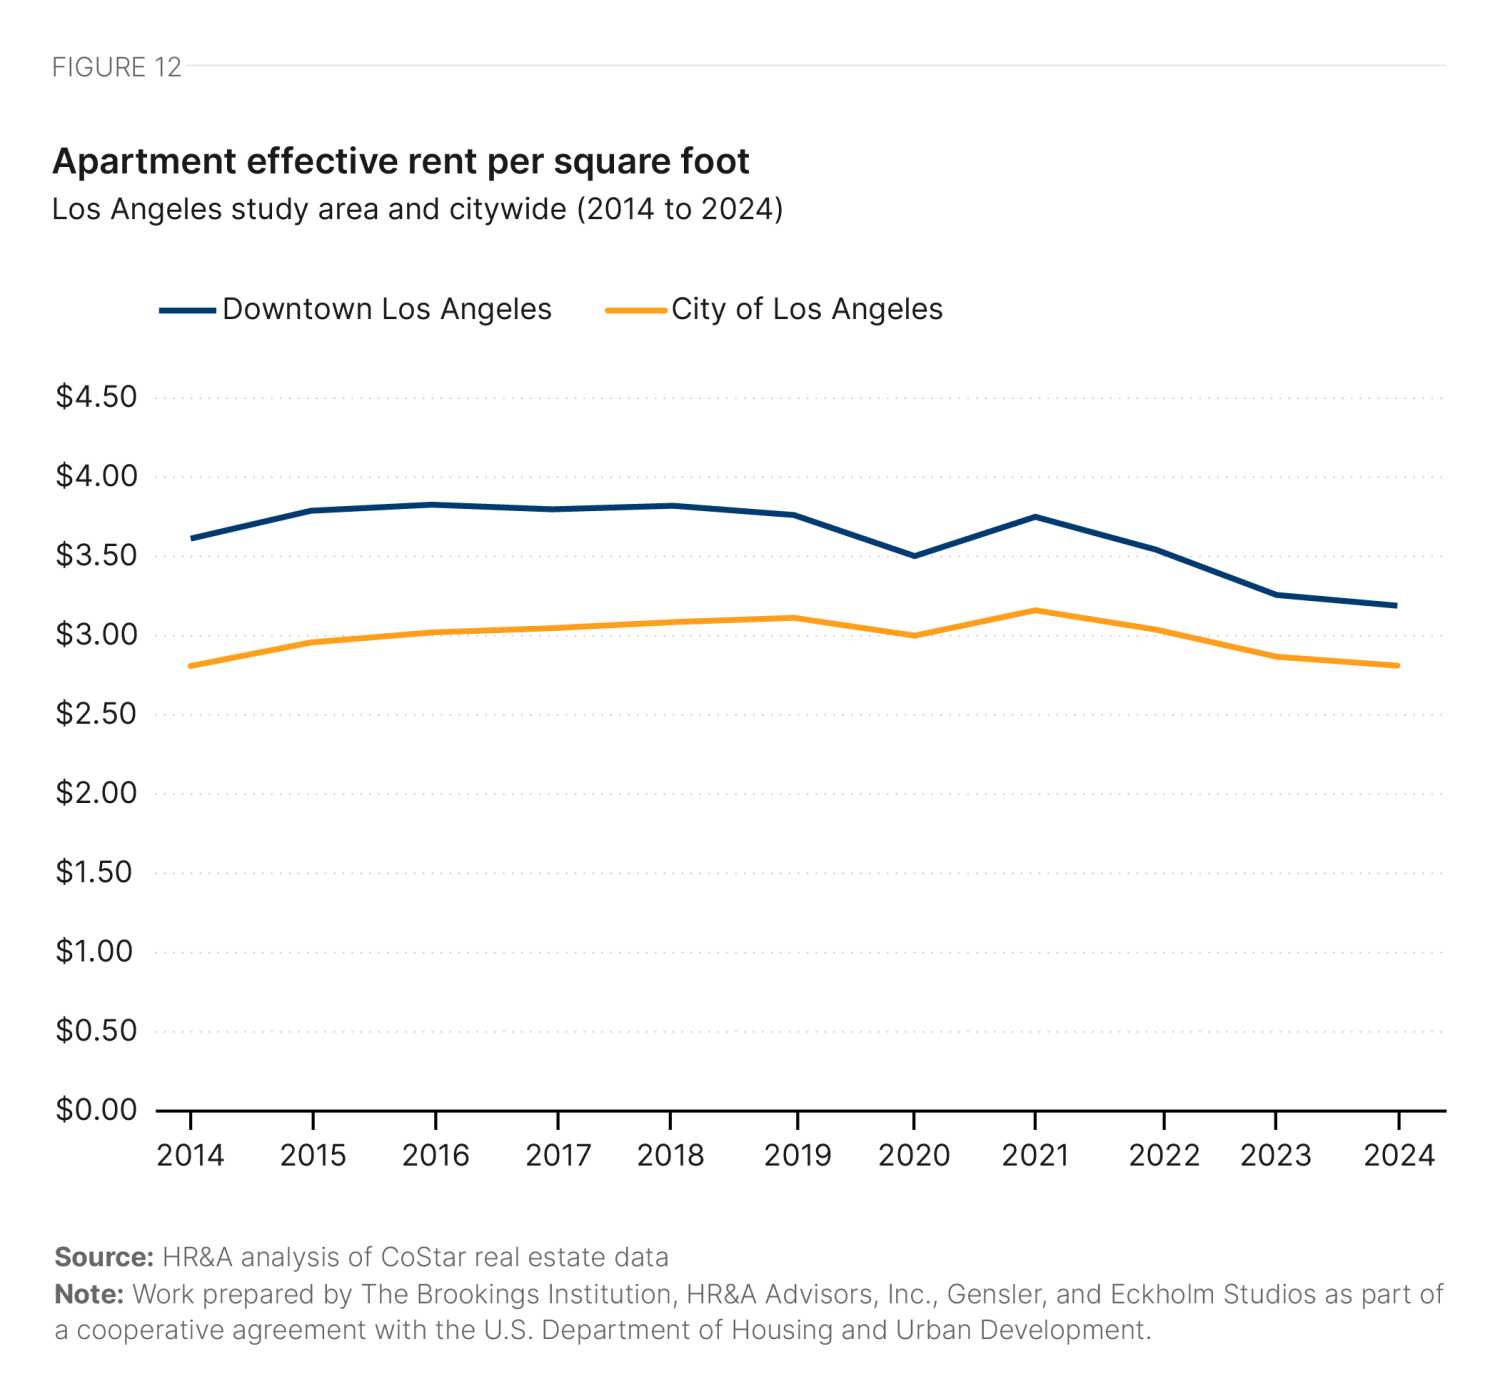
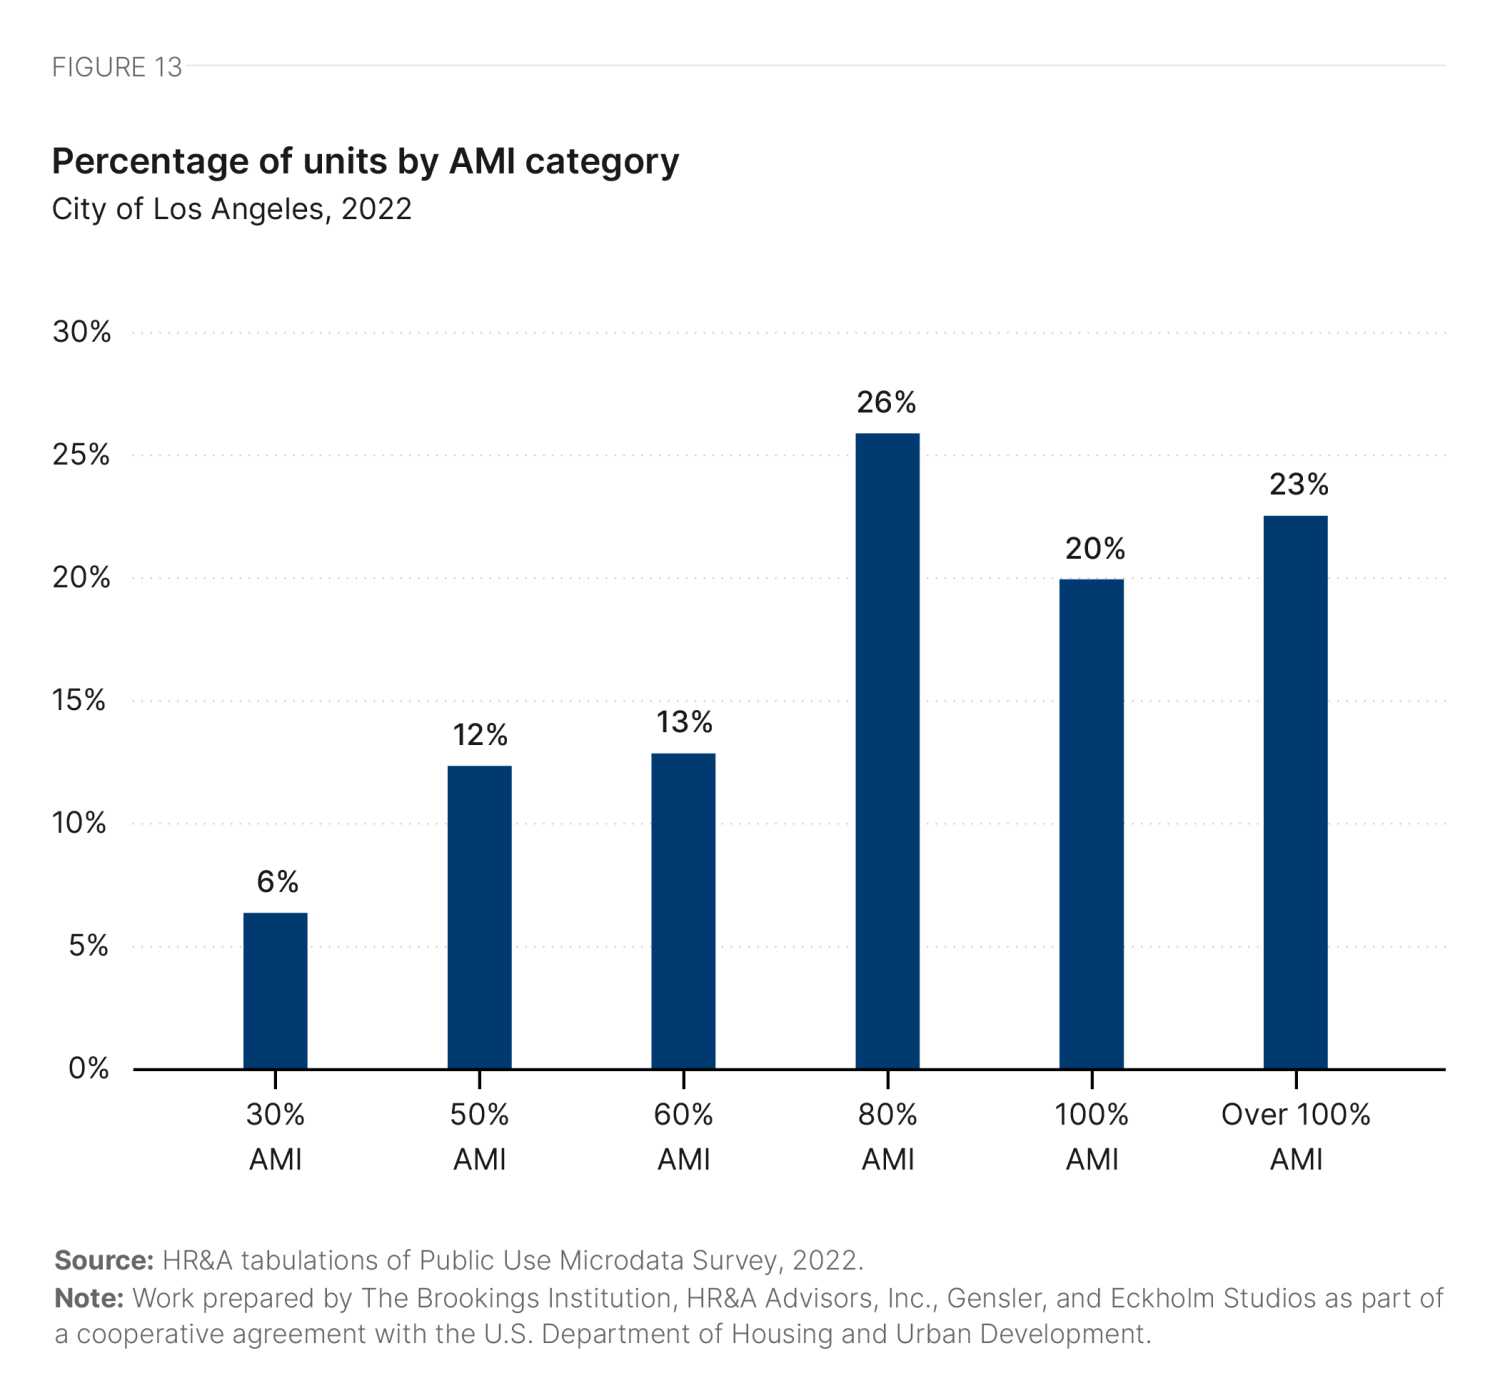
In inflation-adjusted terms, rents have actually declined by 15% in the study area and by 10% citywide since the onset of the pandemic (Figure 12). (This downward trajectory is still less severe than the trajectory of office space, where post-pandemic declines totaled 20% in the study area and 14% citywide.) In spite of declines in rents, citywide rental affordability statistics show a difficult market for low- and moderate-income renters. Just 18% of rental housing units are affordable to renters at 50% of area median income (AMI)—tied with Houston for the lowest share of affordable units in our six case study cities (Figure 13, Table 2).6 As of 2024, the average apartment space rents 5% higher than the average office space in the study area.7

Los Angeles has the most diverse population of any of the cities studied, with a citywide population that is 41% white, 9% Black, and 50% other ethnicities. The study area is even more diverse, with only 29% of the population identifying as white alone. Notably, while the city is 48% Latino or Hispanic relative to a 40% statewide average, the study area is only 30% Latino or Hispanic while containing a higher proportion of nonwhite residents than the city (Table 3). This may partially be attributed to the presence of enclaves such as Chinatown within the study area. Sixteen percent of Los Angeles residents live in poverty, relative to 12% statewide (Table 3). This disparity is more extreme in the study area, where 26% of the population lives below the poverty line and 49.4% are housing cost burdened (compared to 47.9% citywide). Households in the study area have an estimated median income of $50,666, compared to $76,244 citywide.8
|
Study area |
Citywide |
Statewide |
|
|---|---|---|---|
|
Total Population |
|||
| White Alone Population Share | 28.9% | 41.2% | 48.1% |
| Black Alone Population Share | 17.0% | 8.6% | 5.6% |
| Other Share (anything other than White or Black alone) | 54.1% | 50.3% | 46.3% |
| Hispanic Population Share | 29.5% | 48.1% | 39.7% |
|
Population in Housing Units |
|||
| Poverty rate | 26.1% | 16.1% | 11.7% |
Source: Brookings analysis of ACS 2022 5-year estimates
Note: Poverty rate used here is defined as the share of people in housing units. Work prepared by The Brookings Institution, HR&A Advisors, Inc., Gensler, and Eckholm Studios as part of a cooperative agreement with the U.S. Department of Housing and Urban Development.
Political, policy, and financial conditions
Los Angeles has a mayor-council-commission form of government, in which an elected mayor appoints members of boards and commissions, and a 15-member elected City Council (representing each of the city’s 15 districts) makes up the legislative decisionmaking body. Within the Los Angeles City Planning department, staff are responsible for administering the zoning code, managing historic resources, ensuring future development aligns with land use, and promoting vibrant public spaces and streets through the Urban Design Studio. The planning director (appointed by the mayor) manages the city’s General Plan, which sets policy priorities and lays the foundation for land use decisions, the zoning code, and the city’s 35 Community Plans.
Nine volunteer-led commissions take on decisionmaking and advisory roles. Established by the City Charter, the City Planning Commission reviews land use ordinances, General Plan amendments, and development projects, as well as makes recommendations to the mayor, planning director, and City Council. Local landmark designation and oversight is administered by the Cultural Heritage Commission, and seven Area Planning Commissions consider cases for seven regions of the city.
Lastly, the Central City Association of Los Angeles (CCA) plays a lead role in influencing policy and legislation. Unlike other state legislatures, California bills can be sponsored by organizations. Recently, CCA has sponsored numerous bills on adaptive reuse.
The Los Angeles City Planning department is well versed in adaptive reuse, having established an Adaptive Reuse Ordinance (ARO) in 1999 to facilitate conversions downtown and in adjacent historic neighborhoods. In the following two decades, the city added 12,000 new housing units through adaptive reuse in the neighborhoods covered by the original ARO. To expand the impact of the program, Los Angeles passed a revised ARO in 2024, and the city is now attempting to evolve its building codes to remove remaining procedural barriers to office-to-residential conversion. The city hopes that office-to-residential conversion can be one of many tools used to address the regional housing crisis.
According to the 2021-2029 Housing Element, while Los Angeles has already met its overall regional Housing Needs Assessment of 82,002 units for 2013 to 2021, it is not on track to produce enough housing in the affordable lower- and moderate-income categories.
Everybody likes adaptive reuse. Even NIMBYs are fine with adaptive reuse because it's kind of status quo, more or less, right?
A Los Angeles stakeholder
The CCA and City Planning department have been the main proponents of office-to-residential conversion to meet this demand. Top motivations cited include:
- Addressing the regional housing crisis9
- The potential for embodied carbon savings associated with adaptive reuse relative to new construction
Coming out of the pandemic, Los Angeles moved quickly to pass an expanded citywide ARO, described in the following section. However, the state has not moved with the same agility—and their cooperation is required to update the state building code and make office-to-residential conversion more broadly accessible across California cities, including in Los Angeles.10
Under California’s current building code, adaptive reuse is only circuitously permitted under Chapter 85’s alternative standards for joint live-work quarters. California State Assembly Bill 529 charged the Department of Housing and Community Development with establishing a working group in 2024 to identify adaptive reuse challenges and opportunities, and recommend building code amendments to the state legislature by the end of 2025. Given the California Building Standards Commission reviews and codifies the state building code on a three-year cycle, any amendments would not take effect until 2028.
Downtown is dying. We need these codes now.
A Los Angeles stakeholder
California State Assembly members from Los Angeles and San Francisco introduced two bills to create a faster resolution: AB 2910 would have created a process through which California cities could adopt alternative building code standards for adaptive reuse, and AB 306 would have allowed adaptive reuse by-right. Both were vetoed by the governor in 2024 after passing the state legislature, citing concerns that the bills were duplicative of State Assembly Bill 529.
Despite challenges with the state building code, Los Angeles has made substantial progress on updating its zoning to allow for office-to-residential conversion.
In 2024, Los Angeles City Planning passed the 2024 Citywide Adaptive Reuse Ordinance, as part of a larger Citywide Housing Incentive Program. The Citywide ARO aims to further encourage adaptive reuse projects in neighborhoods outside of the area covered by the previous, geographically limited ordinance. For example, under the Citywide ARO’s terms, buildings 15 years or older are now able to convert by-right, meaning that they are exempt from the site review process. Moreover, developers may only need to convert a floor (rather than an entire building) and create five housing units to participate. Greater flexibility with regard to rooftops and nonconforming features will also likely allow for more economical and creative conversions.
In addition to the ARO, in December 2023, the City Council passed the Responsible Hotel Ordinance, which subjects new hotels to discretionary review via a requirement to obtain a conditional use permit. While not directly covering the subject of office-to-residential conversion, a similar requirement in New York has mostly suppressed new hotel construction, and may tilt conversions in favor of residential units.
Affordability is a key goal of Los Angeles City Planning. As such, projects can participate in both the citywide adaptive reuse program and a local affordable housing incentive program (but no other incentive programs). Moreover, under the affordable housing linkage fee (which applies to both new builds and conversions), developers have the option of either paying a linkage fee if developing no affordable units, or forgoing the fee in exchange for setting aside deed-restricted housing units.
While conversion strategies in Los Angeles have predominantly focused on removing zoning and regulatory barriers rather than direct financial incentives, there are two significant local tax abatement/credit programs intended for historic preservation, which also apply to many office-to-residential conversions.
To complement California’s State Historic Rehabilitation Tax Credit, the city participates in the Mills Act Program—which offers property tax savings for owners who invest in the rehabilitation and restoration of historic buildings—through a 10-year contract that is negotiated between the property owner and the authority with jurisdiction (in this case, the Los Angeles tax assessor’s office). In 2024, Assembly Bill 2909 was introduced in the State Assembly, which would expand the eligibility of historic structures that can participate in the Mills Act Program. The bill is still proceeding through the legislative process.
|
Type |
Name |
Details |
|---|---|---|
|
Tax abatement |
||
| Los Angeles Office of Historic Resources and tax assessor’s office |
Revolving 10-year contracts between the city and property owner for the rehabilitation of historic structures. Projects can only back date to a year before application for the program. Under California Proposition 13, properties are assessed at 1% sales tax at the date of sale and then property tax is capped at 2% increases annually. Ultimately, local jurisdictions are responsible for administering and determining the specific criteria for participation. As of October 2024, new applications for the program are temporarily on hold as the city reassesses its Mills Act Program. |
|
|
Tax credit |
||
|
California Tax Credit Allocation Committee and Office of Historic Preservation |
Allows for a 20% to 25% tax credit for the rehabilitation costs of a historic structure. |
Note: Work prepared by The Brookings Institution, HR&A Advisors, Inc., Gensler, and Eckholm Studios as part of a cooperative agreement with the U.S. Department of Housing and Urban Development.
Past and future conversion activity
In this policy, economic, and political environment, at least 12 office-to-residential conversion projects have been completed since March 15, 2020, and at least five are in the planning/construction process (Figure 14).11

701 South Hudson Avenue
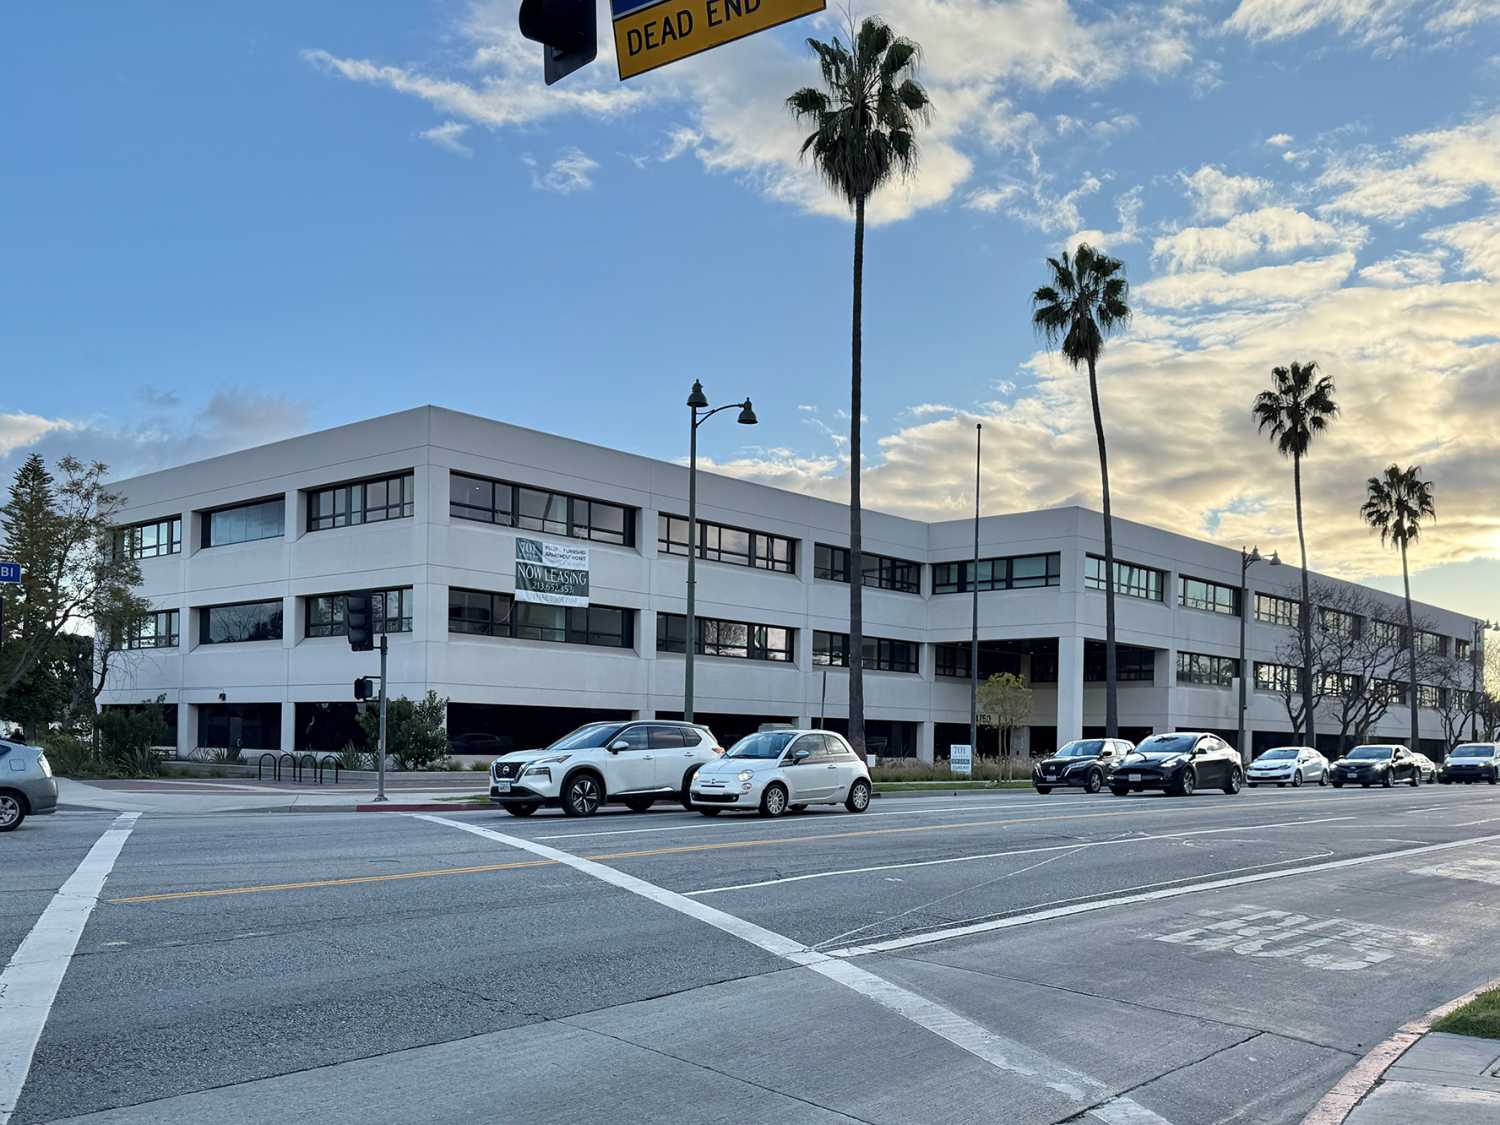
Originally built as a three-story office building for Farmers Insurance in 1987, CIM Group purchased the building at 4750 Wilshire Boulevard in 2023, and converted the top two stories into 68 market rate apartment units with an address of 701 S. Hudson Ave. (Table 5). However, it is worth noting that this project, while located on Wilshire Boulevard in Koreatown (where most recent conversion activity has occurred) is outside the city’s approved adaptive reuse zone, and as such, was not a by-right project. The project had a conventional capital stack (Table 6).
|
Name |
701 S Hudsons |
| Address | 4750 Wilshire Boulevard |
| Owner | CIM Group, LP |
| Gross SF | 143,000 |
| Rentable SF | 113,000 |
| Building History | Former Office; ground floor remains office space |
| Year Built | 1987 |
| Year Converted | 2024 |
| Number of Converted Floors | 2 |
| Average Floor Plate Size | N/A |
| Number of Units | 68 |
| Unit Mix by Type | 12 x Studio, 22 x 1 BR, 34 x 2BR |
| Avg. rent | $4,836 |
| Avg. rent per SF | $4.40 |
| Affordability | Market Rate |
| Acquisition Price | $34,400,000 |
Source: Authors’ analysis of CoStar real estate market data and interviews with local stakeholders
Note: Work prepared by The Brookings Institution, HR&A Advisors, Inc., Gensler, and Eckholm Studios as part of a cooperative agreement with the U.S. Department of Housing and Urban Development.
|
Financing type |
|---|
|
Traditional Financing |
| Developer Equity |
| Senior Construction Loan |
Source: Authors’ interviews with local stakeholders
Note: Work prepared by The Brookings Institution, HR&A Advisors, Inc., Gensler, and Eckholm Studios as part of a cooperative agreement with the U.S. Department of Housing and Urban Development.
354 South Spring Street
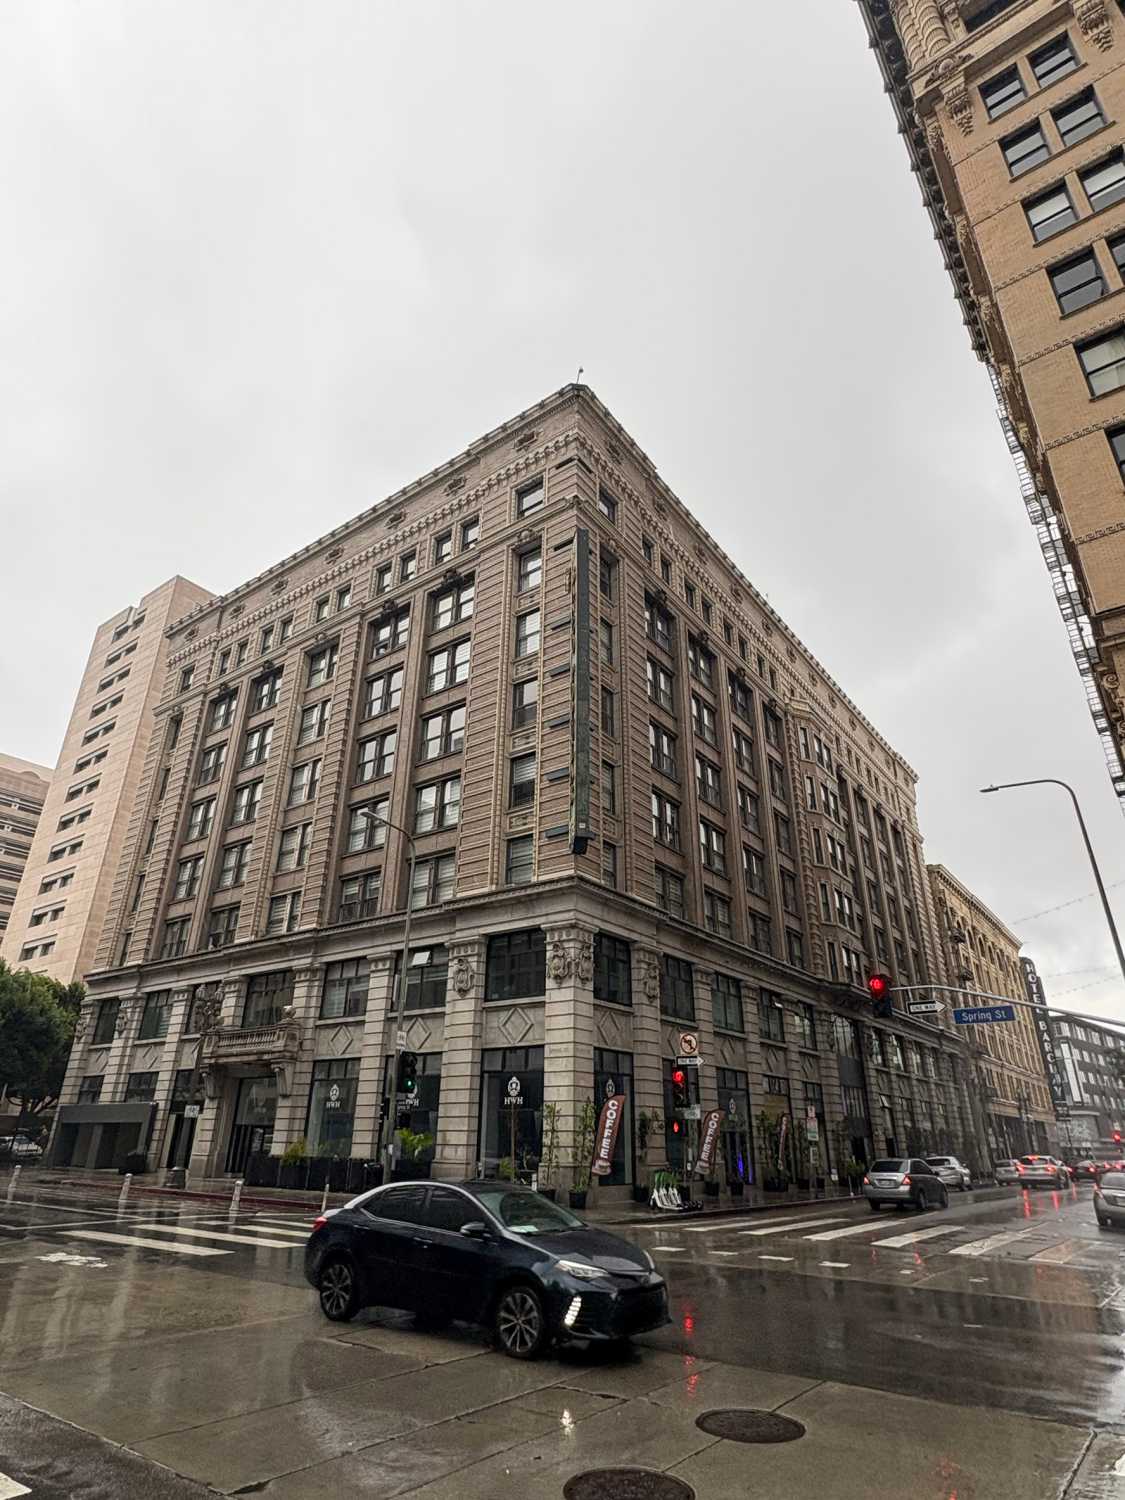
Originally built in 1903 as a bank, the 10-story Herman W. Hellman Building was converted into HWH Luxury Living in 2020, with two additional stories added for total of 188 apartment units (Table 7). The two added stories were designed specifically as multi-floor penthouse units, with the rooftop being used as high-end amenities for tenants.
|
Name |
HWH Luxury Living |
| Address | 354 Spring Street |
| Owner | HW Hellman LP |
| Gross SF | 215,695 |
| Rentable SF | 215,695 |
| Building History | Former bank; bar and restaurant space remains |
| Year Built | 1903 |
| Year Converted | 2020 |
| Number of Converted Floors | 122 |
| Average Floor Plate Size | 21,695 |
| Number of Units | 188 |
| Unit Mix by Type | 46 x Studio, 61 x 1 BR, 65 x 2BR, 16 x 3BR |
| Avg. rent | $3,870 |
| Avg. rent per SF | $4.05 |
| Affordability | Market Rate |
| Acquisition Price | N/A |
Source: Authors’ analysis of CoStar real estate market data and interviews with local stakeholders
Note: Work prepared by The Brookings Institution, HR&A Advisors, Inc., Gensler, and Eckholm Studios as part of a cooperative agreement with the U.S. Department of Housing and Urban Development.
Future conversion potential
We assessed the architectural conversion viability of 25 high-vacancy buildings in Los Angeles. To select these buildings, we used CoStar data to identify buildings with vacancy rates in excess of 20%. The CoStar data were then triangulated with input from qualitative interviews about potential conversion candidates and additional factors such as year built, building area, number of stories, and office class in order to identify the buildings best suited to make up a representative set of properties for architectural conversion viability analysis. Finally, three buildings were selected for detailed architectural studies based on results from the initial analysis and input from interview participants.
We assigned buildings a percentage score to denote their architectural compatibility for conversion, and grouped them into the following categories:
- Properties that score above 80% can likely convert without design compromises
- Properties that score between 70% and 80% can likely convert with some design compromises
- Properties that score under 70% can likely convert only with major design compromises
From the analysis, we then projected out the number of units that would be created by converting all the scored buildings. We also projected the greenhouse gas savings associated with unit creation via conversion rather than new build activity. A full explanation of our calculation methodology is included in Appendix A.
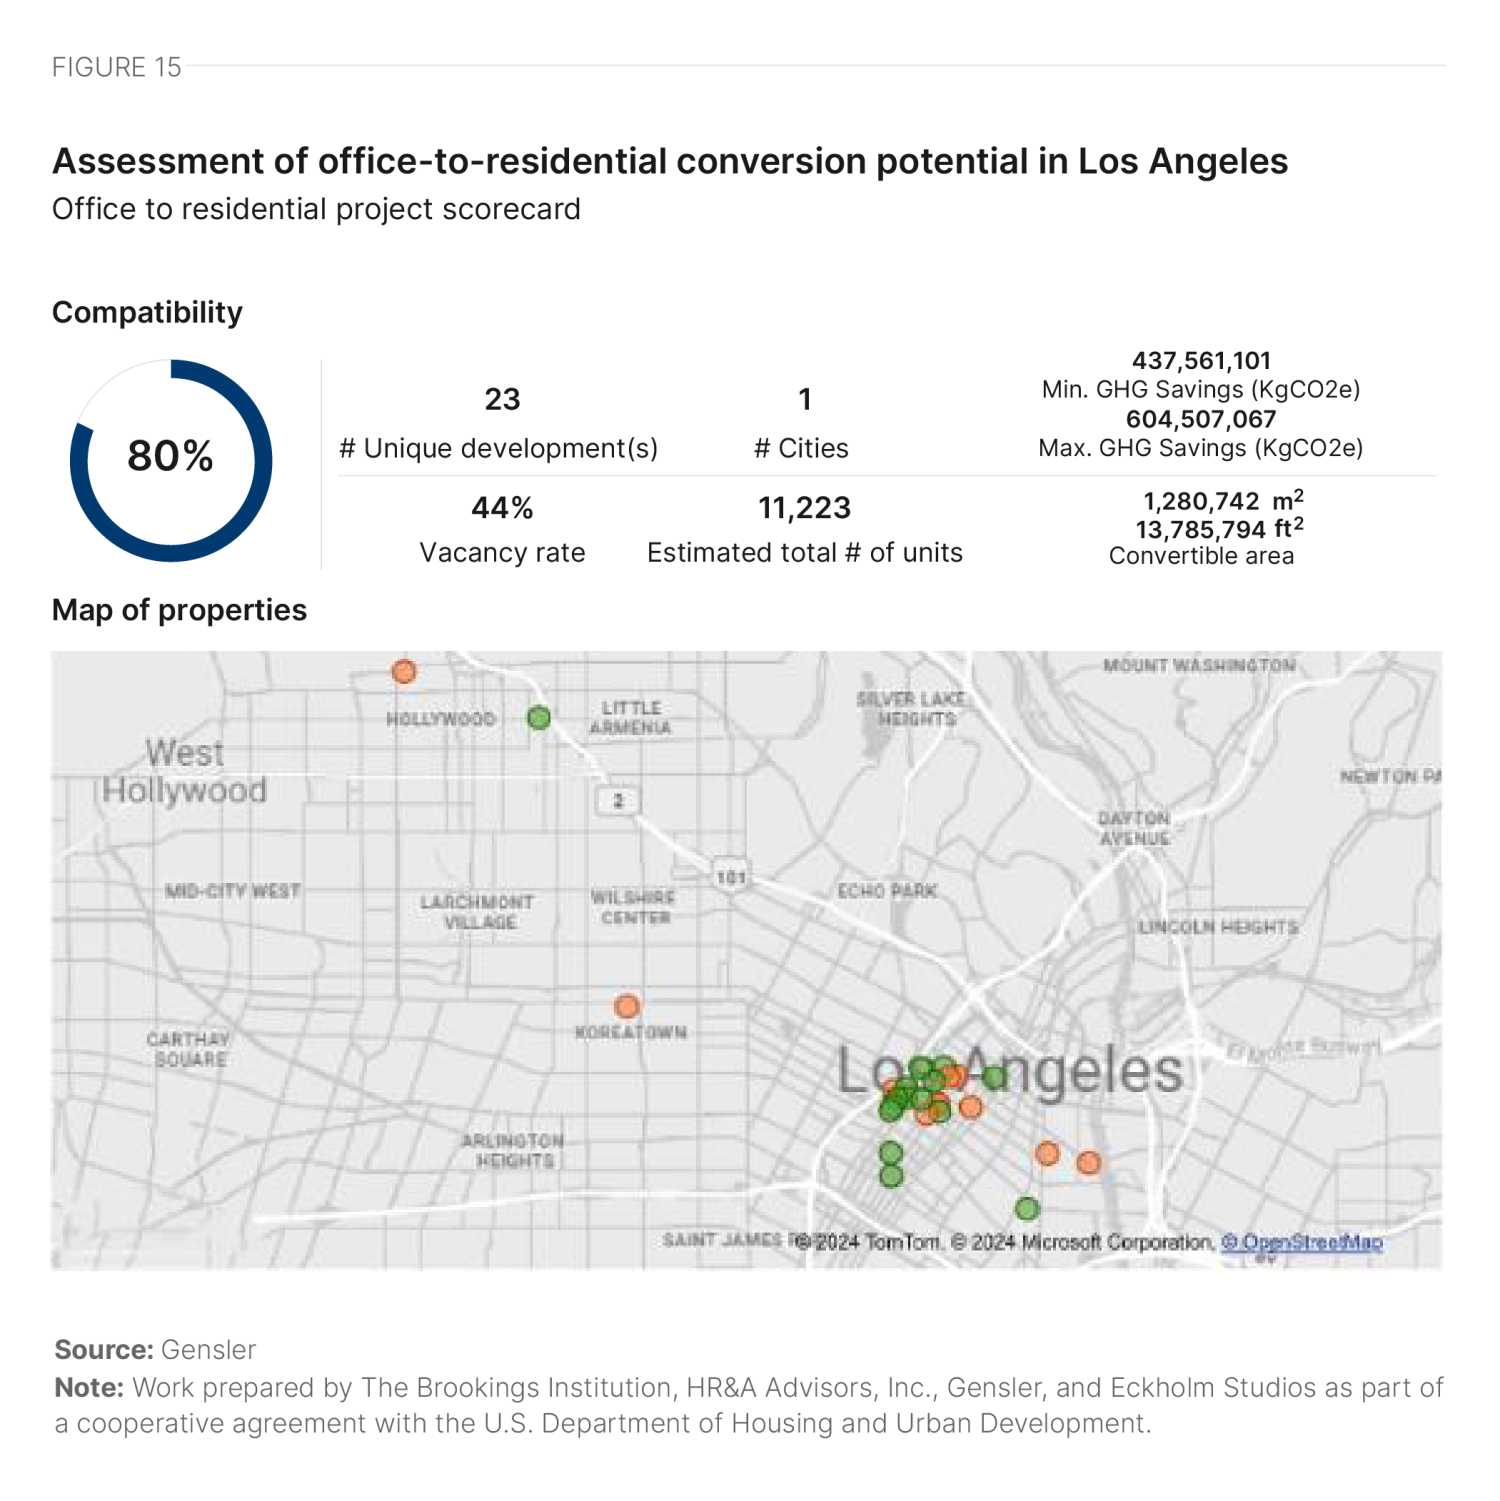
We analyzed some buildings in multiple parts, resulting in a total of 27 distinct parts studied. Of these 27 parts, 15 accounted for 72% of the total building area analyzed, and each scored over 80%. Another 12 parts, making up 28% of the area, scored over 70%. Overall, the average compatibility score of buildings studied in Los Angeles is slightly higher than the average score of the 1,400-plus buildings Gensler has studied cumulatively for various clients.
Most buildings feature the desired rectangular form, but the majority have larger-than-ideal floor plates and varying core-to-window depths—posing significant challenges for some properties. For instance, 444 S. Flower St. and 433 S. Spring St. have large floor plates with deeper-than-ideal core-to-window depths, making it difficult to utilize the deep space. On the other hand, buildings such as 145 S. Spring St. and 707 Wilshire Boulevard have large floor plates but smaller-than-ideal core-to-window depths, which could result in shallower units and lower unit counts due to reduced efficiency.
Facade types range from curtain walls to punched windows, affecting the overall scores in different ways. Many buildings, such as 660 S. Figueroa St. and 445 S. Figueroa St., have the desired punched openings, while others, such as 707 Wilshire Boulevard and 3580 Wilshire Boulevard, have ribbon windows or curtain wall façades, which generally score lower due to a higher likelihood of needing replacement.
Good walkability supported by bus, rail, subway, and bike service from LA Metro positively impacted the scores of all buildings analyzed.
It is also worth noting that, due to seismic design requirements, many properties may face costly structural upgrades, which will need to be validated on an individual building basis.
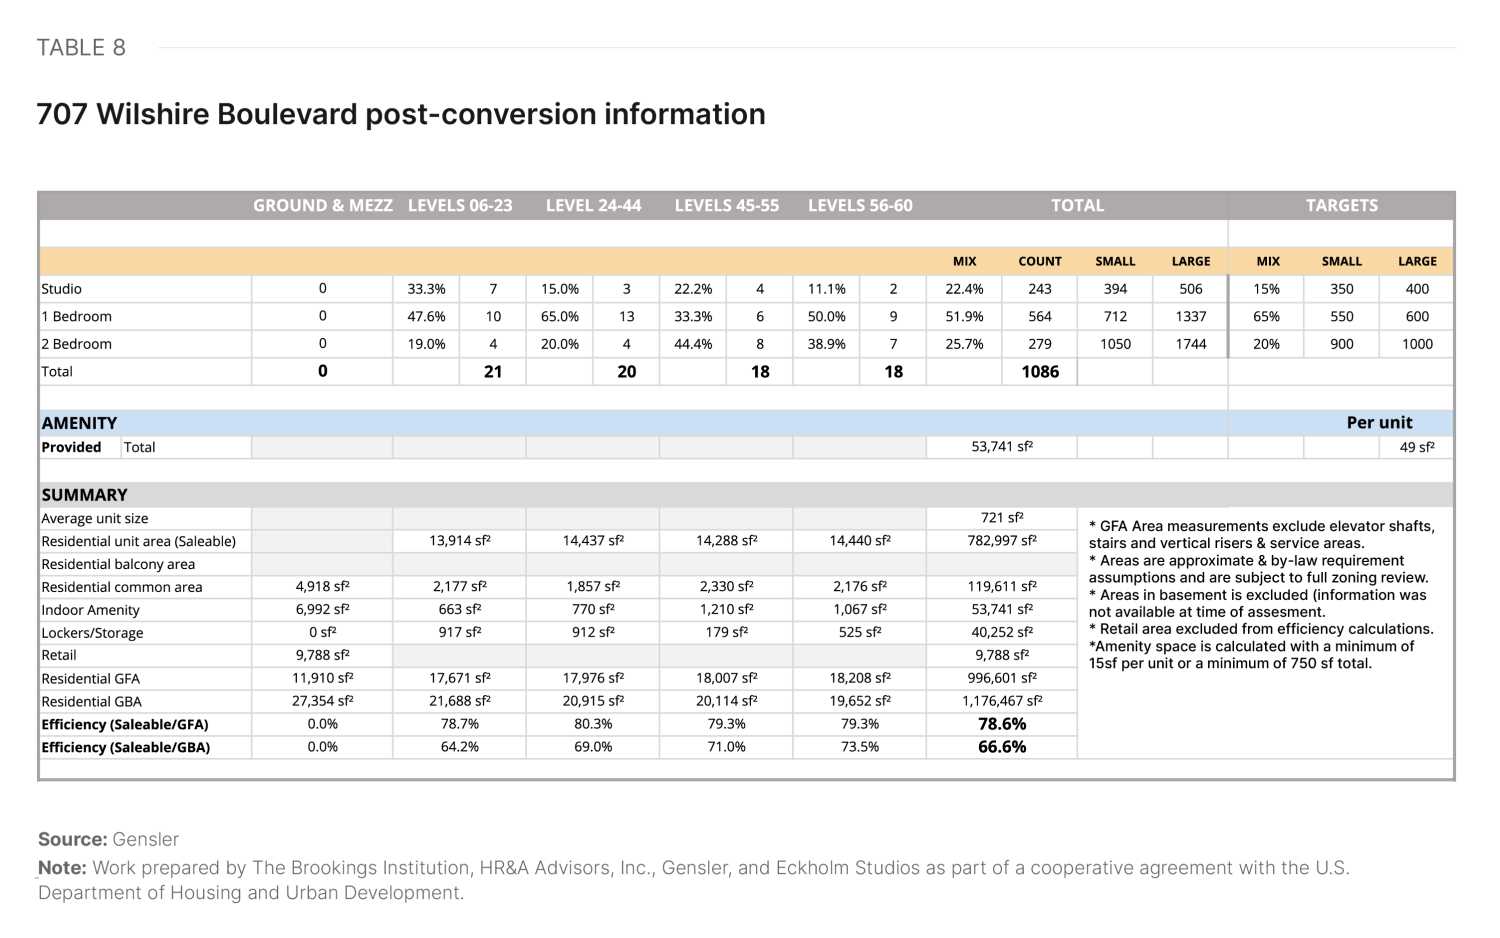
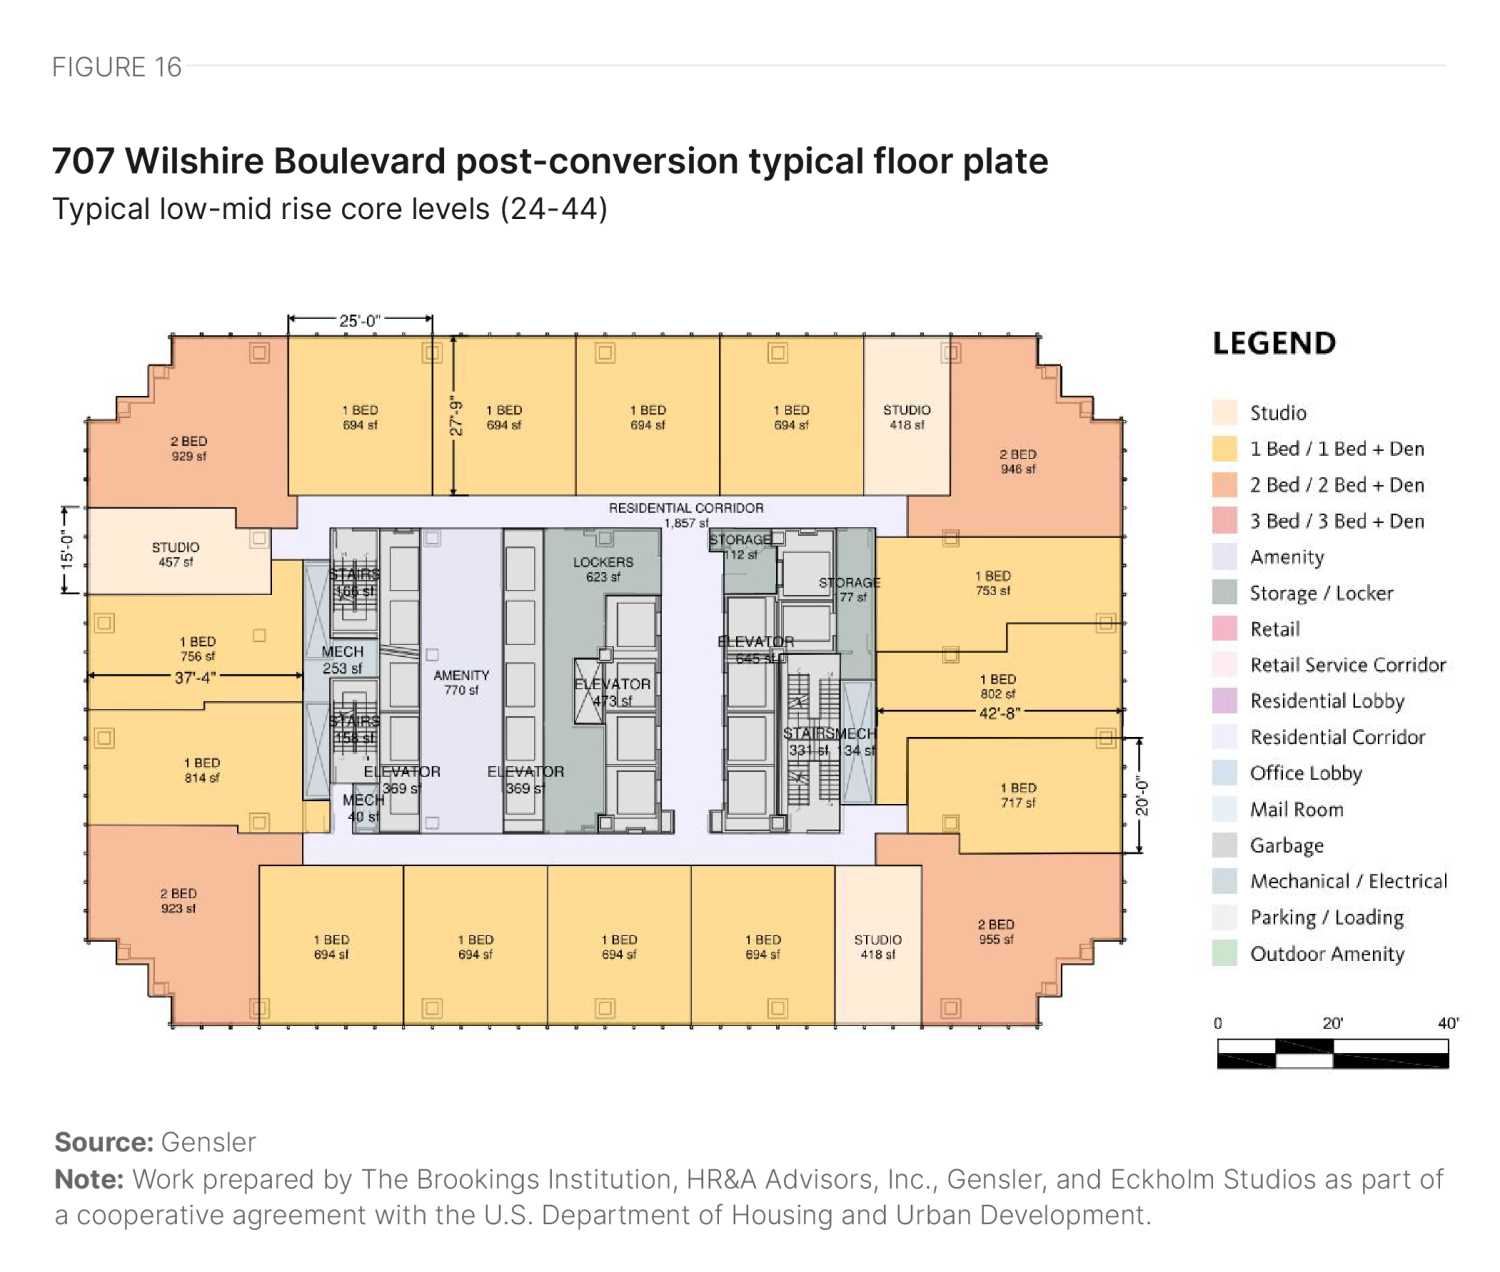
707 Wilshire Boulevard: AON Center
707 Wilshire Boulevard is centrally located at the intersection of South Hope Street and Wilshire Boulevard. Built in 1974, it is a 62-story structure with a gross area of 1,285,586 square feet.
The building features a rectangular floor plate with a centrally located core. Although the floor plate size is slightly larger than ideal, the elevator core is also larger due to the building’s size, resulting in a smaller-than-ideal core-to-window depth. As a result, the units are close to market size, but the floor plate efficiency is heavily impacted by the limited depth and size of the core (Figure 16). Multiple elevator banks also create interstitial spaces, which can be used for storage but negatively affect efficiency. The curtain wall façade provides excellent access to views and daylight, but if a developer retains it, they may need to add operable sections. The ground floor can include retail, with some space allocated to the residential lobby and service areas. The total residential yield is summarized in Table 8.
445 South Figueroa Street
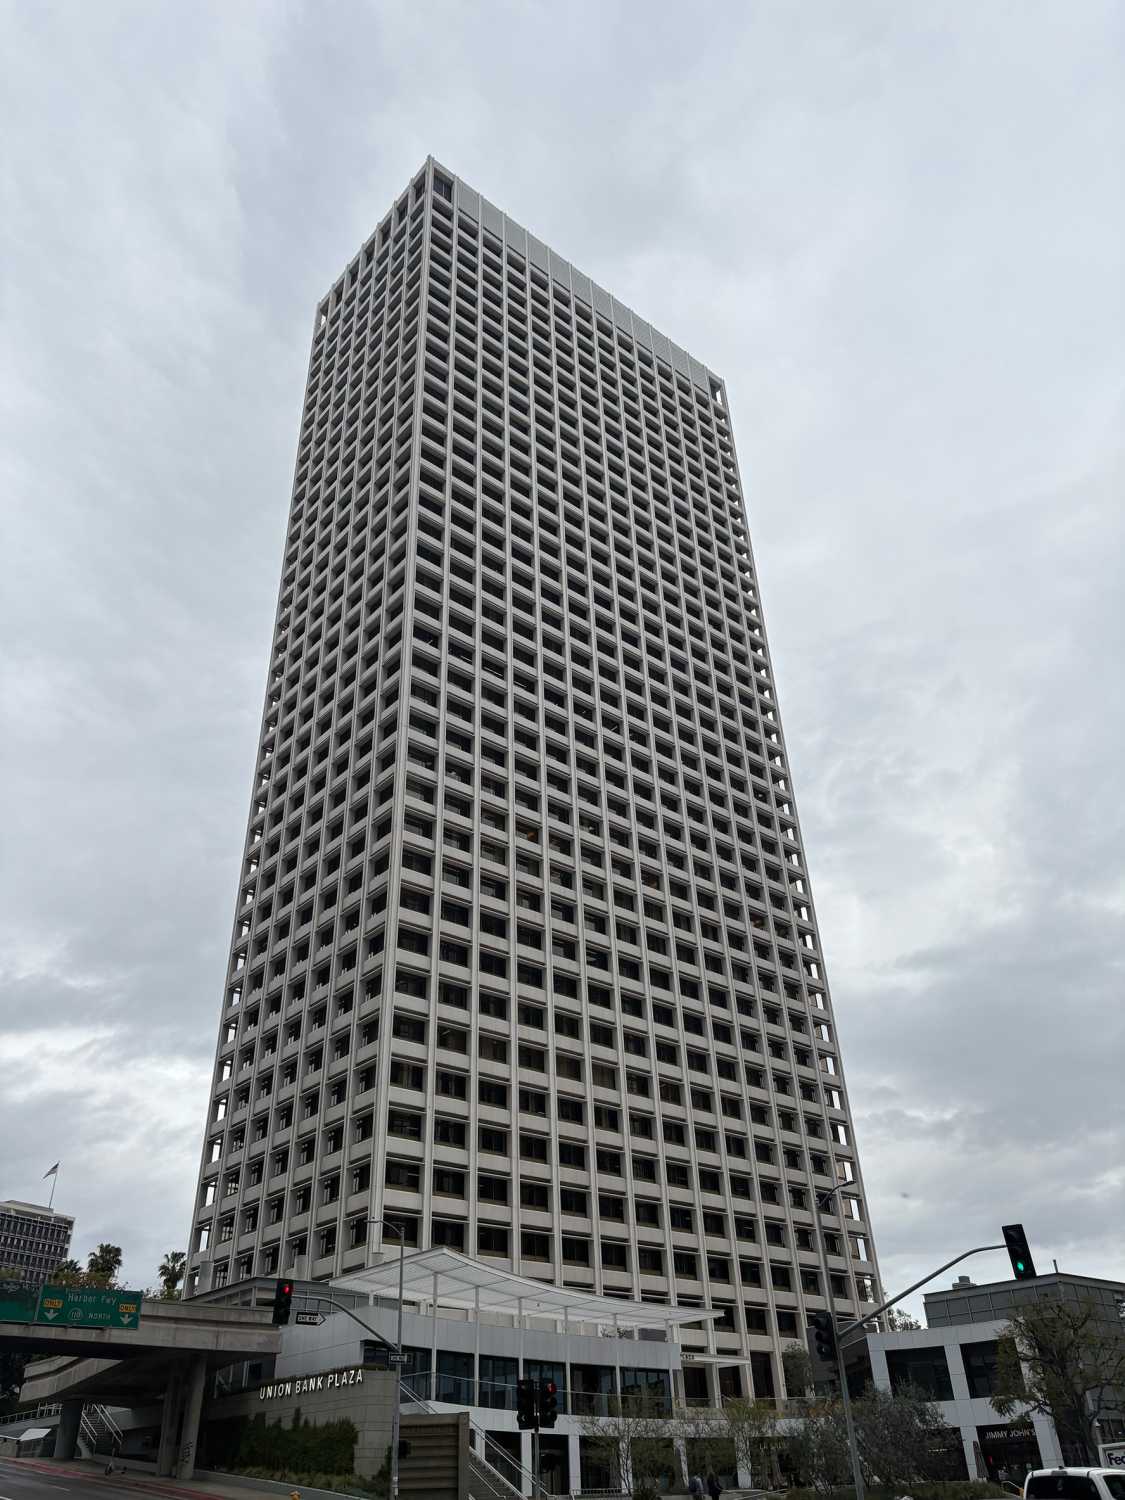
445 S. Figueroa St. is centrally located at the intersection of Fifth Street and South Figueroa Street. Built in 1967, it is a 40-story structure with a gross area of 776,040 square feet.
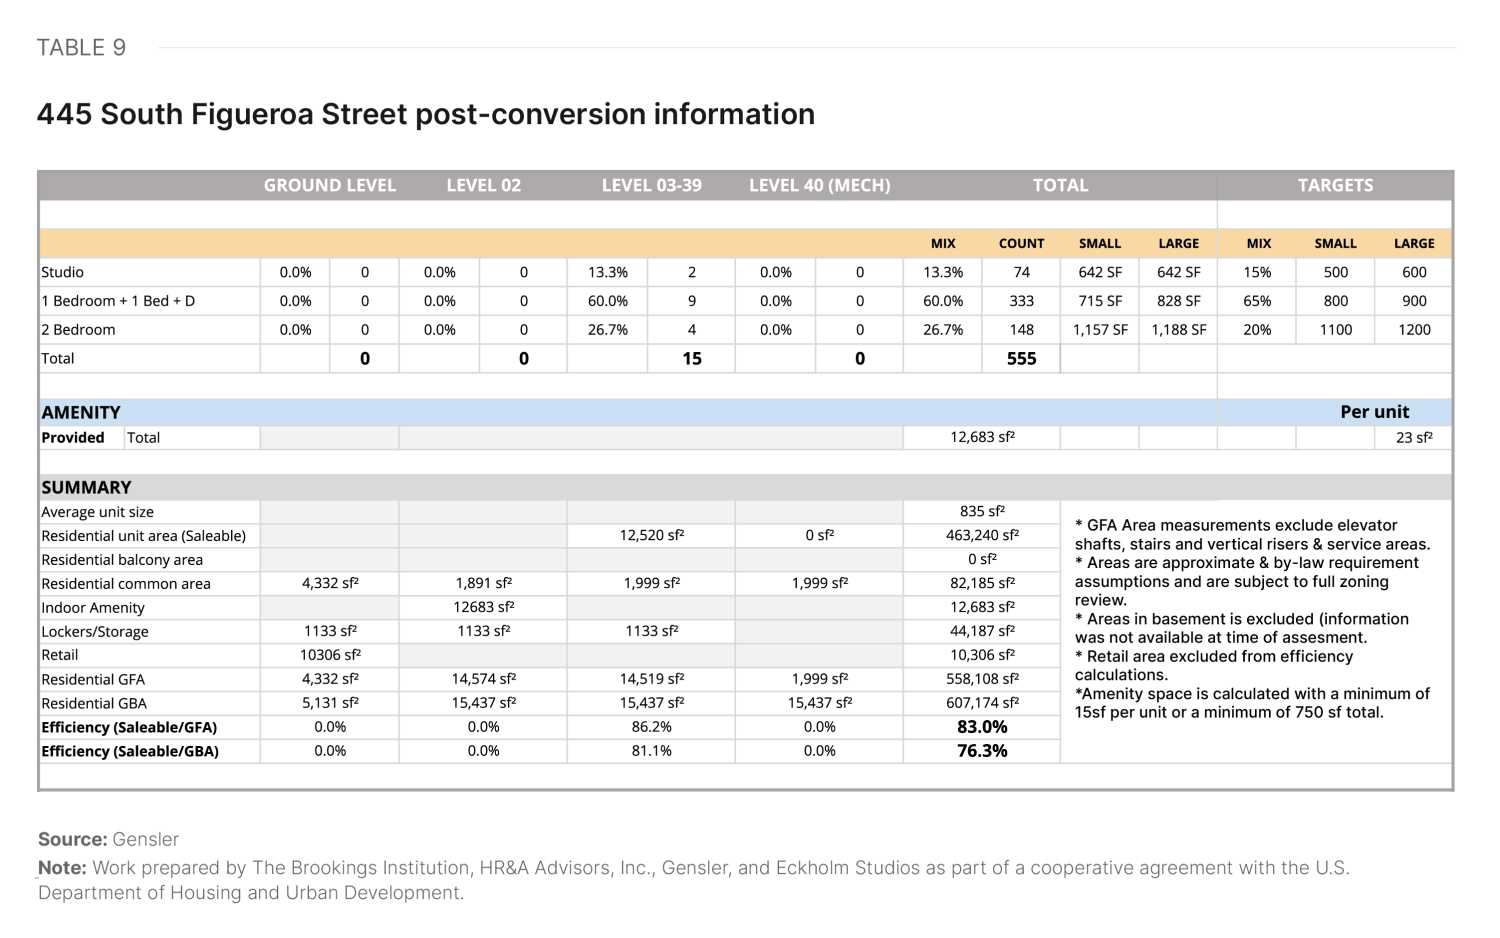
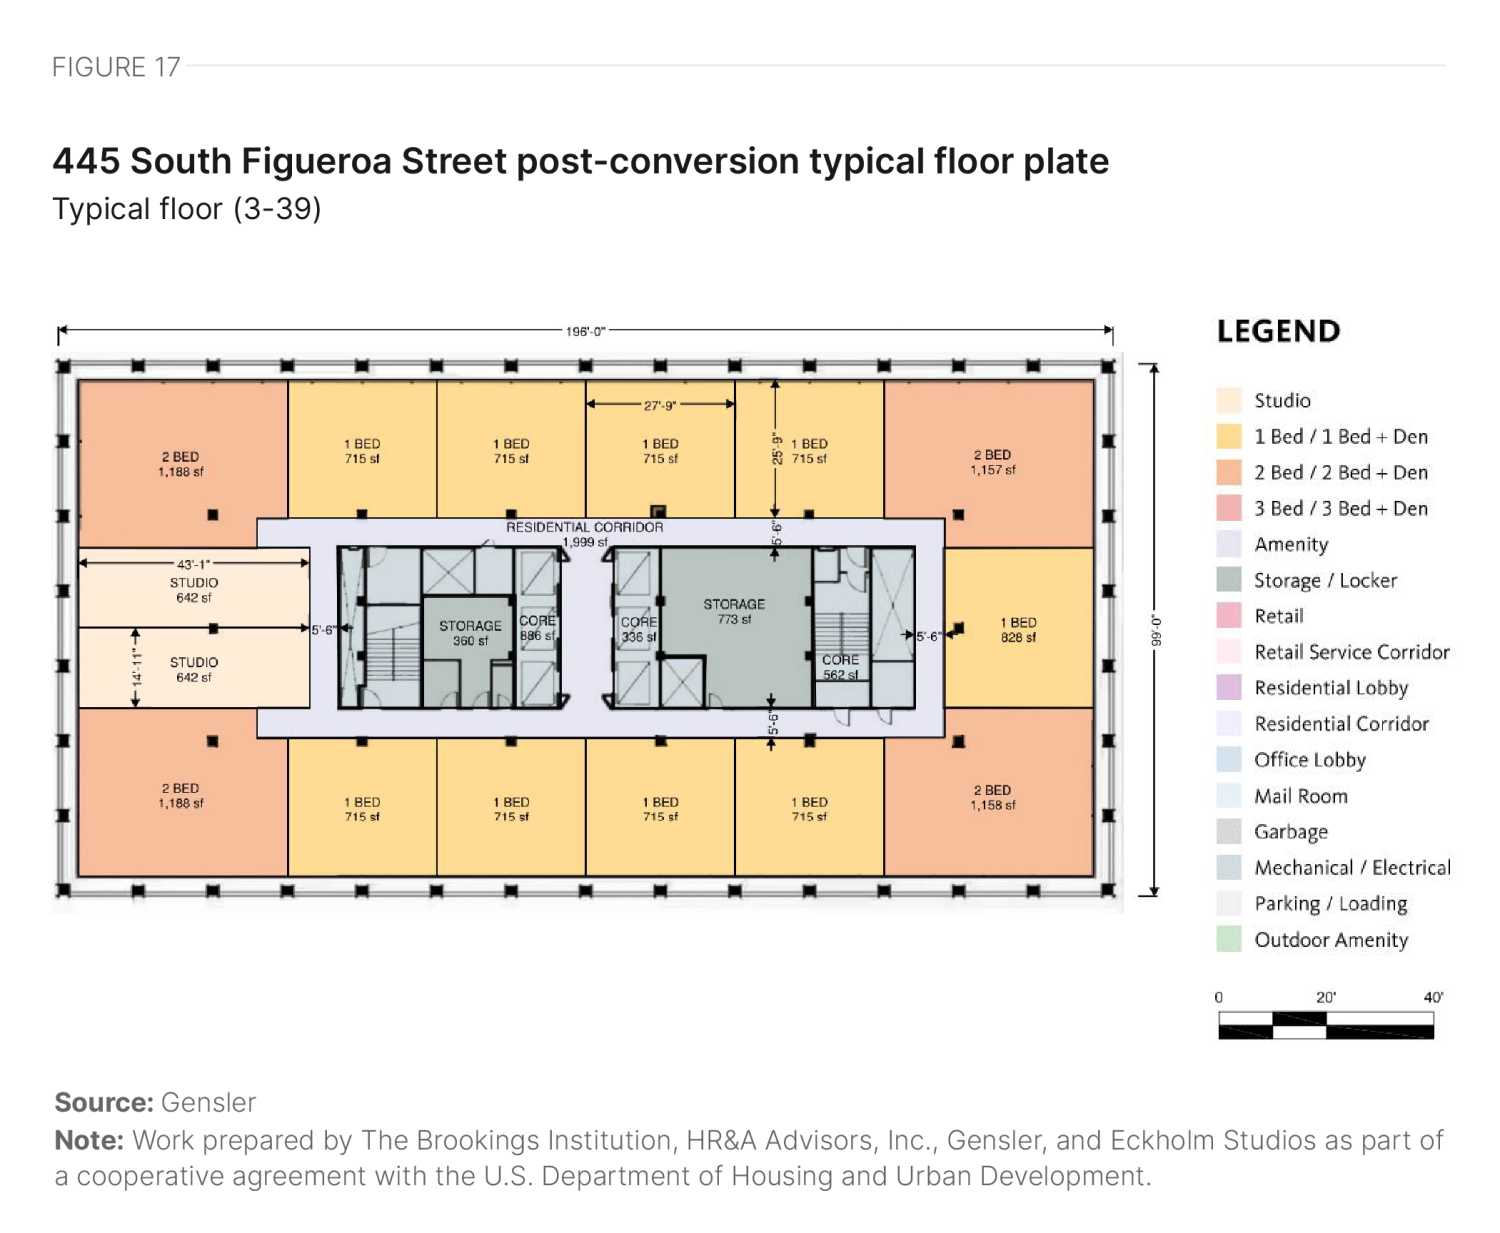
The building features a rectangular floor plate with a centrally located core. Although the floor plate size is slightly larger than ideal and the core-to-window depth is slightly smaller than ideal, the floor plate achieves a reasonable level of efficiency (Figure 17). Some deep spaces exist around the core, where the developer can introduce storage. The punched windows provide excellent access to views and daylight. The ground floor could convert to retail with some space allocated to the residential lobby, amenities, and service spaces. The residential yield of our scenario is summarized in Table 9.
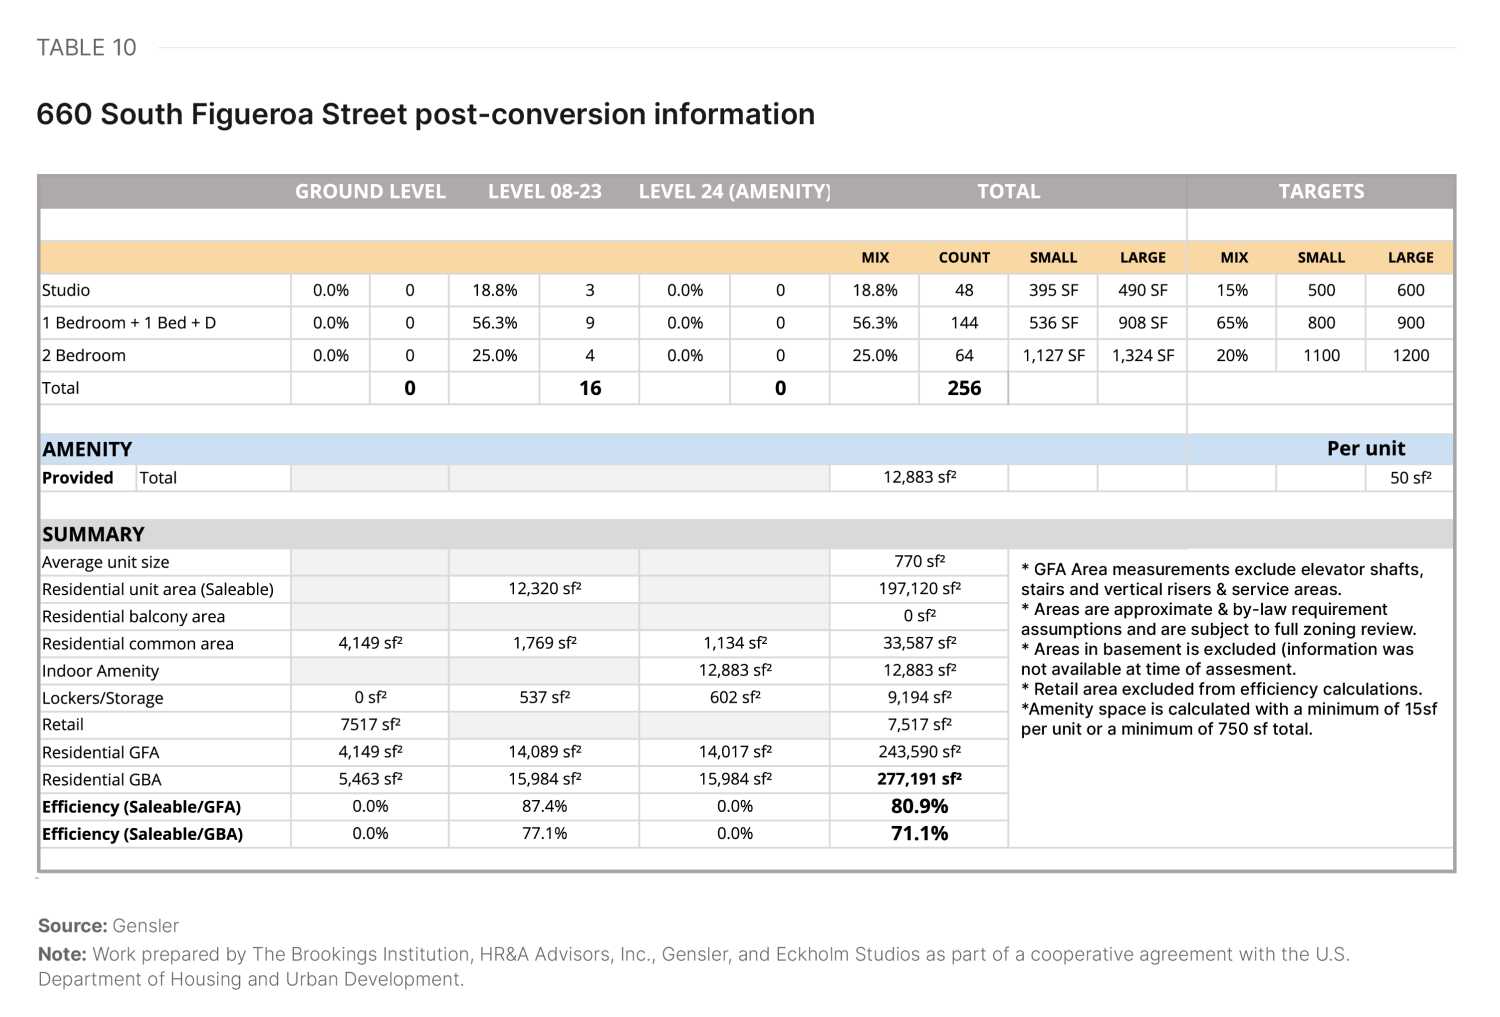
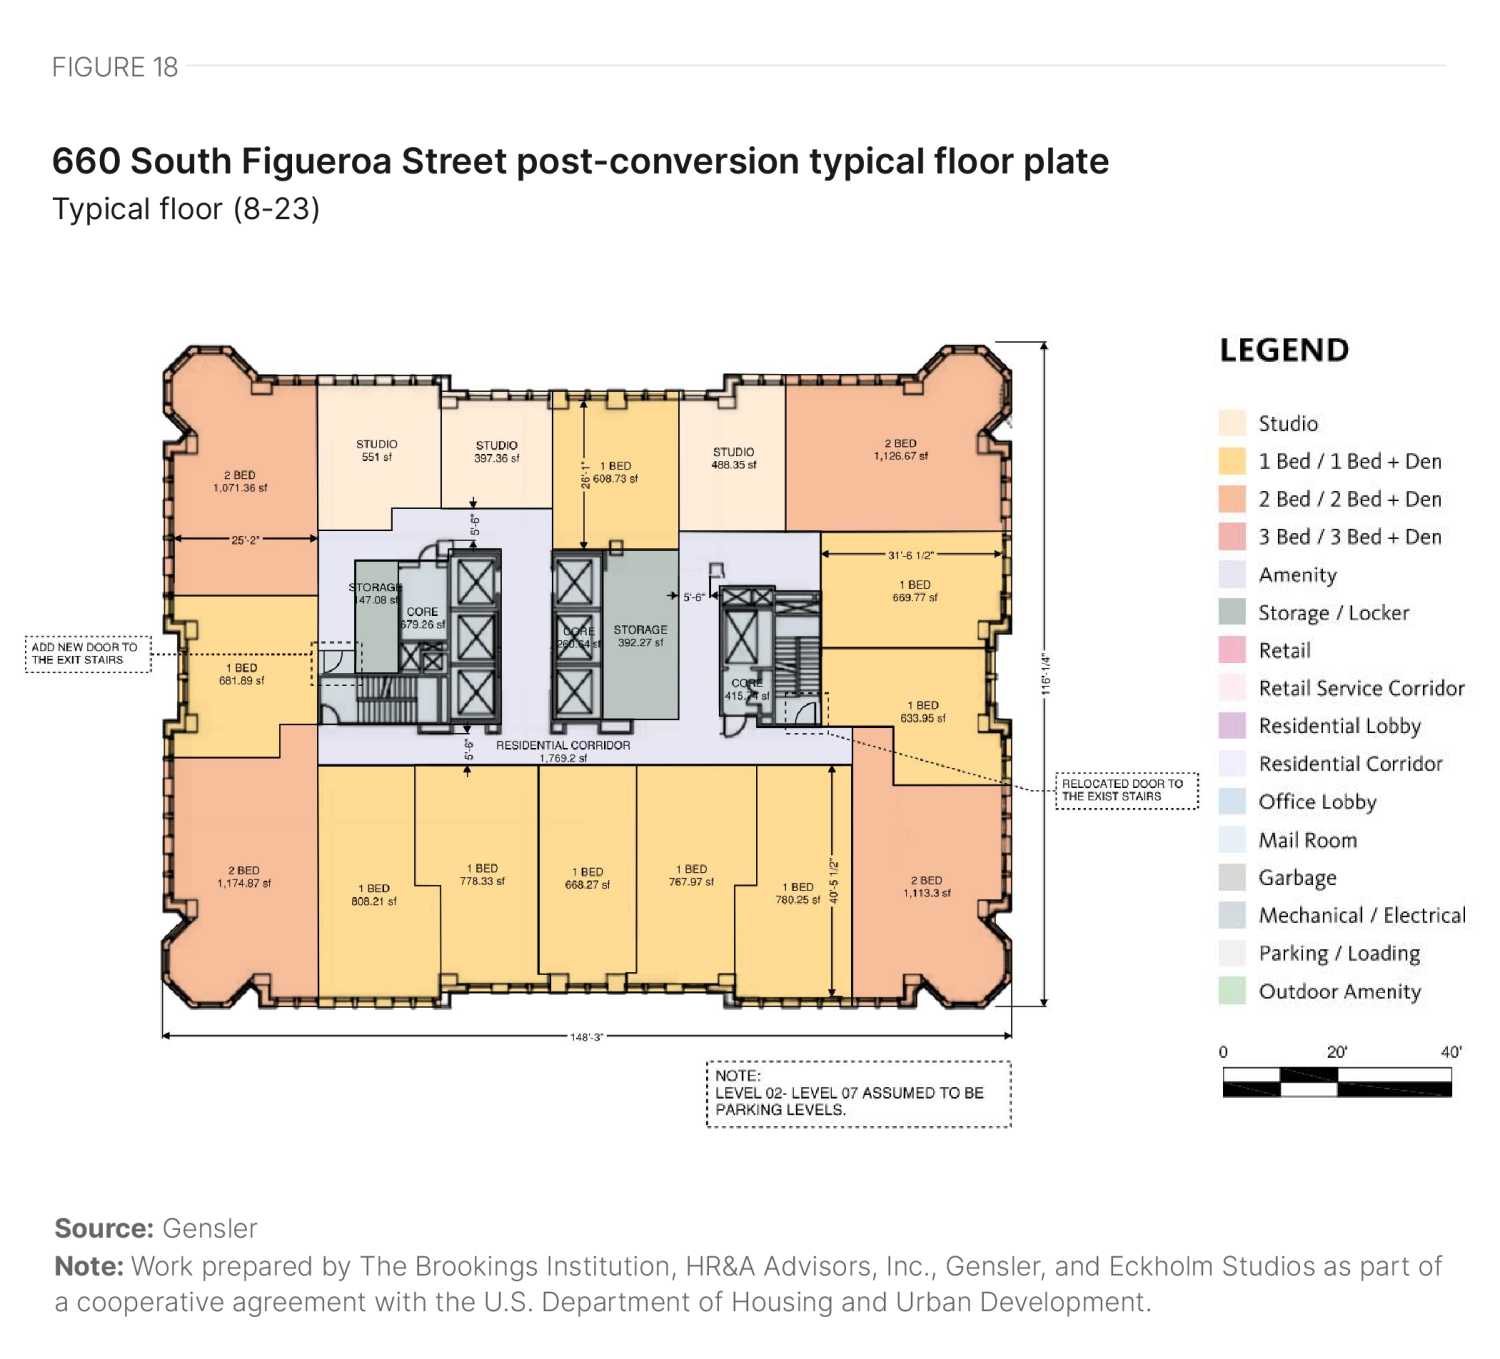
660 South Figueroa Street
660 S. Figueroa St. is located centrally at the intersection of Seventh Street and South Figueroa Street, directly over an LA Metro rail portal. Built in 1989, it is a 22-story structure with a gross area of 289,152 square feet.
The building features a rectangular floor plate with a slightly off-center elevator core. The floor plate size is larger than ideal with varying core-to-window depth. This results in close to market size units in some parts of the building but smaller units in others. The full yield is presented in Table 10. Overall, the floor plate achieves a reasonable level of floor plate efficiency (Figure 18). The punched windows provide excellent access to views and daylight. The lower floors include three levels of parking and one level of mechanical floor that we excluded from the study. The ground floor in this scenario could be a mix of retail and space allocated to the residential lobby and service areas.
Future outlook
Los Angeles’ core commercial neighborhoods face significant challenges that, when combined, may pose an existential crisis for the city. Office space vacancy continues to increase, signifying that businesses are less inclined to locate there. Multifamily housing vacancy is also increasing, signifying that households are not choosing to live there. This is particularly surprising given that the region at large is experiencing a housing crisis in which there is not enough housing—and still, households do not choose to live in downtown Los Angeles. Homelessness is at historic highs.
To quantify these issues and understand them together, we can look at how many people are in Los Angeles and how that has changed over time, based on cell phone location tracking data. Across the entire city, daily visitation on a typical Thursday is up by 1% between fall 2019 and fall 2023. However, typical daily visitation in downtown is down 6% (Table 11). The current trajectory for downtown Los Angeles is not sustainable. The city needs a catalyst for change.
|
Winston-Salem |
St. Louis |
Pittsburgh |
Houston |
Los Angeles |
Stamford |
|
|---|---|---|---|---|---|---|
|
Citywide |
||||||
| Fall 2019 | 972,648 | 1,139,210 | 1,042,281 | 10,416,616 | 13,082,015 | 427,544 |
| Fall 2023 | 1,083,344 | 1,224,894 | 1,269,712 | 10,732,698 | 13,265,515 | 523,890 |
| Percent Change | 11% | 8% | 22% | 3% | 1% | 23% |
|
Downtown |
||||||
| Fall 2019 | 46,014 | 119,880 | 120,850 | 275,304 | 793,111 | 102,939 |
| Fall 2023 | 45,570 | 113,112 | 106,773 | 242,267 | 747,974 | 124,271 |
| Percent Change | -1% | -6% | -12% | -12% | -6% | 21% |
Source: Replica data
Note: Work prepared by The Brookings Institution, HR&A Advisors, Inc., Gensler, and Eckholm Studios as part of a cooperative agreement with the U.S. Department of Housing and Urban Development.
Fortunately, despite the ample frustrations of both local and state politics, it remains fundamentally true that Los Angeles is a very big city capable of accomplishing very big things. The planned 2028 Los Angeles Olympics will draw a lot of attention and pressure to the region’s sports facilities and infrastructure—and will hopefully generate momentum toward removing dated processes that prevent housing production.
No one source of production can solve Los Angeles’ housing crisis. However, many potential solutions have been underestimated by skeptics. For example, accessory dwelling units (ADUs) were dismissed by many as a “slightly positive” addition. Yet multiple statewide policy reforms and the launch of a local accelerator program have created a production boom that is a model for how to create a more diverse and abundant housing stock. Just as ADUs made a dent in housing production in the suburbs, office-to-residential conversion may also prove additive to housing production in the urban core.
Office-to-residential conversion case studies

Authors
Authors listed in alphabetical order


-
Acknowledgements and disclosures
This research was supported by the U.S. Department of Housing and Urban Development under a cooperative agreement.
The authors thank Hanna Love for her review of this piece.
The authors also thank the following contributors for their invaluable assistance on this project:
HR&A:
- Stefan Korfmacher – Research Analyst
- Clark Ricciardelli – Analyst
Gensler:
- Diksha Jain – Architect
- Ingmar Buchner – Designer
- Lisa Matthews – Intern
- Nancy Yeh – Designer
- Jose Segura – Architect
Turner Construction:
- Reinaldo Rodriguez
All remaining errors and omissions are those of the authors.
The work that provided the basis for this publication was supported by funding under an award with the U.S. Department of Housing and Urban Development. The substance and findings of the work are dedicated to the public. The author and publisher are solely responsible for the accuracy of the statements and interpretations contained in this publication. Such interpretations do not necessarily reflect the views of the Government.
-
Footnotes
- Additional areas within the city of Los Angeles were covered by the 1999 Adaptive Reuse Ordinance (South Figueroa, etc.). However, local stakeholders advised a narrower definition to focus on those regions where the bulk of conversion activity has occurred.
- HR&A analysis of CoStar real estate market data from 2010 to Q4 2024.
- Local stakeholders noted these two submarkets in interviews. CoStar data from 2014 to 2024 on rents support this point. However, vacancy statistics show that Century City (at 16% office vacancy) likely has stronger demand than Culver City (at 24% office vacancy).
- Brookings analysis of American Community Survey 2022 5-Year Estimates.
- HR&A analysis of CoStar real estate market data for 2014 to 2024 within Los Angeles City boundaries minus study area.
- Area median income (AMI) is a key metric used in assessing housing affordability. It is defined as the median (midpoint) of a specific geography’s income distribution (such as a metropolitan area) for different household sizes. It is calculated each year by the U.S. Department of Housing and Urban Development (HUD). According to HUD, households should pay no more than 30% of their gross income on housing, and households that pay more than 30% are considered “housing cost burdened.” HR&A’s analysis of the percentage of units by AMI category in a market begins by establishing “affordable rent levels” that are equivalent to 30% of income at AMI for different household sizes; e.g., for a one-person household in an area with an AMI of $X, the “affordable monthly rent level” would be ($X * 30%) / 12. With those rent levels established, the analysis compares unit rent levels to AMI levels at the household sizes that correspond to the number of bedrooms in a unit; e.g., a one-bedroom unit’s rent is compared against 30% of the AMI of a one-person household, and so on.
- HR&A analysis of CoStar real estate market data for Q4 2024.
- Brookings analysis of American Community Survey 2022 5-Year Estimates.
- In particular, adaptive reuse could be an opportunity to produce attainable for-sale housing product through multifamily condominiums, which could help address falling rates of homeownership in California, especially among households of color. However, the particulars of the state’s condo defect law have been identified as a barrier to condo construction. Senate Bill 1470 was introduced in February 2024 by Sen. Steve Glazer to address this issue, but did not receive a vote in committee before the legislative session ended in August.
- California’s uniform building code is adopted at the state level every three years and interpreted and enforced by local jurisdictions.
- HR&A analysis of CoStar real estate market data from 2020 to Q4 2024 and authors’ interviews with local stakeholders.
The Brookings Institution is committed to quality, independence, and impact.
We are supported by a diverse array of funders. In line with our values and policies, each Brookings publication represents the sole views of its author(s).