Executive summary
The modern world relies on a range of physical, human-made assets and systems that undergird daily life and make up the built environment. Spanning highways and railways, pipes and power plants, and homes and businesses, the built environment is expansive and foundational to the country’s economy. In turn, these structures rely on an appropriately educated and skilled workforce to design, build, and maintain them. While employers, policymakers, and other leaders widely acknowledge the need for such workers, there has not been a shared understanding of the “built environment workforce,” or the workers who directly create or modify built structures and systems.
This report provides a comprehensive and consistent definition of the built environment workforce, describes its size and characteristics, and identifies common workforce development approaches and challenges. We then provide recommendations for industry and workforce leaders to develop stronger entry points into built environment careers, as well as clearer pathways for incumbent workers. Without more robust built environment career pathways, capital projects are likely to face delays, quality problems, and cost overruns.
In our data analysis, we find:
- Ninety-five occupations totaling 15.3 million workers comprise the built environment workforce, which refers to workers who directly create or modify human-made physical structures and systems.
- Earnings for the built environment workforce as a whole are competitive with and often higher than those for workers across all occupations, shaped in part by unionization among workers in construction occupations. Nonetheless, there is substantial variation by specific occupation.
- The built environment workforce is disproportionately white and male. It also has a smaller share of workers age 24 or under compared to workers across all occupations, and some occupations have high shares of workers over age 55.
- Built environment occupations span the educational continuum and require varying levels of on-the-job training and related experience.
- Projected employer demand among built environment occupations is concentrated in a few educational categories: “high school or less,” “bachelor’s degree or more,” and “apprenticeship.”
The report’s Discussion section addresses several topics and challenges regarding the built environment workforce:
- Education requirements and career pathways are remarkably diverse across the 95 built environment occupations. Many are accessible with a high school diploma, others require a four-year degree, and some value work experience and/or on-the-job training more than formal credentials. Engineers with bachelor’s degrees and apprentices have the clearest pathways from education and training into employment. Occupations with a formal education requirement of a high school diploma or less often rely on work experience or on-the-job training (which can be of varying lengths and formality) for career advancement, but these options for career progression are not always clearly laid out.
- Measuring the supply of workers and employer demand for workers is difficult. The prevalence of informal educational and training pathways makes it difficult to estimate the supply of built environment workers. Government-generated employment projections and real-time labor market data from online job postings can provide helpful signals of current and future demand, but both have limitations.
- Diversity by race/ethnicity, age, and gender is a real concern. The built environment workforce is disproportionately white (64%) compared to all occupations (60%), especially in higher-paying positions. It is overwhelmingly male (91%). A relatively small share of its workforce is age 24 or under (9%) compared to all occupations (13%). In a demographically changing country, the industry needs to diversify its workforce if it is to remain competitive.
Finally, our Recommendations section proposes the following:
- Industry and workforce leaders in the built environment field should focus on interventions at different points in the employment cycle: recruit younger and more diverse workers; improve retention of current workers and apprentices; and develop stronger internal career ladders into supervisory and management positions. Relevant actors include employers, public and private capital asset owners, labor unions, the K-12 and postsecondary education systems, state and local employment agencies, and more.
- Capital asset owners should treat labor market forecasting and workforce planning as core to project planning and development. Labor availability is a key input to successful project delivery along with materials and equipment, and should be treated as such.
Introduction
The modern world relies on a range of physical, human-made assets and systems that undergird daily life and make up the built environment—the physical surroundings where people live, work, learn, and interact. More specifically, the built environment encompasses buildings (residential, commercial, industrial, institutional); transportation systems (roads, bridges, rail, airports); utility networks (water, wastewater, electricity, natural gas, telecommunications); and public spaces.
The very existence and ongoing function of these structures depend on a skilled workforce to design, build, and maintain them. Employers, policymakers, and other leaders widely acknowledge the need for such workers, and there are multiple efforts to develop pipelines for a variety of occupational groupings, such as the construction trades, engineers of various disciplines, and workers in the energy and water sectors. But there has not been a shared understanding of the “built environment workforce”—referring to the workers who directly create or modify built structures and systems—as a cohesive and integrated network of shared assets.
This report provides a definition of the built environment workforce based on an analysis of labor market data, literature reviews, and stakeholder engagement, relying heavily on a careful review of industry and occupational definitions. Our goal was to develop a more comprehensive definition to inform workforce development efforts related to the built environment—moving beyond more bespoke groupings of workers based on occupational similarities, academic disciplines, or industry subsectors.
After identifying which occupations belong in the built environment workforce, we describe the size of this workforce, typical wages, and demographic characteristics of its workers—both for the group as a whole and by individual occupation. We identify characteristics of existing workforce development approaches as well as common challenges. Lastly, we close with recommendations to develop stronger career pathways for built environment workers in order to better serve job seekers, incumbent workers, and employers.
Defining the ‘built environment workforce’
To create our definition, we reviewed industry and occupational definitions from the U.S. Census Bureau and the U.S. Bureau of Labor Statistics (BLS), and assessed how industries and occupations interact with each other. The Methodology section in the Appendix provides more details on this process, including building off methods from past Brookings research on the “infrastructure workforce”—a closely associated set of workers who are involved in constructing and overseeing large-scale, public-serving infrastructure systems.
We determined that members of the “built environment workforce” perform work that directly creates or modifies built structures and systems, thus capturing a broad range of industrial activities and associated occupations. This includes onsite construction trades (e.g., carpenters, electricians, plumbers), supervisors, managers, and professions such as architects and engineers.
More specifically, built environment workers meet one of the following criteria:
- They are employed in construction, architecture, engineering, or design industries.
- They are employed in occupations that construct, erect, install, or repair structures and fixtures, or plan and design structures, according to official BLS occupational definitions.
Through this process, we identified 12 detailed industry groups and 95 occupations that make up the built environment workforce. Crucially, this workforce spans many positions traditionally classified in the trades, but also positions involved in management, administration, and other service activities.
Please see the Methodology section in the Appendix for more details about our analytical approach.
Data findings
Ninety-five occupations totaling 15.3 million workers comprise the built environment workforce, referring to workers who directly create or modify human-made physical structures and systems
The 15.3 million workers that make up the built environment workforce account for nearly 8.8% of all workers nationally. These workers design, construct, install, and repair the physical structures in which people live, work, learn, travel, and interact every day, including buildings, transportation systems, utilities, public spaces, and more. The workforce spans multiple occupational categories, with construction-related jobs accounting for the largest share (about half). Other common jobs include those related to installation, maintenance, and repair; architecture and engineering; and management.
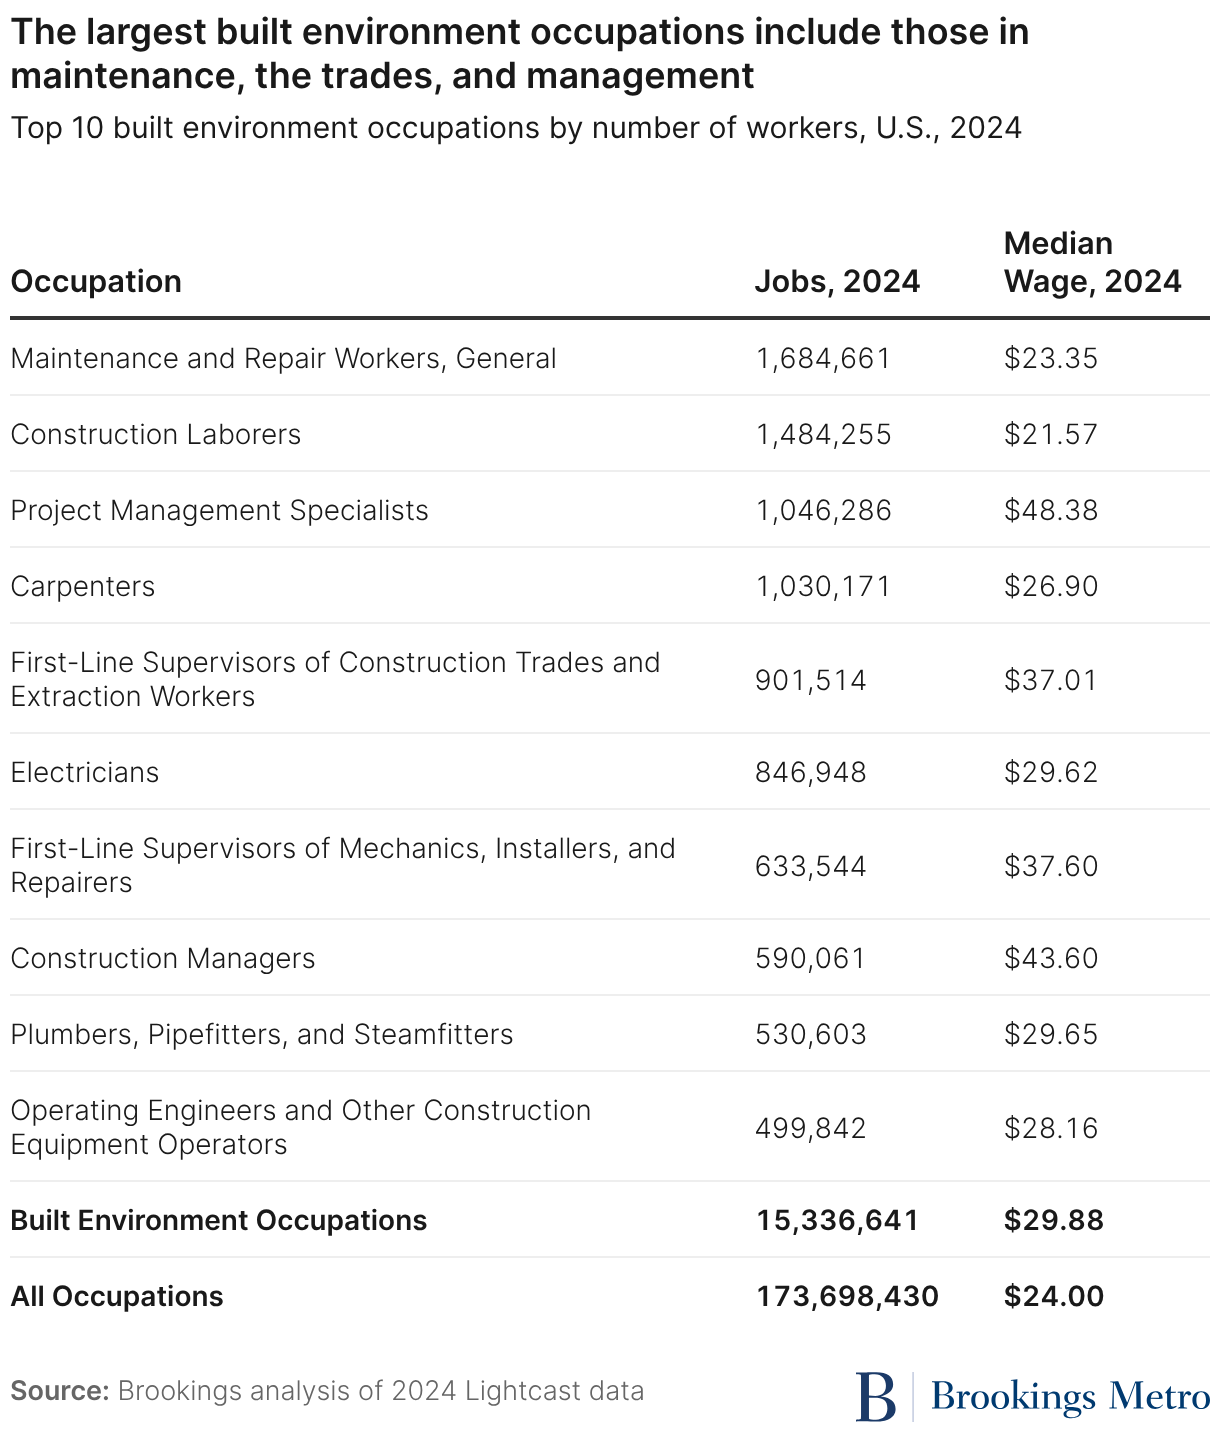
Occupations with the largest number of workers include maintenance and repair workers (1.7 million), construction laborers (1.5 million), project management specialists and carpenters (each a little over 1 million), first-line supervisors of construction workers (900,000), and electricians (850,000).
Built environment occupations are concentrated in fields such as construction, installation and maintenance, architecture, and business
Geoscientists, Except Hydrologists and Geographers
Security and Fire Alarm Systems Installers
Painters, Construction and Maintenance
Operating Engineers and Other Construction Equipment Operators
Environmental Engineering Technologists and Technicians
Helpers--Roofers
Construction and Building Inspectors
Insulation Workers, Mechanical
Forest and Conservation Workers
Floor Layers, Except Carpet, Wood, and Hard Tiles
Sheet Metal Workers
Cement Masons and Concrete Finishers
Civil Engineering Technologists and Technicians
Rail-Track Laying and Maintenance Equipment Operators
Helpers--Pipelayers, Plumbers, Pipefitters, and Steamfitters
Fence Erectors
Telecommunications Equipment Installers and Repairers, Except Line Installers
Plasterers and Stucco Masons
Interior Designers
Stonemasons
Highway Maintenance Workers
Boilermakers
Telecommunications Line Installers and Repairers
Electrical Power-Line Installers and Repairers
Pipelayers
Carpet Installers
Crane and Tower Operators
Construction Managers
Septic Tank Servicers and Sewer Pipe Cleaners
Cartographers and Photogrammetrists
Electrical and Electronic Engineering Technologists and Technicians
First-Line Supervisors of Construction Trades and Extraction Workers
Floor Sanders and Finishers
Dredge Operators
Structural Iron and Steel Workers
Reinforcing Iron and Rebar Workers
Hydrologic Technicians
Landscape Architects
Surveying and Mapping Technicians
Maintenance and Repair Workers
Electrical Engineers
Carpenters
Helpers--Carpenters
Drywall and Ceiling Tile Installers
Civil Engineers
Helpers--Electricians
Traffic Technicians
Mechanical Drafters
Project Management Specialists
Wind Turbine Service Technicians
Mobile Heavy Equipment Mechanics, Except Engines
Engineering Technologists and Technicians, Except Drafters, All Other
Explosives Workers, Ordnance Handling Experts, and Blasters
Construction Laborers
Tile and Stone Setters
Commercial Divers
Riggers
Helpers--Installation, Maintenance, and Repair Workers
Electricians
Tapers
Radio, Cellular, and Tower Equipment Installers and Repairers
Environmental Engineers
Architectural and Civil Drafters
Insulation Workers, Floor, Ceiling, and Wall
Brickmasons and Blockmasons
Paperhangers
Urban and Regional Planners
Hazardous Materials Removal Workers
Mechanical Door Repairers
Roofers
Plumbers, Pipefitters, and Steamfitters
Pile Driver Operators
Solar Photovoltaic Installers
Earth Drillers, Except Oil and Gas
Drafters, All Other
Heating, Air Conditioning, and Refrigeration Mechanics and Installers
Terrazzo Workers and Finishers
Installation, Maintenance, and Repair Workers, All Other
First-Line Supervisors of Mechanics, Installers, and Repairers
Geological Technicians, Except Hydrologic Technicians
Surveyors
Glaziers
Foresters
Architectural and Engineering Managers
Helpers, Construction Trades, All Other
Mechanical Engineers
Electrical and Electronics Drafters
Elevator and Escalator Installers and Repairers
Paving, Surfacing, and Tamping Equipment Operators
Helpers--Brickmasons, Blockmasons, Stonemasons, and Tile and Marble Setters
Miscellaneous Construction and Related Workers
Helpers--Painters, Paperhangers, Plasterers, and Stucco Masons
Operating Engineers and Other Construction Equipment Operators
Telecommunications Equipment Installers
and Repairers, Except Line Installers
Construction Managers
Civil Engineers
Pipelayers
Architectural and Engineering Managers
Urban and Regional Planners
Radio, Cellular, and Tower Equipment Installers and Repairers
Helpers--Carpenters
First-Line Supervisors of Mechanics, Installers, and Repairers
Riggers
Environmental Engineering Technologists and Technicians
Traffic Technicians
Electrical and Electronics Drafters
Insulation Workers, Floor, Ceiling, and Wall
Hazardous Materials Removal Workers
Reinforcing Iron and Rebar Workers
Floor Layers, Except Carpet, Wood, and Hard Tiles
Environmental Engineers
Earth Drillers, Except Oil and Gas
Terrazzo Workers and Finishers
Fence Erectors
Mechanical Drafters
Helpers--Pipelayers, Plumbers, Pipefitters, and Steamfitters
Surveying and Mapping Technicians
Crane and Tower Operators
Stonemasons
Boilermakers
Maintenance and Repair Workers
Mechanical Door Repairers
Telecommunications Line Installers and Repairers
Helpers--Electricians
Miscellaneous Construction and Related Workers
Helpers--Brickmasons, Blockmasons, Stonemasons, and Tile and Marble Setters
Installation, Maintenance, and Repair Workers, All Other
Surveyors
Plasterers and Stucco Masons
Insulation Workers, Mechanical
Paperhangers
Rail-Track Laying and Maintenance Equipment Operators
Dredge Operators
Security and Fire Alarm Systems Installers
Wind Turbine Service Technicians
Helpers--Installation, Maintenance, and Repair Workers
Interior Designers
Mobile Heavy Equipment Mechanics, Except Engines
Helpers--Roofers
Roofers
Construction Laborers
Carpenters
Glaziers
Electricians
Project Management Specialists
Mechanical Engineers
First-Line Supervisors of Construction
Trades and Extraction Workers
Electrical Engineers
Explosives Workers, Ordnance Handling Experts, and Blasters
Pile Driver Operators
Structural Iron and Steel Workers
Septic Tank Servicers and Sewer Pipe Cleaners
Highway Maintenance Workers
Helpers, Construction Trades, All Other
Elevator and Escalator Installers and Repairers
Solar Photovoltaic Installers
Electrical and Electronic Engineering Technologists and Technicians
Drafters, All Other
Geological Technicians, Except Hydrologic Technicians
Tile and Stone Setters
Painters, Construction and Maintenance
Tapers
Landscape Architects
Cement Masons and Concrete Finishers
Civil Engineering Technologists and Technicians
Forest and Conservation Workers
Engineering Technologists and Technicians, Except Drafters, All Other
Cartographers and Photogrammetrists
Heating, Air Conditioning, and
Refrigeration Mechanics and Installers
Architectural and Civil Drafters
Sheet Metal Workers
Foresters
Commercial Divers
Plumbers, Pipefitters, and Steamfitters
Electrical Power-Line Installers and Repairers
Brickmasons and Blockmasons
Helpers--Painters, Paperhangers, Plasterers, and Stucco Masons
Carpet Installers
Paving, Surfacing, and Tamping Equipment Operators
Floor Sanders and Finishers
Construction and Building Inspectors
Drywall and Ceiling Tile Installers
Geoscientists, Except Hydrologists and Geographers
Hydrologic Technicians

Earnings for built environment workers are competitive with and often higher than workers across all occupations, although there is substantial variation by occupation
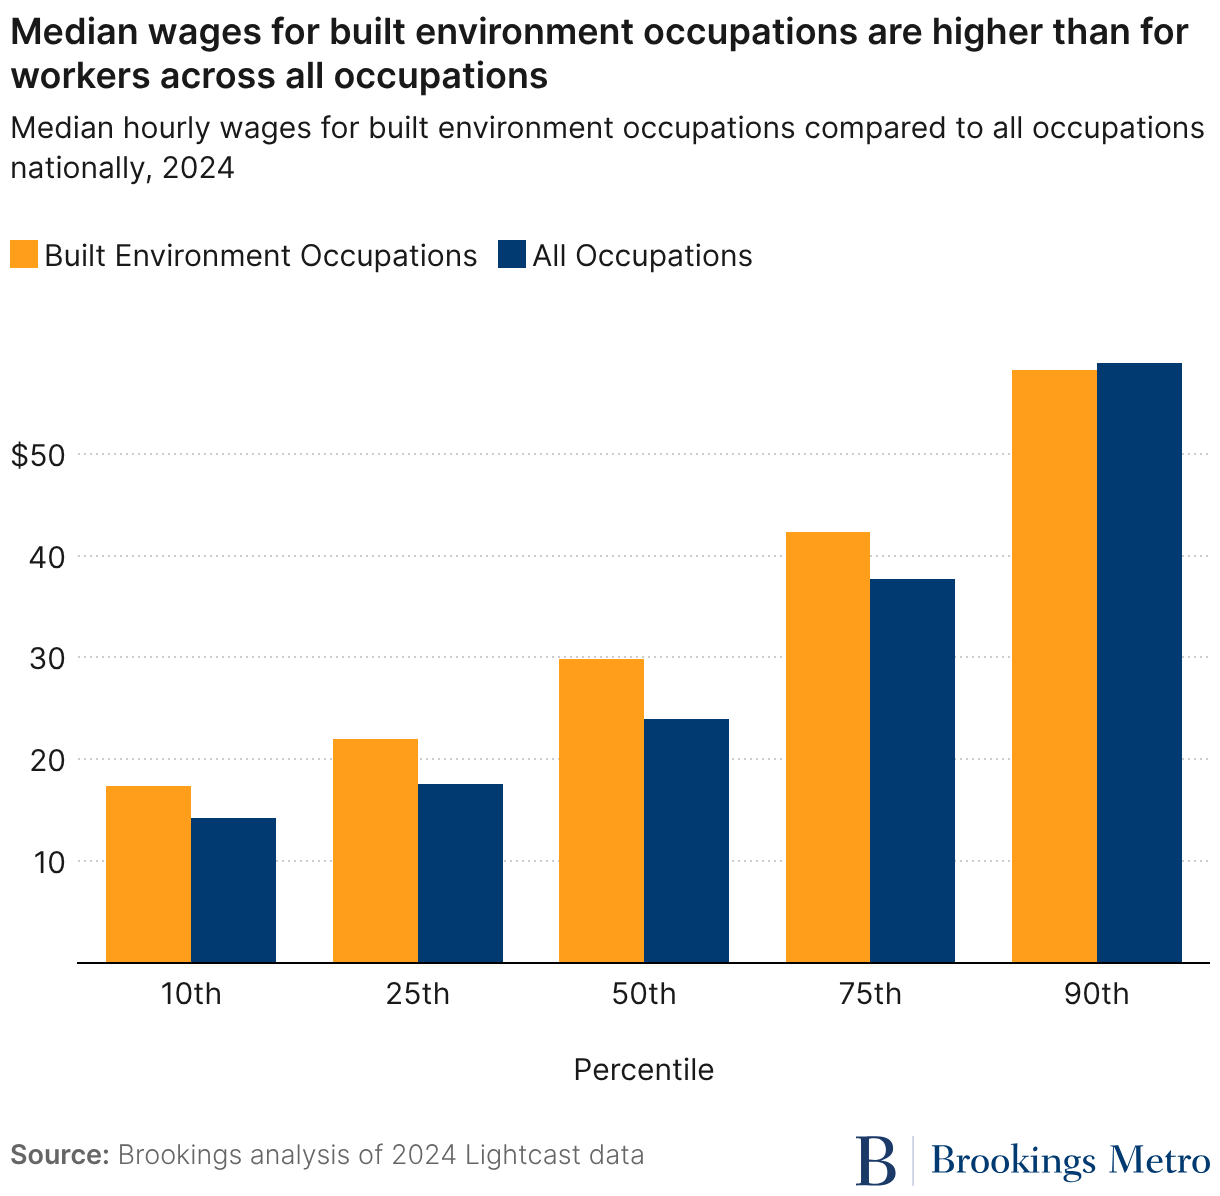
Median hourly wages for the built environment workforce as a whole are nearly $30—well above the median for all occupations ($24). As shown in Figure 2, built environment occupations also have a higher floor for workers at the lower end of the earnings spectrum. At both the 10th and 25th percentiles, hourly wages for built environment workers ($17.33 and $22.01, respectively) are considerably higher than for workers in all occupations ($14.21 and $17.59, respectively).
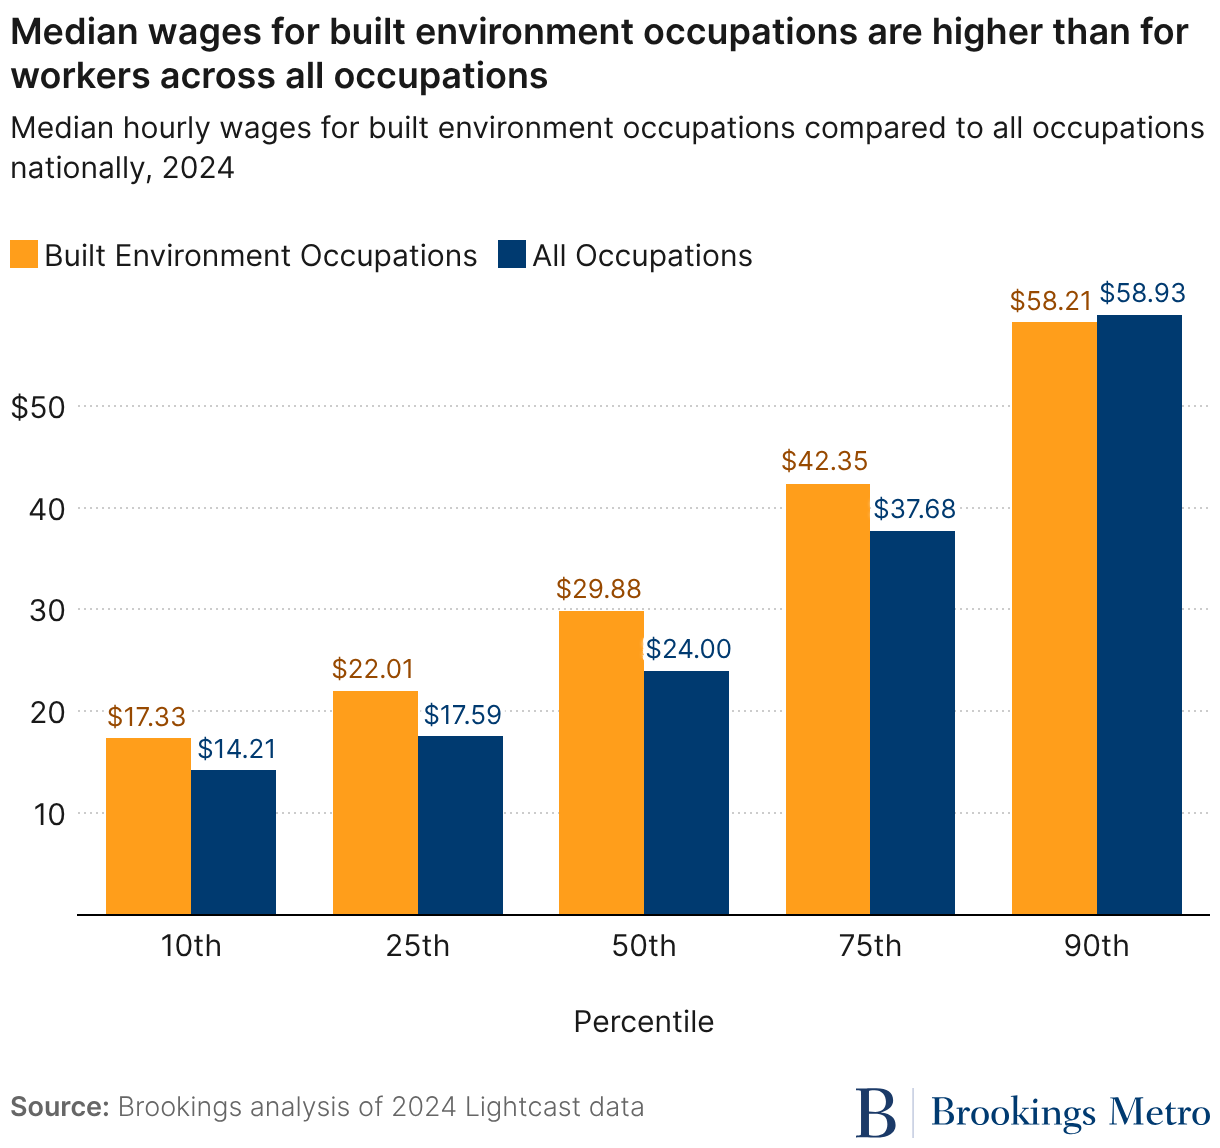
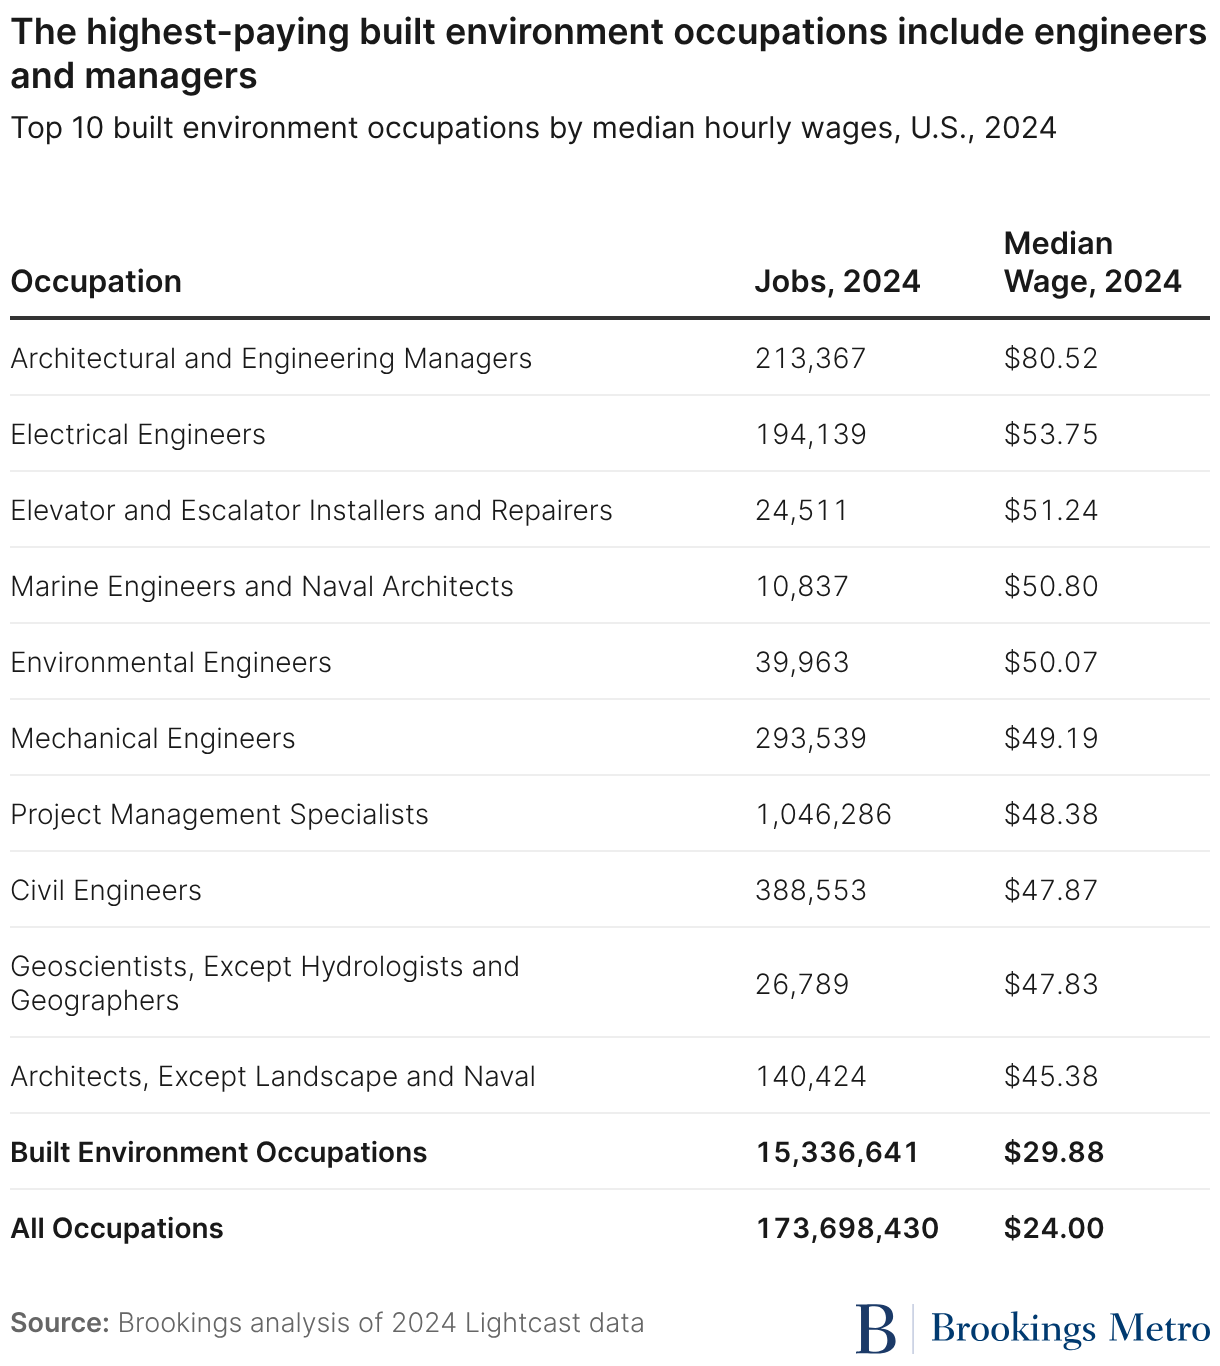
Wages vary considerably by occupation and are correlated with education, experience, and specialization. Some of the largest occupations have relatively low hourly wages, such as maintenance and repair workers ($23.35) and construction laborers ($21.57). Other relatively large occupations pay more, such as project management specialists ($48.38), carpenters ($26.90), first-line supervisors of construction workers ($37.01), and electricians ($29.62). The highest earners are architectural and engineering managers (by a wide margin, at $80.52), followed by electrical engineers ($53.75), and elevator/escalator installers and repairers ($51.24).
Wages are also influenced by unionization rates. A higher share of workers in construction occupations are union members (16%) than among workers across all occupations (10%), and unionized workers earn higher wages than their non-union counterparts—in construction and in other occupations.
The built environment workforce is disproportionately white and male, has a smaller share of workers age 24 or under compared to workers across all occupations, and some occupations have high shares of workers over age 55
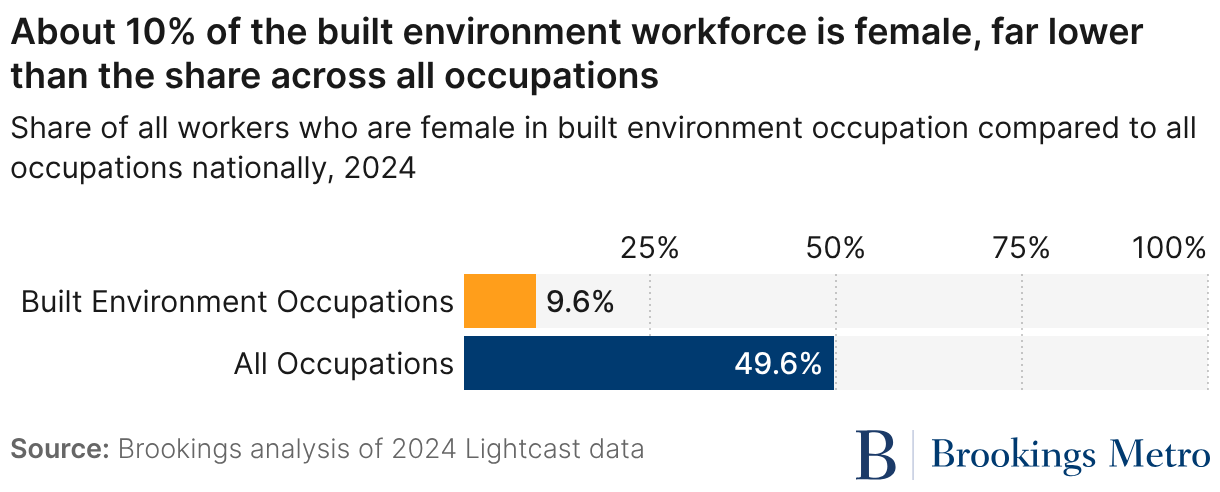
Differences by gender in the built environment workforce are stark. Women make up about 10% of these workers, despite accounting for about half of workers across all occupations.
Women are under-represented in the vast majority of built environment occupations—most dramatically in construction occupations typically requiring a high school diploma or less. Women make up about 3% to 4% of HVAC mechanics, plumbers, carpenters, electricians, and operating engineers. Although their shares are sometimes higher, women are also under-represented in occupations typically requiring a bachelor’s degree, such as civil and mechanical engineers (both about 3%), electrical engineers (10%), architectural and engineering managers (11%), and architects (26%).
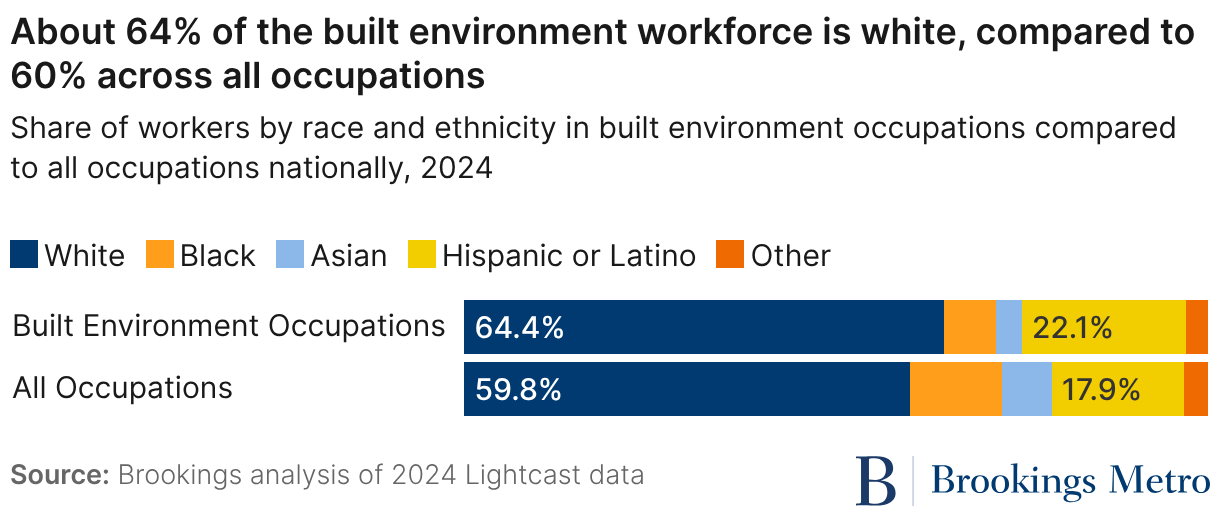
As Figure 4 shows, the built environment workforce has higher shares of workers who are white or Latino or Hispanic, and lower shares of people who are Black or Asian American compared to workers across all occupations. About 64% of the built environment workforce is white and 22% is Latino or Hispanic; across all occupations, 60% of the workforce is white and 18% is Latino or Hispanic. The share of Black workers in the built environment workforce (7%) is lower than across all occupations (13%). Asian Americans are also under-represented: They account for 4% of the built environment workforce compared to 7% across all occupations.
White workers are concentrated in higher-paying occupations. Of the 10 built environment occupations with the highest median wages, white workers make up between 66% and 81% of the workforce. Among those same 10 occupations, Black workers make up between 3% and 9% of the workforce, and Latino or Hispanic workers make up between 6% and 16%. Black workers make up very low shares of the largest occupations typically reached through apprenticeships, accounting for 4% of carpenters and 6% of electricians and plumbers. Latino or Hispanic workers are disproportionately represented among the lower-paying occupations, such as the “helpers” of various construction trades (brickmasons, pipelayers, painters, roofers, carpenters, and electricians). They account for 33% to 41% of all “helpers,” and 38% of construction laborers. All these positions with high concentrations of Latino or Hispanic workers pay below the median wage for all occupations ($24), and well below the median wage for the built environment workforce ($29.88).
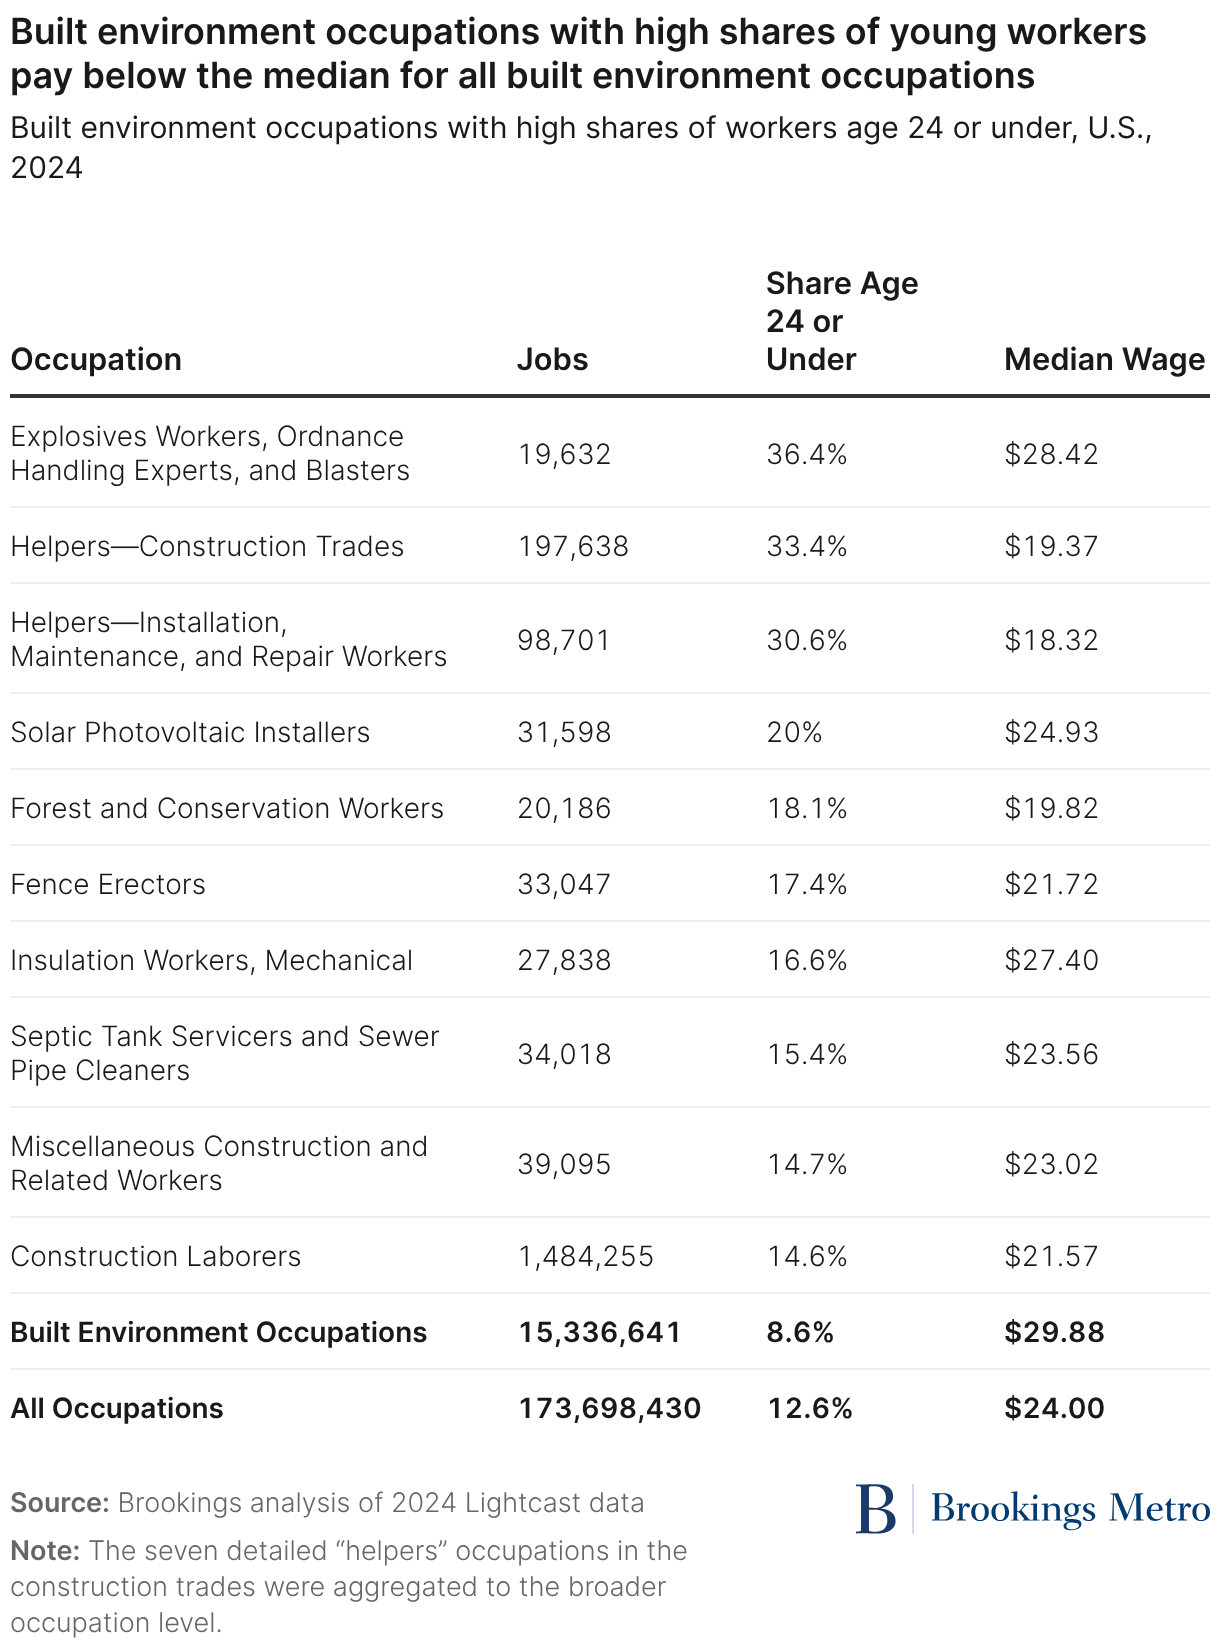
Workers age 24 or younger make up a smaller share of the built environment workforce relative to the workforce as a whole: about 9% compared to nearly 13% across all occupations. Not surprisingly, occupations with the highest concentrations of younger workers typically require lower levels of formal education and little to no related experience. For instance, more than 30% of “helpers” in various construction trades are age 24 or younger. Relatedly, built environment occupations with high shares of younger workers also pay at the lower end of the wage scale for built environment occupations.
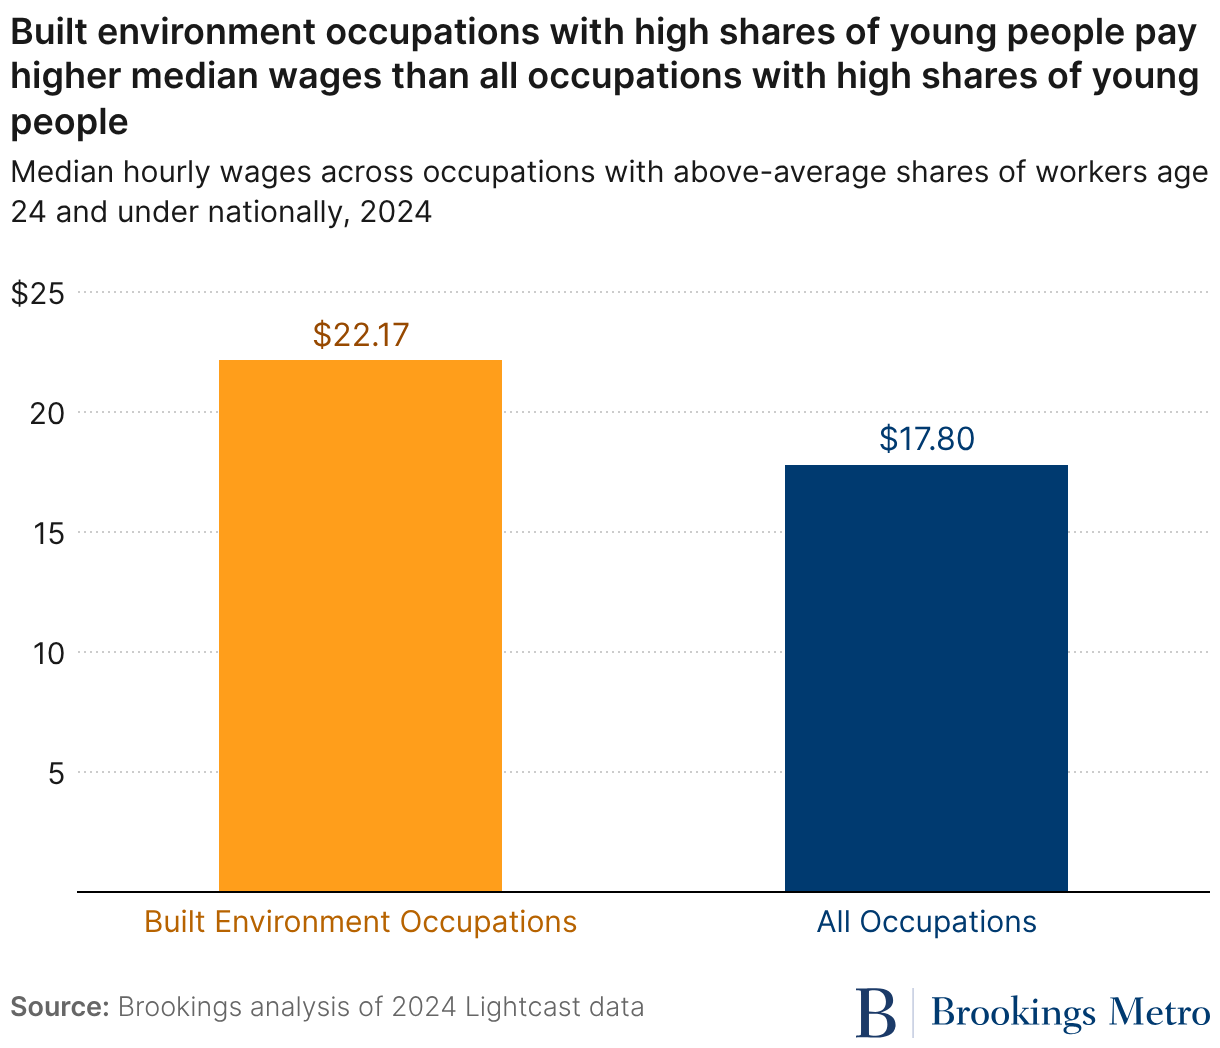
However, youth-focused built environment occupations do pay higher median wages ($22.17) than all occupations with above-average shares of young workers ($17.80). Coupled with their relatively low educational requirements, youth-focused built environment occupations could be presented as attractive employment options for young people.
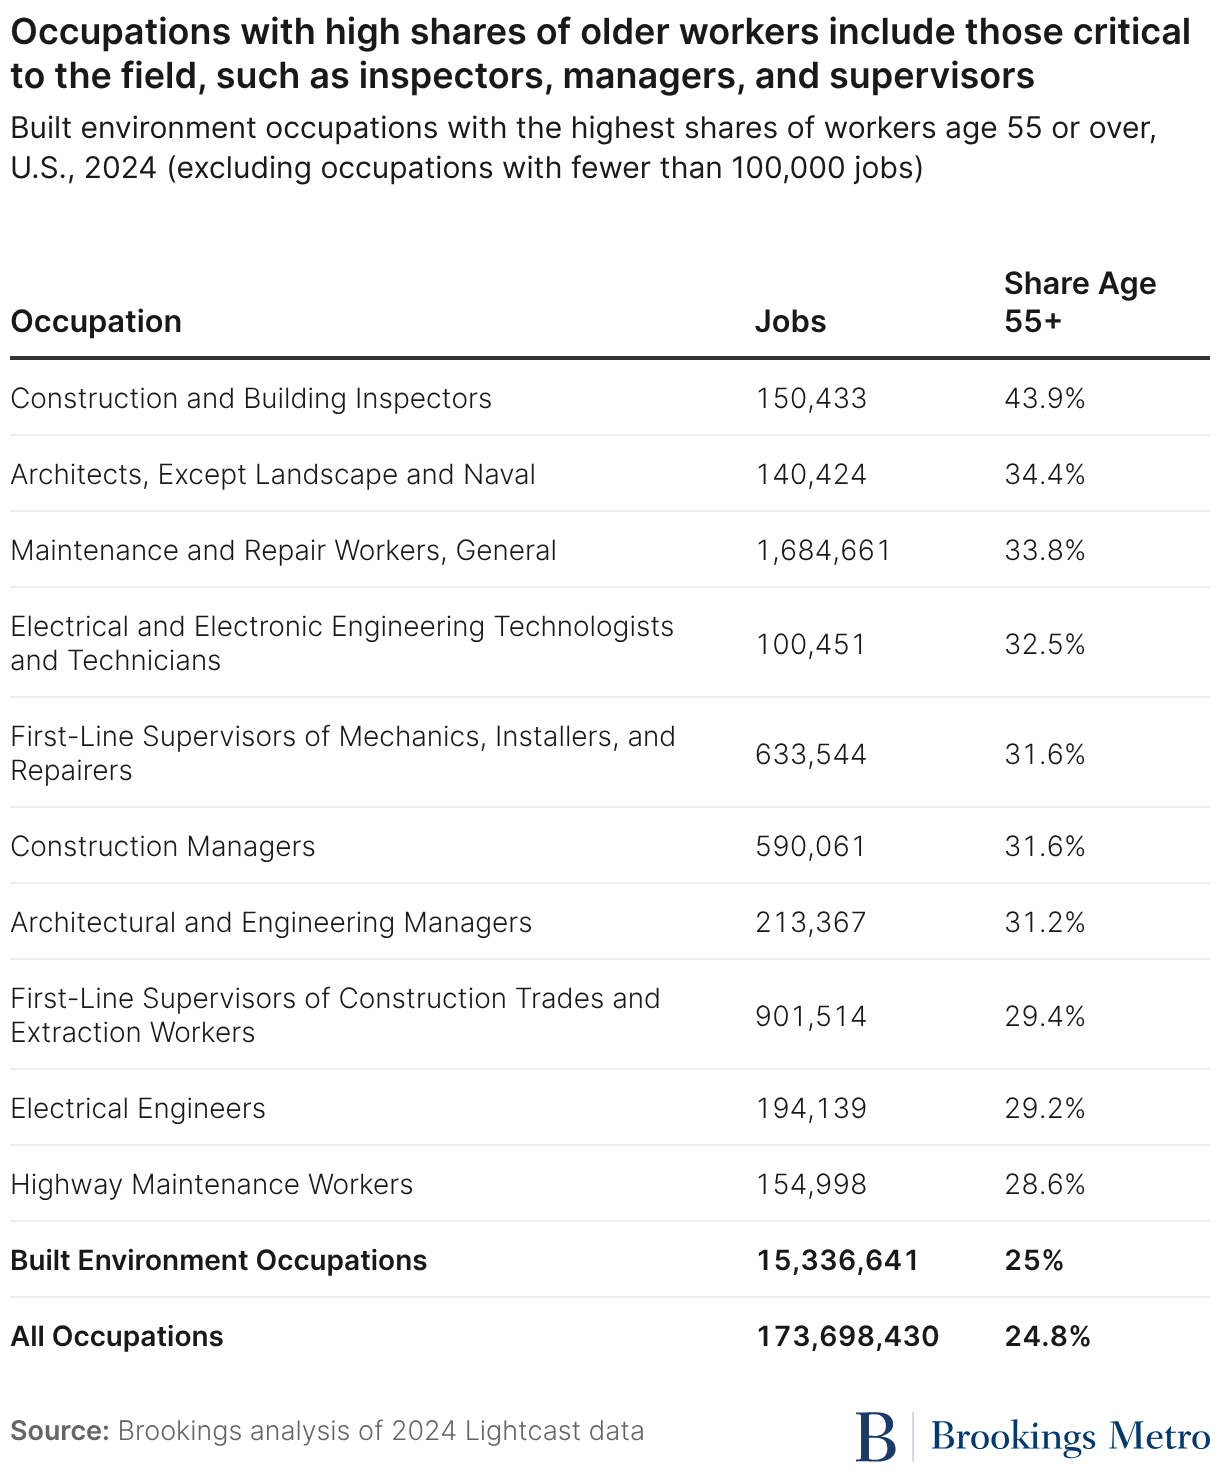
A number of occupations have above-average shares of workers over age 55, pointing to the need for succession planning and strategies to retain existing employees. Across all occupations and within the built environment workforce, about 25% of workers are over 55. Among some positions, the share of workers over age 55 are upward of 30%, including construction and building inspectors (44%), maintenance and repair workers (34%), a variety of managerial and supervisory positions, and more.
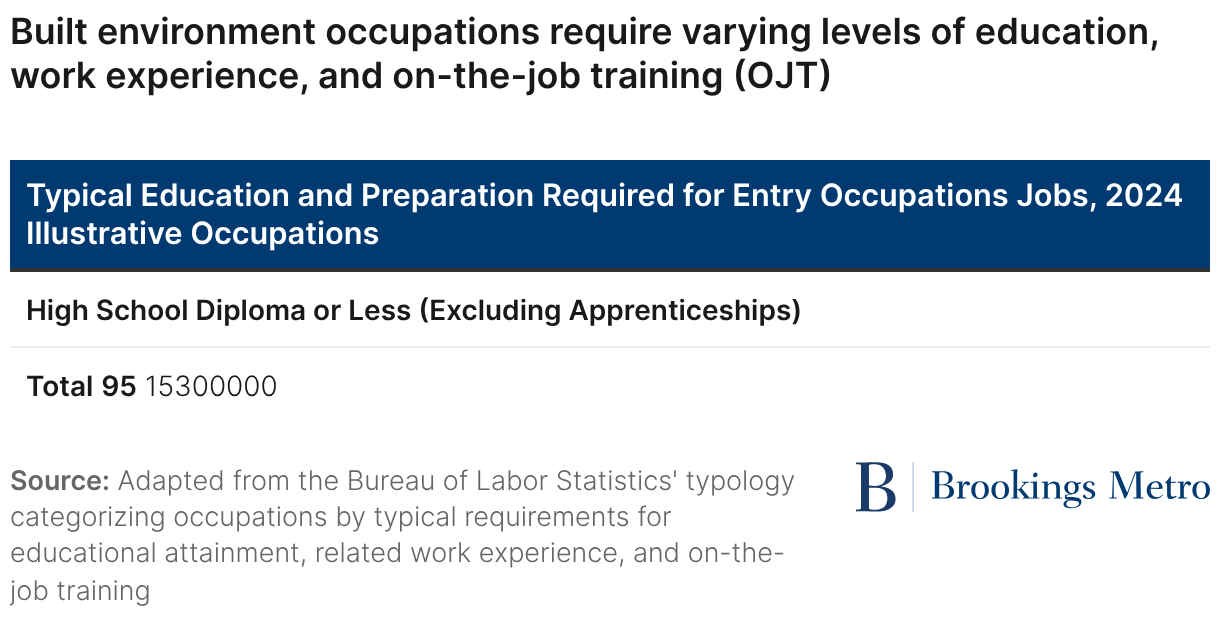
Built environment occupations span the educational continuum and require varying levels of on-the-job training and related experience
Built environment workers carry out a diverse variety of tasks and activities. Not surprisingly, their ability to do their jobs is dependent upon varying levels of education, experience, and on-the-job training (OJT). There is clearly not a one-size-fits all workforce development strategy for the built environment workforce.
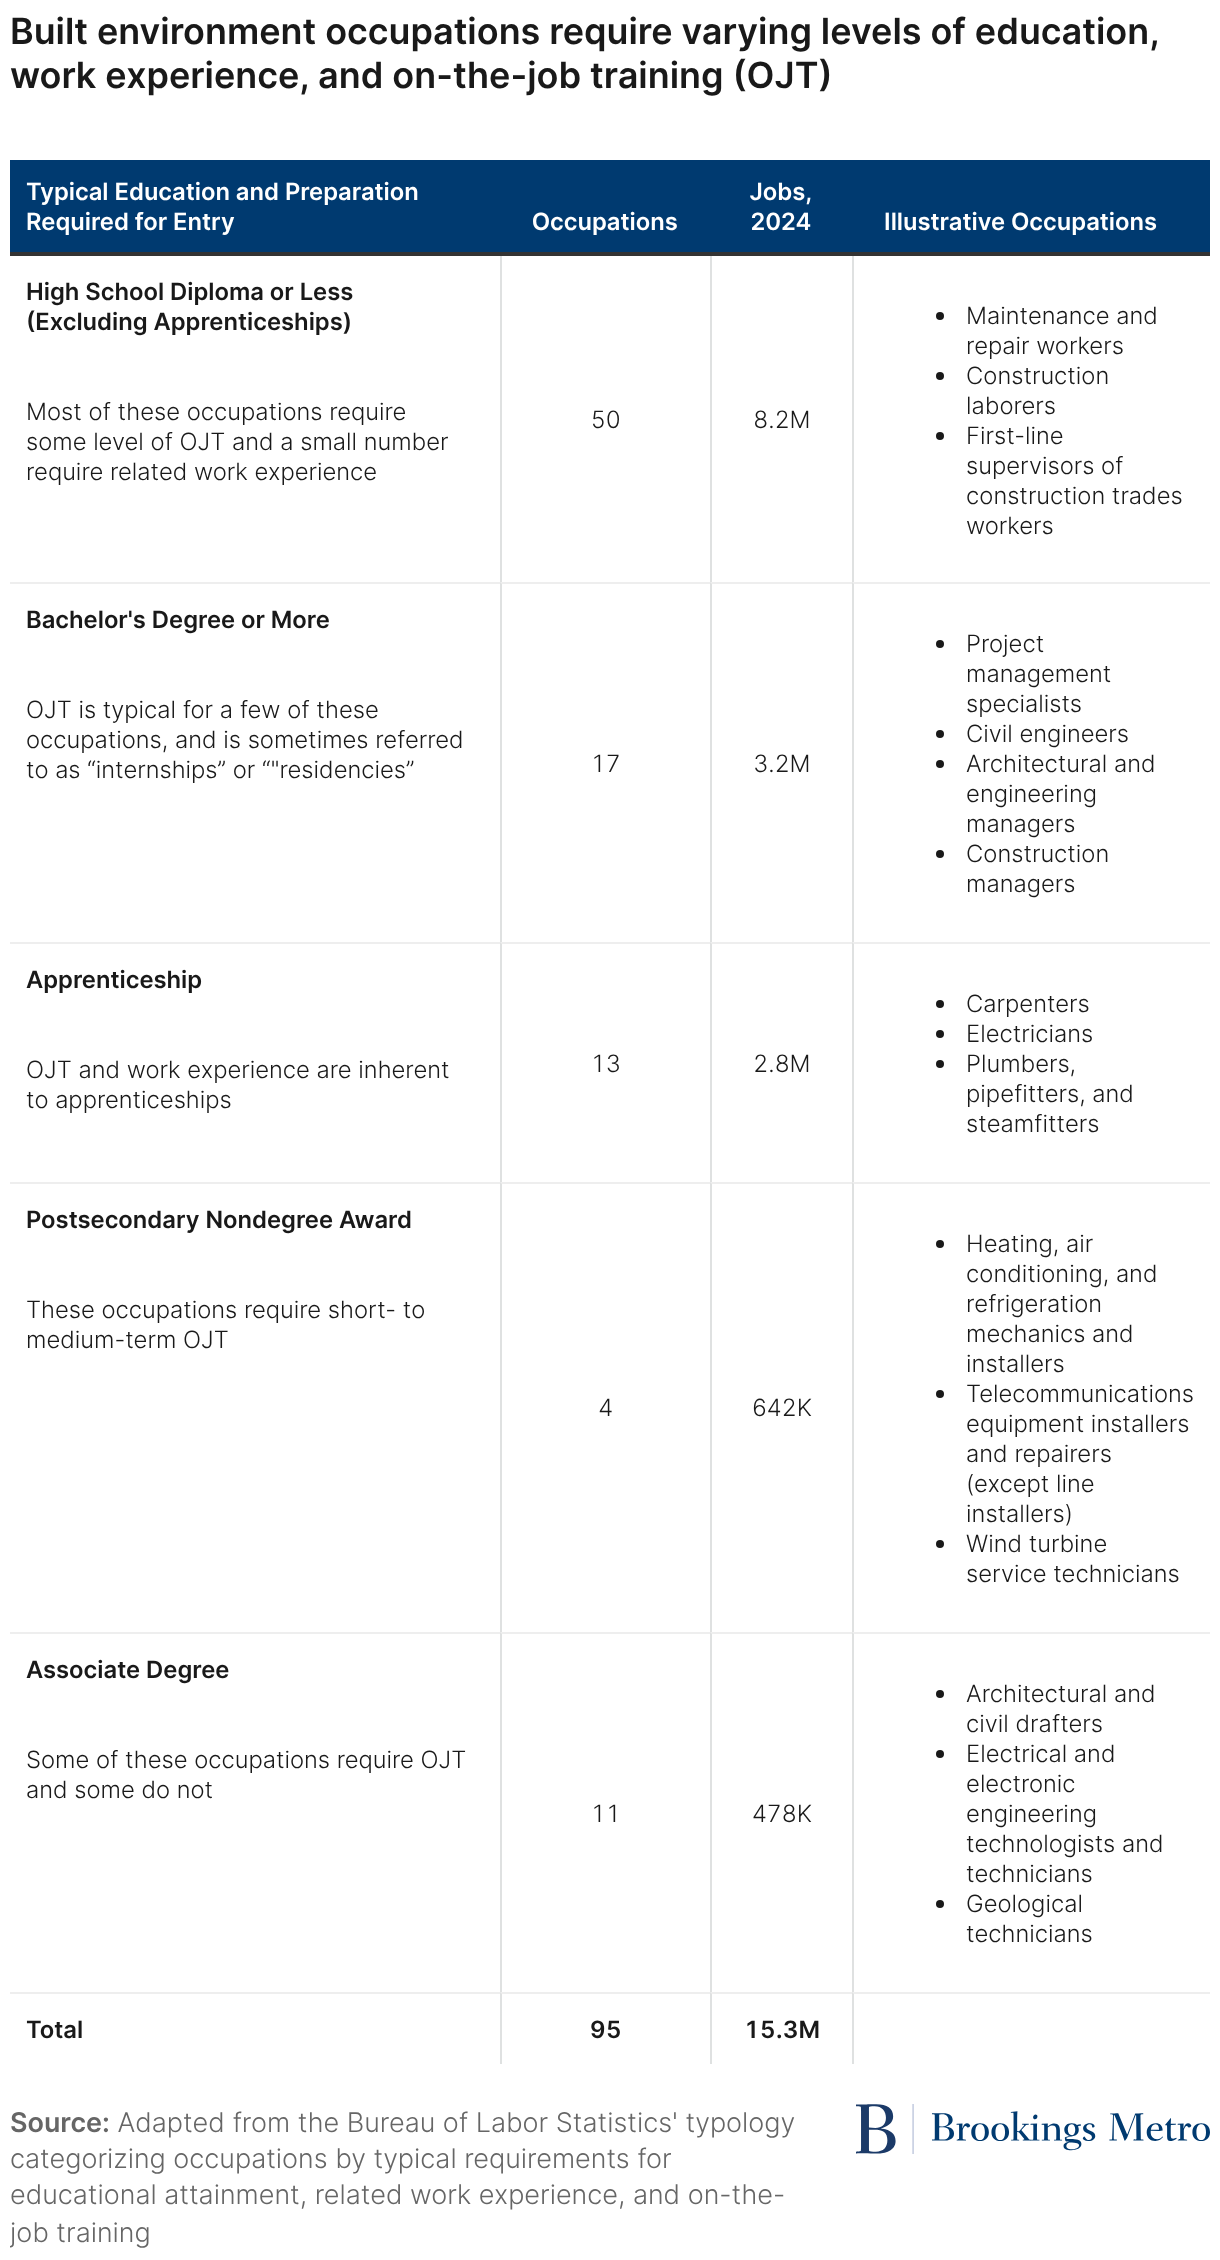
To develop more tailored approaches to specific occupations or groups of occupations, we adapted a typology from the Bureau of Labor Statistics, as shown in Table 5. The adapted typology allows us to categorize and compare the varying education and training experiences typically required for different occupations—a necessary step in developing workforce development approaches that are responsive to occupations with different characteristics and needs.
The largest group of occupations (50), representing more than 8 million jobs, requires a high school diploma or less in terms of formal education. However, qualification for a number of these occupations involves other learning experiences—OJT and work experience—that are important if not as easily measured.
- Work experience is important for front-line supervisors of both construction workers as well as mechanics, installation, and repair workers. Coupled with OJT, work experience is also important for construction and building inspectors, crane operators, earth drillers, and explosives workers.
- On-the-job training lasting more than 12 months is important for mobile heavy equipment mechanics, electrical power line installers and repairers, and telecommunications line installers and repairers.
- Occupations involving no or minimal OJT and work experience include construction laborers, “helpers” related to a variety of construction trades, insulation workers, pipelayers, and carpet installers.
While we have grouped occupations requiring a high school diploma or less into one category for simplicity, the subgroupings by OJT and work experience have implications for workforce strategies. For instance, approaches for occupations requiring work experience may best target incumbent workers rather than new job entrants.
The next largest set of occupations (17), representing more than 3 million jobs, requires a bachelor’s degree or more. These include engineers (civil, mechanical, electrical, and environmental), project management specialists, and interior designers. Occupations in which experience or some level of OJT are important include construction managers and architectural and engineering managers. Occupations described as requiring internships or residencies include architects and surveyors.
Apprenticeships are a well-known and recognized strategy offering paid, structured work-based learning, typically coupled with classroom-based instruction. Occupations with the largest number of workers in this category include electricians, carpenters, and plumbers. BLS designates a number of other occupations as “typically” requiring apprenticeships, including sheet metal workers, structural iron workers, brickmasons, and glaziers. However, the “apprenticeship” designation is not absolute; workers can also prepare for some of these occupations via informal OJT or community colleges and technical schools.
Occupations typically requiring an associate degree or a postsecondary nondegree award (such as a certificate or industry-recognized credential) account for the smallest number of workers (about 1.1 million combined). The occupations with the largest number of workers in this grouping include telecommunications equipment installers and repairers and HVAC mechanics and installers.
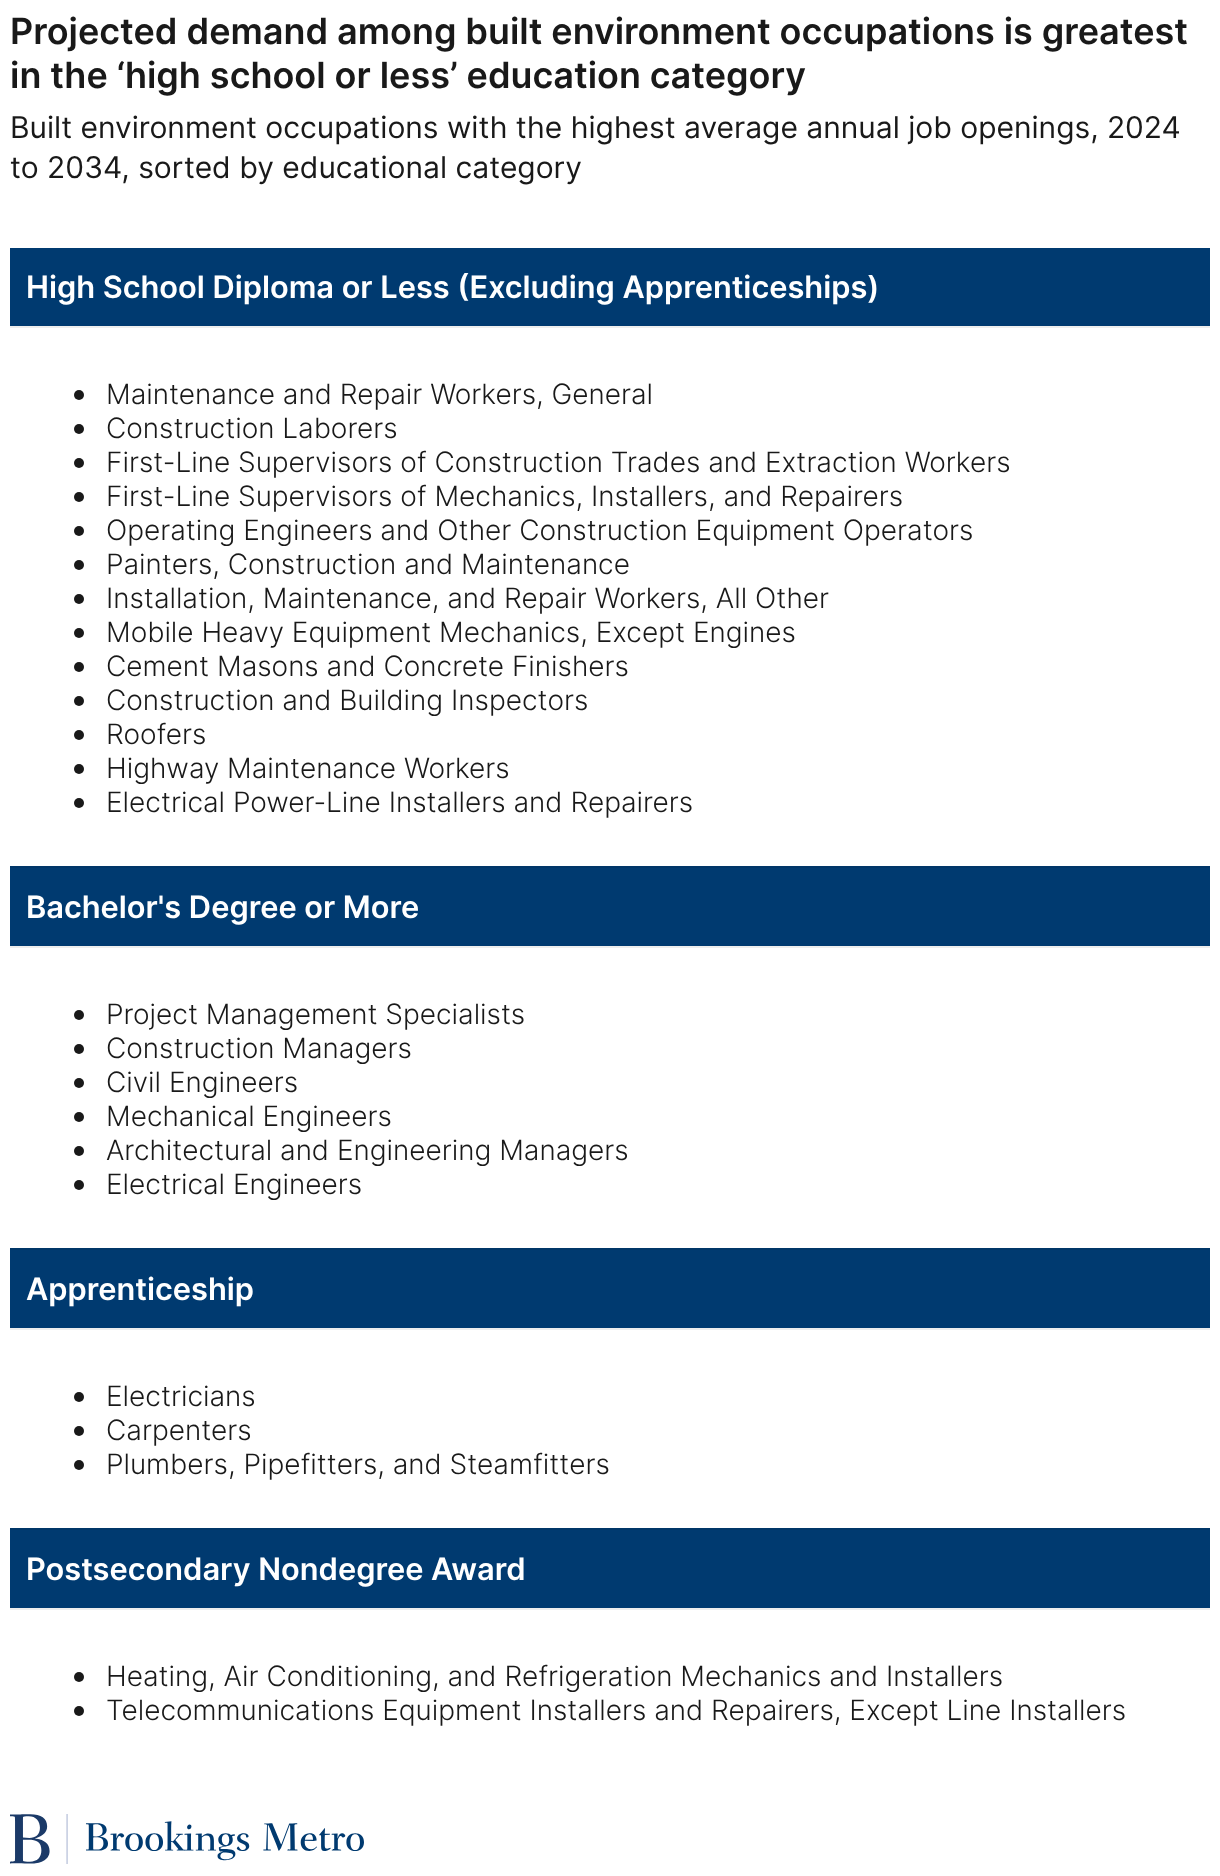
Projected employer demand among built environment occupations is concentrated in a few educational categories: ‘high school or less,’ ‘bachelor’s degree or more,’ and ‘apprenticeship’
We used projected job openings over a 10-year period (2024 to 2034) to estimate built environment occupations most likely to remain in demand by employers. We ranked the 95 built environment occupations by average annual job openings and looked at the top 25%, resulting in a list of 24 high-demand occupations. Among this group, average annual job openings ranged from 13,000 to 175,000 over the 2024 to 2034 period.
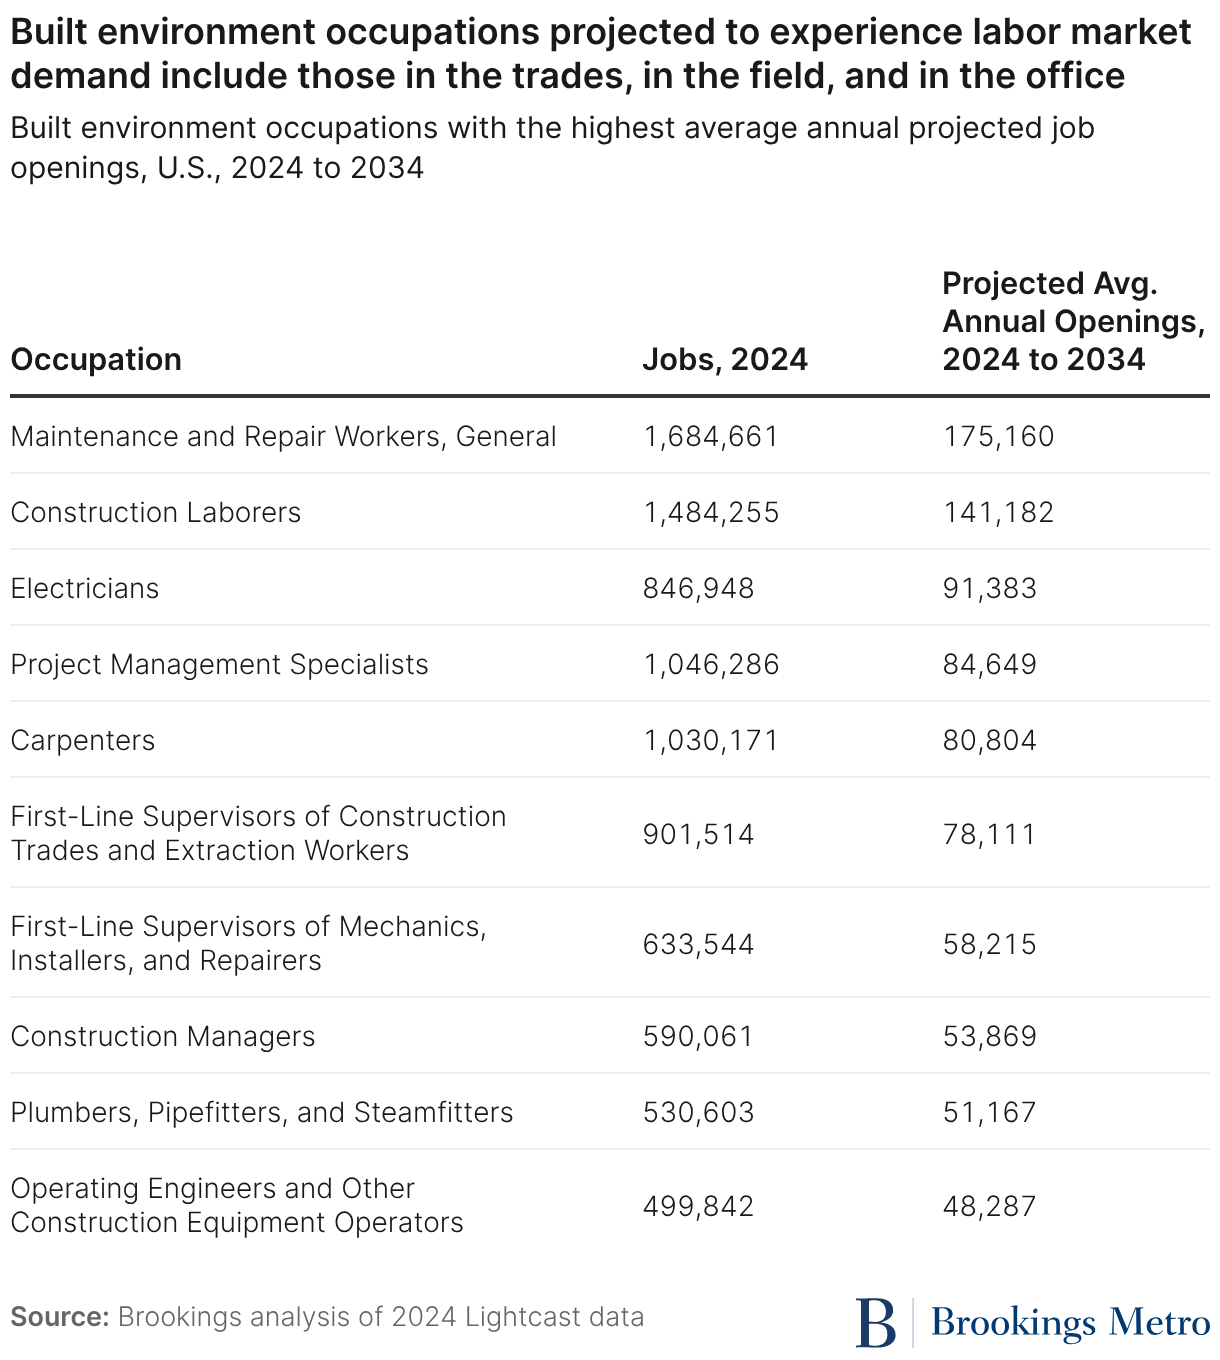
The occupations projected to have the most demand are a diverse group, ranging from field workers in the construction trades to supervisors and officer workers. Most require a high school diploma or less (sometimes paired with OJT, related work experience, or both), and a few require bachelor’s degrees and apprenticeships.
Table 7 shows the list of 24 high-demand occupations sorted by educational preparation. Notably, several of these occupations have high shares of workers over age 55, including construction and building inspectors (44%) and maintenance and repair workers (34%). In several other occupations, about 30% of workers are 55 or older: supervisors of construction workers; supervisors of mechanics, installers, and repairers; construction managers; architectural and engineering managers; and electrical engineers.
Discussion
Built environment occupations are remarkably diverse in terms of educational requirements and career pathways
Many of the 95 built environment occupations are accessible with a high school diploma or less, while others require a four-year degree. Some highly value work experience and OJT for entry and promotion, which is less easily measured than formal educational credentials.
In terms of career pathways into these occupations, some are formal and structured while others are largely undefined. Engineers with a bachelor’s degree and apprentices have the clearest pathways. OJT opportunities for entry-level workers in occupations that require a high school diploma or less are not always easy to find, nor is it always clear what kind of work experience is necessary to move into higher-paying or supervisory positions.
Measuring the supply of workers and employer demand for workers is difficult
For some occupations that are closely tied to formal education and training programs, it is possible to estimate the size of the workforce pipeline. There are data on the number of active apprentices and completions, as well as data on enrollment and graduation by major from colleges and universities. Data can come from the U.S. Department of Labor for apprentices, the U.S. Department of Education for higher education, or from individual apprenticeship programs and colleges.
However, consider the 50 occupations representing 8.2 million workers who have a high school diploma or less, many of whom have gained the necessary skills for their jobs through OJT (formal or informal) or work experience. No organization is charged with tracking OJT, nor how firms assess their incumbent workers to gauge whether they have enough work experience to move to a position with a higher level of responsibility.
Turning to the demand side of the labor market, there is no shortage of labor market data, but they have limitations. The federal and state governments publish employment projections by occupation, but these projections cover a 10-year span and are not designed to reflect current conditions. They are necessarily built on assumptions that may not match conditions on the ground. Assessing unemployment rates by occupation is another method, but that data are most reliable at the national level rather than in states or regions.
Analysis of online job postings can provide real-time insight into employer demand by occupation and skills, but with some caveats. Not all industries or occupations are equally represented in online job postings, instead relying on referrals, informal networks, or union hiring halls. One analysis estimated that 80% to 90% of jobs requiring a bachelor’s degree are posted online, compared to 40% to 60% of jobs requiring a high school diploma.
Surveying employers on whether they have difficulty recruiting and retaining workers for specific occupations can be useful, but the value of such findings rely heavily on how well the survey is designed and how knowledgeable the survey respondents are, including whether they are hiring managers or several layers removed from the recruiting and hiring process. Additionally, survey respondents may have difficulty recruiting workers because they offer low wages or have poor management practices—not because of a shortage of qualified workers.
Lastly, and most related to the built environment workforce, major capital projects funded by federal, state, and local governments are simply not accounted for in labor market information. Public owners could provide estimates of occupational demand over the life of a given project or set of projects, but it is not a regular practice.
Diversity by race/ethnicity, age, and gender is a real concern
The built environment workforce is disproportionately white (64%), especially in higher-paying positions. It is overwhelmingly male (91%). A relatively small share of its workforce is age 24 or under (9%) compared to all occupations (13%).
Long-term demographic shifts will exacerbate these challenges. Overall, the U.S. population is aging: The share of the population age 65 or older increased from 12.4% in 2004 to 18% in 2024, while the share of those under age 18 declined from 25% to 22% over the same period.
Young Americans are more racially and ethnically diverse than previous generations. People of color account for more than half of the under-18 population, which represents the nation’s future talent pool. Employers that are unable to attract and retain a younger, more diverse population of workers will struggle to stay competitive. Expanding the talent pipeline (both by gender and race/ethnicity) is critical.
Recommendations
The built environment field needs to attract younger, more diverse workers, retain the workers it has, and develop a more robust pipeline to managerial and supervisory positions
Through partnerships with K-12 and postsecondary education systems, employers can provide greater exposure to the range of careers in the built environment field. Notably, career exposure activities should start at least in middle school, since interests generated at this point can inform course selection in high school and ultimately decisions about postsecondary education and apprenticeships.
Hands-on, problem-based activities are especially promising for students of all ages. As students work through problems that don’t have a single correct answer, they can learn instructional content and thinking strategies—as well as career options. For example, projects laying out real-world built environment scenarios, such as developing sustainable and functional building systems, require students to think about creating blueprints, delivering water, regulating air temperature, and ensuring energy efficiency. Students learn about occupations they may otherwise not have considered or even known about, such as civil engineers, architects, HVAC technicians, and carpenters. These kinds of experiences can help students can make informed judgements about potential careers and counter negative stereotypes about which kinds of jobs are suitable for “people like me.”
Professional associations and educators should also review how their occupation is perceived publicly, how that affects who is drawn to specific occupations, and whether the occupational and educational culture is welcoming (or perceived to be welcoming) to everyone. For example, a National Academy of Engineering report on engineering education concluded that attracting more women and people of color to the field involves communicating that engineering is not an exclusively technical field of study and that engineers “help define and solve important problems for people and society and make a positive difference in the world.”
On the subject of worker retention, those who complete apprenticeships usually find or retain employment, but not everyone who starts an apprenticeship finishes it. One analysis of construction apprentices found that 40% left before completing, and that women, Black people, and non-union apprentices were disproportionately likely to leave. Another study found that construction apprenticeships have a 53% completion rate. Stemming the premature outflow of workers is a natural complement to more effective recruitment.
Research on interventions to increase community college graduation rates may suggest a promising approach for apprenticeship programs. Community colleges also struggle to retain students, and rigorous evaluations of the Accelerated Study in Academic Programs (ASAP) program developed by the City University of New York found that it increased three-year graduation rates by 16 to 18 percentage points—a nearly unheard-of level of improvement.
A synthesis reviewed other interventions to increase persistence and graduation among community college students and concluded that “short-term, light-touch interventions are typically not enough to substantially improve longer-term outcomes.” The ASAP program, however, offers a comprehensive, integrated set of financial, academic, and support services for up to three years. These include tuition waivers, textbook vouchers, monthly financial incentives, enhanced tutoring, and career counseling. This set of services is similar to the supportive and wraparound services emphasized by the pre-apprenticeship program TradesFutures as a best practice to support program completion and successful placement in a registered apprenticeship program: stipends, emergency funds, tools and equipment, and case management. Oregon is taking a similar approach with its Highway Construction Workforce Development Program, which offers services to apprentices such as work clothes, tools, and funds for emergencies and child care.
However, the broader issue of workplace culture also plays a role in apprentice and worker retention. Harassment and discrimination in the construction industry is well documented, and supportive services to individual apprentices and workers do not directly address this challenge. Of course, there are and have been multiple efforts to make worksites more welcoming to women and people of color (see here for a relatively recent review), but culture change is slow and difficult.
The city of Seattle offers a promising example. It incorporated “Acceptable Work Site” provisions into its public works contracts, requiring contractors to ensure an “appropriate, productive, and safe environment for all workers.” An evaluation of the initiative found that worksite harassment remained fairly common, but that training improved awareness of appropriate work culture and increased the likelihood that workers would take action when they observed inappropriate conduct.
Finally, workforce development efforts related to the built environment and construction fields often focus on entry into pre-apprenticeships and apprenticeships, but this analysis shows that supervisory and management roles are also numerous and projected to show demand.
These more senior positions require related work experience and a different set of skills than front-line or rank-and-file workers. A number of industry reports note that it is critical to invest in incumbent workers, both to prepare them to move up and take on new responsibilities as well as to ensure that those already in such positions have the support and training they need to succeed. One assessment wrote that companies “often neglect to develop on-site leaders who are ensuring projects are completed to exacting standards, on time and on budget,” particularly calling out field supervisors, project managers, and superintendents.
With the retirements of experienced leaders, companies lose valuable institutional knowledge that doesn’t live in manuals and can’t be transferred in an onboarding session. One report recommended that companies move from “reactive hiring to workforce planning,” further noting that companies “underinvest in training and then pay for it through rework, safety incidents, schedule slippage and turnover.” Employers can partner with education and training organizations to develop and deliver curricula tailored to key roles and required skills, treating it as a business imperative and not an optional HR add-on.
Capital asset owners should treat labor market forecasting and workforce planning as core to project planning and development
The built environment workforce develops, operates, and maintains a host of physical assets and systems, such as buildings; transportation, energy, and water systems; public spaces; and more.
Labor availability is a key input to project delivery along with materials and equipment, but workforce demand forecasting is not a routine component of capital and project planning. Without this information it is much harder for workforce actors to accurately understand labor market demand and develop education and training programs accordingly. This in turn means that project owners and contractors have weaker talent pipelines, decreasing the likelihood they will be able to find the workers they need when they need them
As noted by Accelerator for America and WSP, “By the time the need for labor on a specific project comes around, the time to prepare the workforce has already passed. Projects…need time to fill the pipeline with workers who have the required skills.”
Sharing labor market forecasts with workforce development actors is a necessary step to developing a stronger workforce development system. It provides education and training organizations with the information they need to develop programs that are responsive to local labor market conditions. Otherwise, workforce organizations do not have reliable intelligence to inform their programs.
There are several reasons for the lack of routine labor market forecasting. It can be technically difficult, requiring analytic capacity and information on labor hours and occupational patterns from past projects or industry benchmarks that may not be readily available. Since public owners typically contract out so much of their work, they may view labor market issues as the contractor’s responsibility and not fully appreciate the leverage they have in prioritizing workforce development.
The built environment field, perhaps supported by philanthropy, could support the development of publicly available standardized templates to help asset owners calculate labor market demand for specific types of large projects such as transit, highways and bridges, ports, airports, and active transportation. Such templates could be a boon to the field, since otherwise asset owners would have to separately invest in expensive analytic software, add additional staff capacity, or hire consultants who produce reports based on proprietary methods that are not reproducible. This kind of detailed, actionable information could jump-start productive, long-term partnerships between asset owners, employers, and workforce development groups.
Conclusion
The built environment workforce is comprised of a wide range of occupations: traditional construction trades, management and supervisory positions in the field, and “white collar” office jobs. Representing 95 occupations and more than 15 million jobs, this workforce plays a critical role in constructing and maintaining the physical systems and structures that undergird our economy and make day-to-day life possible.
Functioning transportation, energy, communication, and water systems—not to mention safe buildings and public spaces—do not spontaneously generate. They are planned, designed, built, operated, and maintained by workers. Employers, public and private capital asset owners, unions, education and training providers, philanthropy, and others all have a role to play in better developing and supporting this workforce. We all have a stake in their success.
Authors





Downloads
-
Acknowledgements and disclosures
This report was made possible with support from The Brendan & Helen Bechtel Foundation. The findings, interpretations, and conclusions presented here are those of the author(s) alone and do not necessarily reflect the views or opinions of the Foundation, its staff, or its board.
The authors thank the many national experts and local industry, workforce, and education leaders whose insights and expertise helped inform our work. They also thank colleagues Adie Tomer and Priyanka Robinson and former interns Riley Guggenhime and Shannon DeFranza for their many contributions.
The Brookings Institution is committed to quality, independence, and impact.
We are supported by a diverse array of funders. In line with our values and policies, each Brookings publication represents the sole views of its author(s).