High and rising college “sticker prices” get a lot of attention. Although the amount that students actually need to pay after accounting for financial aid has not increased as much as sticker prices over the past few decades, students attending both public and private four-year institutions from both higher- and lower-income families still face higher “net prices” now than in the past. How have families covered those larger bills? And how does that differ by family income?
Families can pay the higher net price in a few ways: Parents can use their current income and savings; parents and students can borrow; and students may use earnings from employment while in school or during the summer to help pay for college. This analysis examines which of these funding sources families use to pay rising net college prices and how that differs depending on income. I focus on dependent students who attend a four-year college living away from their parents.
The results indicate that families used several approaches:
- Parents, especially those with middle and higher incomes, used more of their own income and savings.
- Middle- and higher-income parents borrowed more.
- Students from lower-income families worked more.
- Students themselves largely did not borrow more, regardless of family income.
These findings are not surprising considering the constraints different families face. Lower-income families typically do not have the ability to contribute more from their income or savings to pay for college. Parents in these families would likely be reluctant to take on additional debt and may have difficulty obtaining it anyway. Borrowing by students may be constrained by the limit on how much undergraduates can borrow through the federal student loan program. Working more may be the main viable alternative for them.
Higher-income families may have a greater capacity to help pay the higher bills from income or savings, and the parents have more access to loans. Regardless of the form of payment used to cover increasing net prices, all represent additional hardships that families face now when their children attend college.
What options do families have to pay for higher net prices?
This report builds on an earlier analysis, where I detailed how net prices have changed for students attending four-year public (for state residents) and private (nonprofit only) colleges and universities. The results show that increases in the sticker price vastly overstate the increase in net prices that families face, but that families across the income distribution do pay more now than they have over the past few decades—just not as much more as the headline-grabbing sticker prices would suggest.1
That analysis raises the question of how families paid those net price increases. Paying for college was difficult for families in the 1990s. Covering higher net prices would be even harder. How did they adjust?
There are not many options for families to cover the increases. They can pay more out of their current income or dip further into their savings. Taking out a home equity loan or borrowing from a retirement account similarly relies on available assets. Any of these steps may be difficult, particularly for lower-income families with less access to such funds.
Students and/or their parents may also take on greater education-related debt. The federal government offers loans to students through the federal Direct Student Loan and Parent PLUS loan programs. Federal student loans are currently limited in value to $5,500, $6,500, and $7,500 in a student’s first year, second year, and subsequent years of college, respectively. These limits went into effect in 2008. Between 1993 and 2007, the relevant limits were $2,625, $3,500, and $5,500 for these groups, respectively (an interim increase occurred in 2007).
The Parent PLUS program can provide more funding to parents of college students. Parents can borrow up to the full net price that their child is asked to pay. They may be reluctant to take on additional debt, though, and those loans are subject to credit approval, reducing access for lower-income families.
Students can also contribute additional resources. They can work and use their earnings to help pay their college expenses. In theory, they could also use their own savings and assets, but the number of students with meaningful levels of these additional resources is small. The same is true with contributions from other relatives and friends. These last two potential funding sources are omitted from this analysis.
Since 2008, Sallie Mae has surveyed families about how they pay for college. The results are helpful to understand families’ spending at a point in time, but it would be difficult to use these reports to track changes over time for families at different levels of income.2 The general pattern of payment methods across families at different income levels, though, is roughly consistent with those reported in this analysis below.
How are payment methods measured and compared?
For this analysis, I use data on payment methods from the 1995-1996, 2007-2008, and 2019-2020 waves of the National Postsecondary Student Aid Study (NPSAS). These data include information from a large sample of college students (with sample weights provided to generate nationally representative estimates) including family finances, college net prices, and payment methods.
The specific payment methods I examine are identified in different ways. Both student and parent loan data are obtained directly from the colleges the students attend. Employment and earnings data are collected in surveys completed by students. Unfortunately, the questions asked in these surveys changed in the last wave; these data are not comparable to the earlier waves.3 To avoid confusion, I do not use those more recent data. Payments made from income and savings (which could include the proceeds of home equity loans or retirement savings) are calculated as a residual, subtracting all loan payments and student earnings from net prices paid, which were described in my earlier analysis. In 2019-2020, this residual category represents payments from income and savings along with student earnings because of the data limitations just described.
This analysis focuses on dependent students enrolled full-time living away from their parents. I distinguish state residents attending four-year public institutions from those attending four-year private, nonprofit institutions (referred to simply as public and private institutions going forward). All dollar values are inflation adjusted and represent the price level in 2023.
The appendix to this report provides greater details regarding the methodology I used. Throughout the analysis, I estimate average payments from each source for families with incomes of less than $50,000, $100,000, and $150,000, assuming typical asset holdings for families with those income levels. I also include the $200,000 income level at private institutions, omitting public institutions because too few of their students with higher income levels are available in the data.
How have families covered rising net prices?
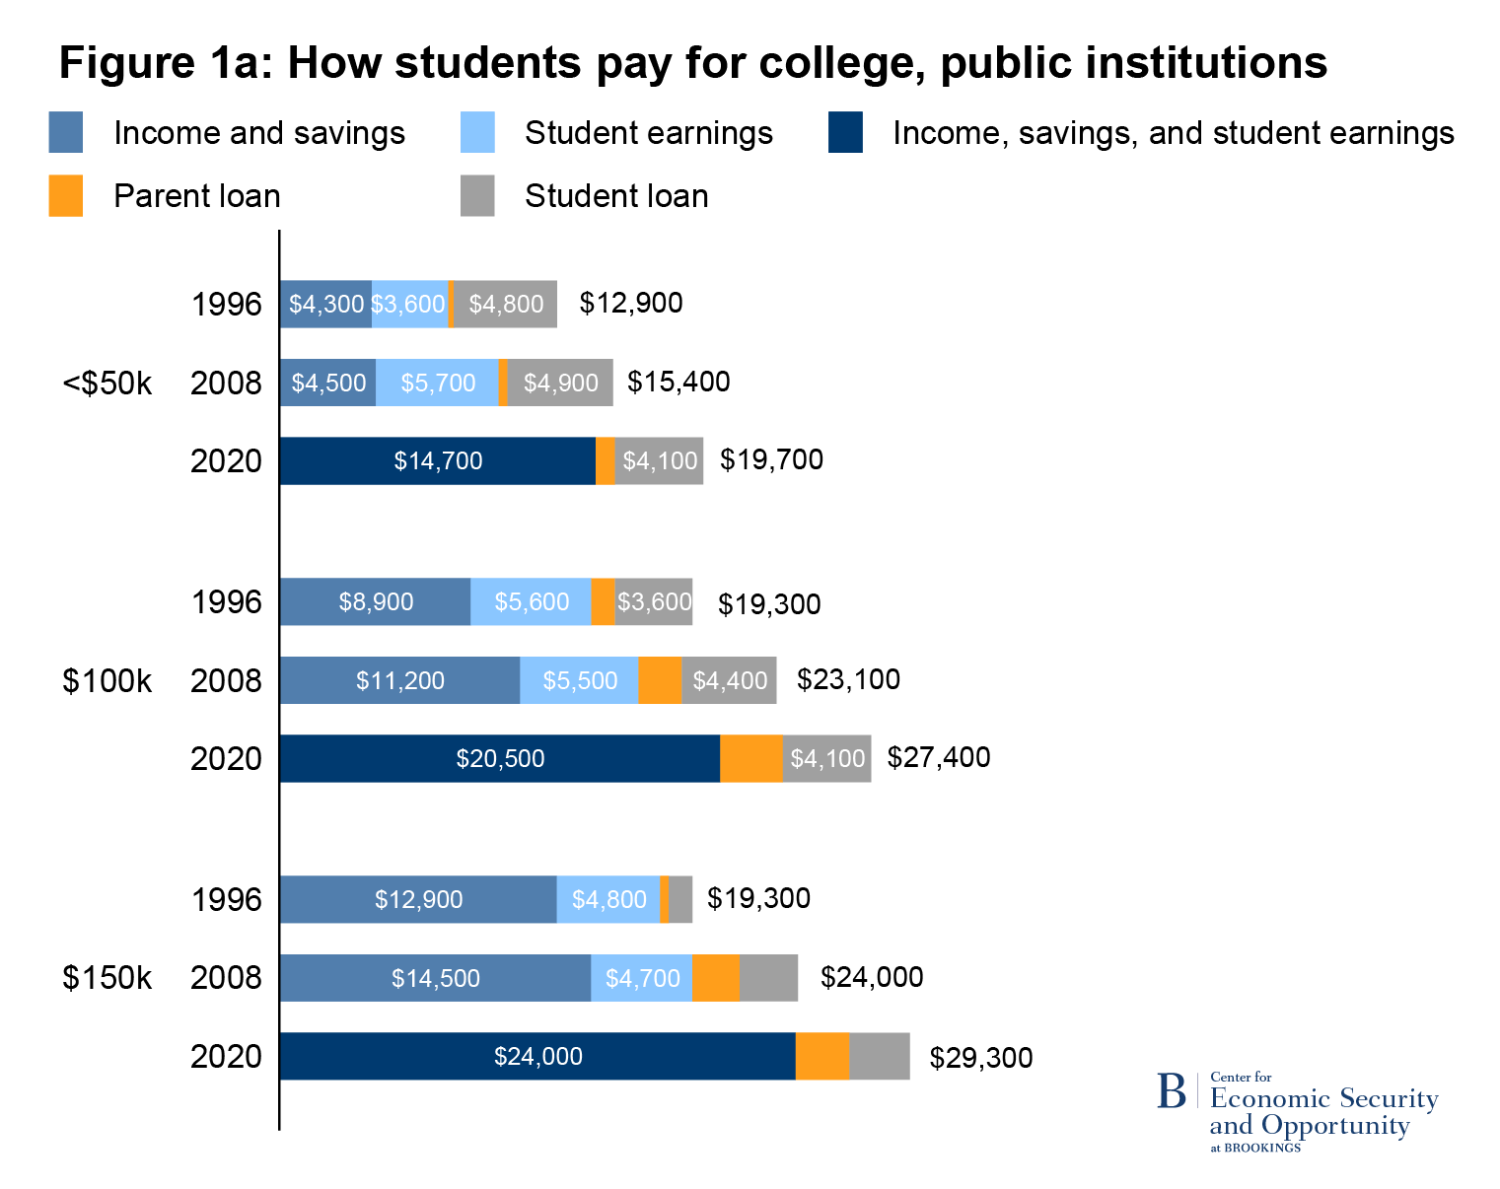
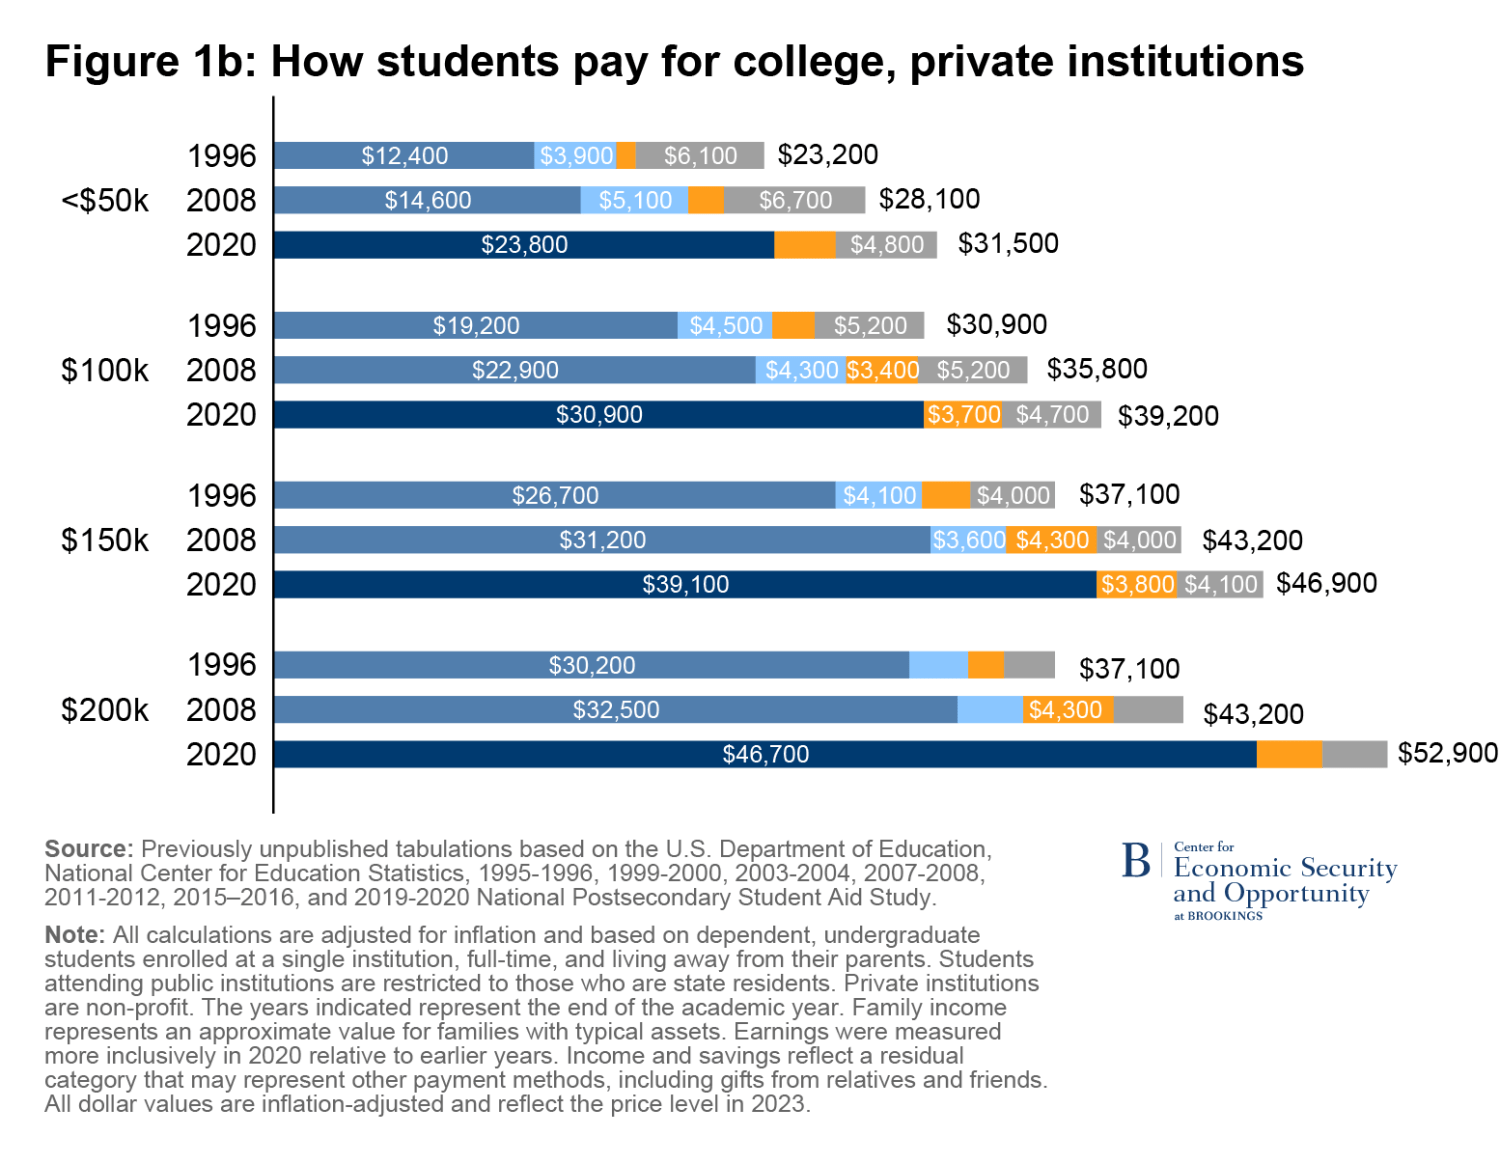
Figures 1a and 1b show how families paid for college over time. A few patterns emerge. First, the average net prices (the total width of the bars) increased with family income in each year, and it increased over time at every income. This finding is consistent with my earlier report.4 In each year and across income levels, net prices are higher at private compared to public institutions. Families met that higher net price with larger contributions from income and savings (and possibly student earnings in 2019-2020).
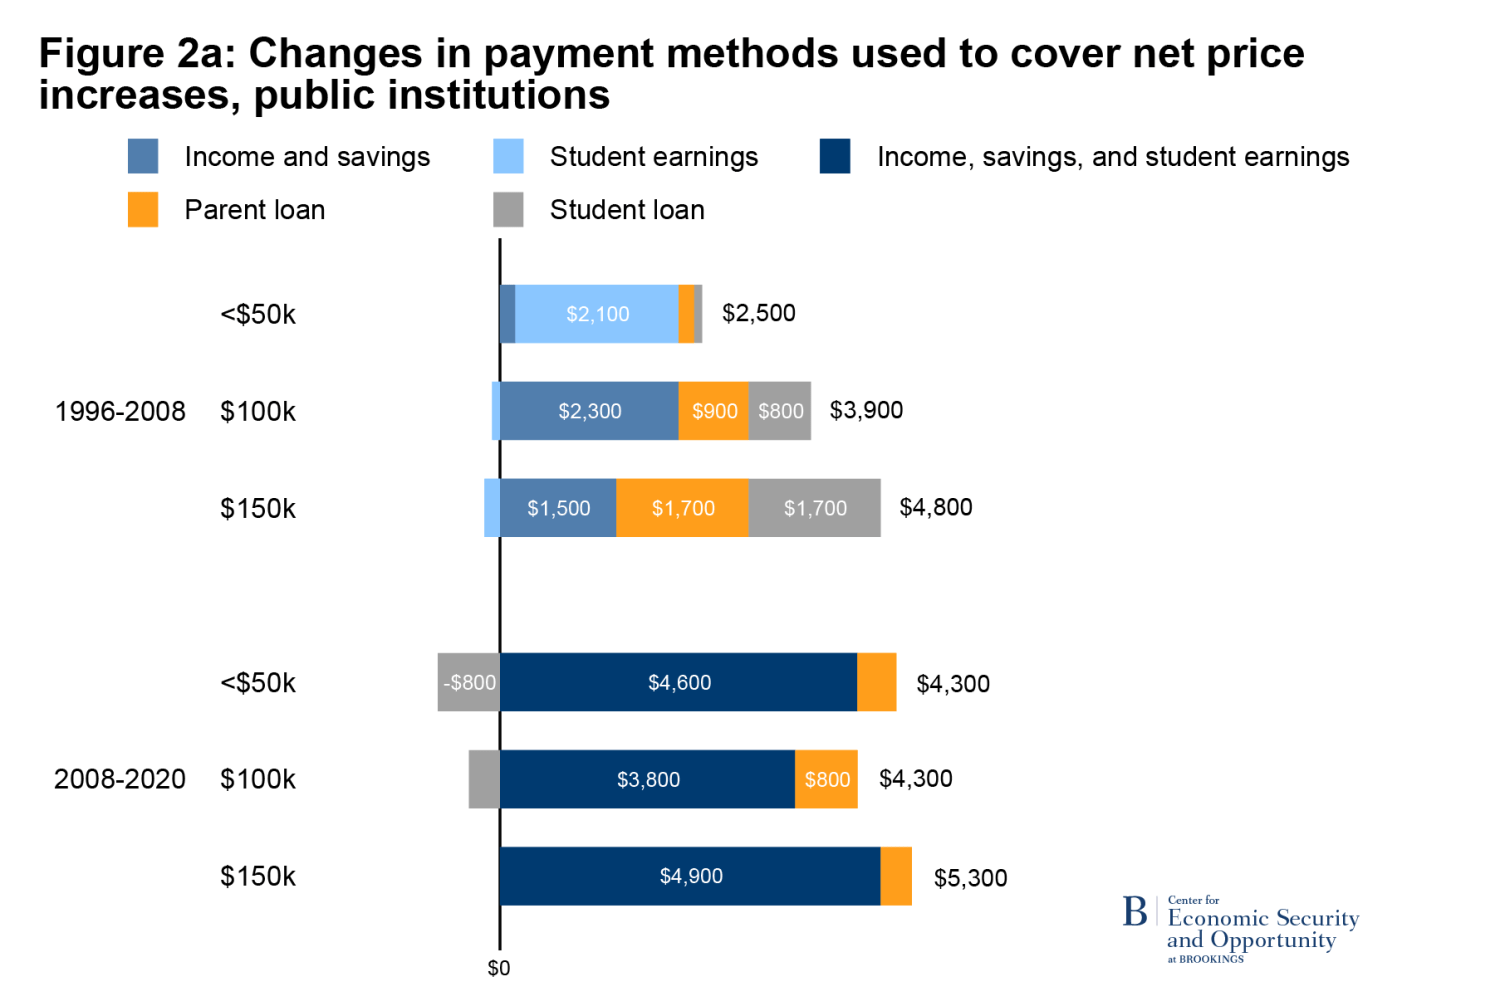
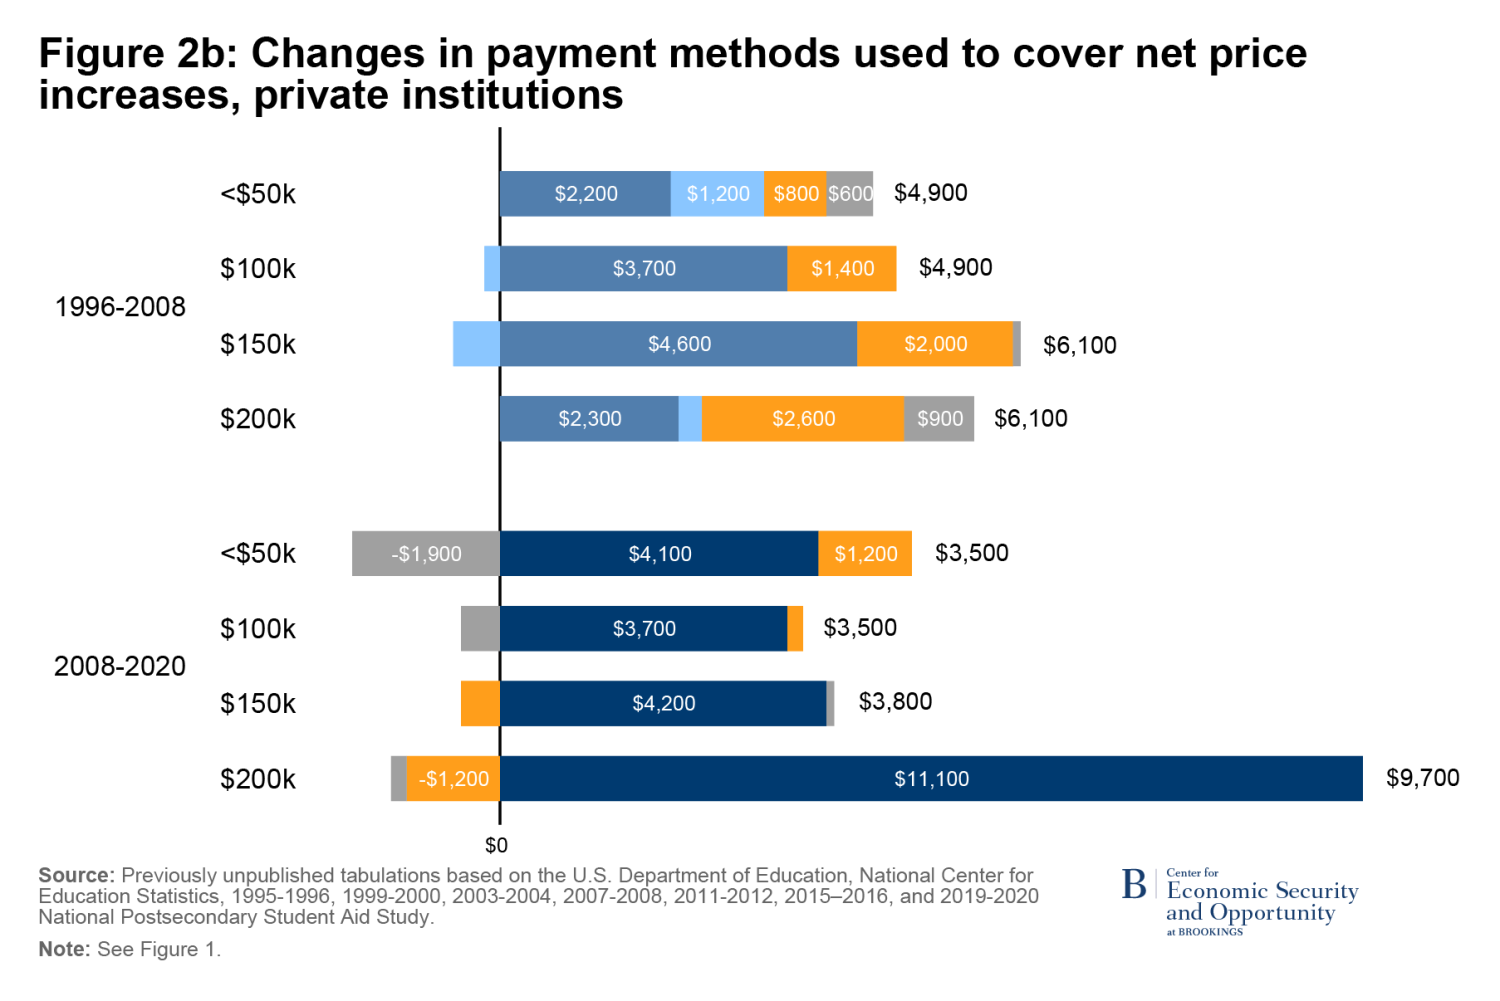
Figures 2a and 2b show the changes in how families paid for college over time along with associated changes in average net prices by level of family income. The top panel presents changes between 1995-1996 and 2007-2008. For lower-income families (incomes of $50,000 or less), net prices rose by roughly $2,500 and $4,900 at public and private institutions, respectively.
These families covered much of this increase with additional contributions from student earnings, particularly for those students attending public institutions. For them, greater earnings covered $2,100 of the $2,500 net price increase. As documented in the appendix, these students also worked more. Those from families earning less than $50,000 enrolled at public institutions were six percentage points more likely to work at all. For those students who worked, they worked around 2.5 additional hours per week during the school year over this period at both types of institutions, reaching 20 hours or more per week in 2007-2008. At private institutions, additional payments from family income and savings also covered a substantial share of the increased net price.
There is some evidence that lower-income parents whose children attended private institutions increased their borrowing slightly over time. In general, though, lower-income parents’ ability to borrow is often limited due to a reduced willingness to take on additional debt and weaker credit scores. Lower-income students did not increase their use of student loans much over this period. It is common for students who rely on debt to borrow the maximum allowed. Over this period, loan limits were increased roughly in line with inflation, so students could borrow around the same amount in inflation-adjusted terms.
For middle- and higher-income families, parents absorbed much of the net price increase themselves over this period.5 Payments from income and savings jumped by between $1,500 to $4,600, depending on family income and type of institution. Parents were also more likely than students to access education loans. They increased their borrowing by almost $1,000 to over $2,000. Student earnings changed very little. Students from higher-income families also borrowed more themselves.
The lower panels of Figures 2a and 2b present analogous information for changes in payment methods between the 2007-2008 and 2019-2020 academic years. Unfortunately, I cannot separate student earnings from parental contributions in the most recent year, but these data along with lessons from the earlier period still yield important insights.
In terms of borrowing, the most notable feature for lower-income students is the reduction in student loans, particularly for those enrolled at private institutions. Those students borrowed $1,900 less, on average, in 2019-2020 compared to 2007-2008. This decline is partly attributable to a nine percentage point drop in the number of students who borrowed. For those who have borrowed in both periods, the amount borrowed dropped by $600 (as shown in the appendix). Over this period, the maximum federal student loan was fixed in nominal dollars, eroding over time in inflation-adjusted terms. That likely contributed to the lower amount borrowed. Perhaps the negative publicity surrounding the student loan crisis also led students to be more reluctant to borrow. Borrowing also fell at public institutions but by a smaller amount.
If additional student borrowing doesn’t fill in the gap of rising net prices for lower-income students, those funds need to be made up someplace else. Across the income distribution, the vast majority of the gap over this period was filled in with students’ earnings and parents’ income and savings. Again, I am not able to disentangle these factors over this period, but my suspicion is that earnings was the major contributing factor for lower-income students. Their parents do not have unlimited funds to help pay the bills and increased student earnings played a prominent role in filling the payment gap in the earlier period. Again, based on the evidence from the earlier period, one could infer that income and savings played the dominant role for middle- and higher-income families. Parental loans played a minimal role in covering the increased costs.6
Interpreting the findings
The results presented here indicate that greater student borrowing largely has not filled in the affordability gap associated with rising net prices at four-year colleges. More higher-income students at public institutions are now taking out student loans than before, but even that trend stopped earlier in this period. Beyond that group, there is little evidence that students are borrowing more. This stands in contrast with the recent attention to the student debt crisis. Student loans are growing more broadly, but that increase is mostly generated by students at for-profit institutions, community colleges, and in graduate degree programs.
Parent borrowing, on the other hand, became more common, particularly in the earlier period and among middle- and higher-income families. This makes sense because lower-income families may be reluctant to take on more debt and may be unable to do so if they are less likely to be deemed creditworthy. Still, even for these middle- and higher-income families, the increase in parental loans is relatively small compared to the change in the net price of college that families need to pay.
Student earnings played a meaningful role in covering higher net prices among lower-income students in the earlier period, but we cannot say what happened to earnings in the later period due to data limitations. These students worked more hours per week to help pay higher college net prices. By 2008, three-quarters of them are already working; those who worked averaged 20 or more hours per week. At some point, working “too much” means not getting schoolwork done, which may affect subsequent educational outcomes.
Lower-income families have limited sources of alternative funding. The parents may be having difficulty getting by in the first place. There just isn’t a lot left over after they pay their rent and food bills, and they have limited assets to draw from. They simply cannot afford to contribute more to their children’s education.
For middle- and upper-income families, on the other hand, additional payments from family income and savings covered most of the additional net price of college. These larger payments could harm these families’ longer-term financial stability. According to the most recent data, these parents pay roughly an additional $5,000 to $10,000 per year for college per year compared to the mid-1990s. For families with two children who will attend college for four years each, that represents $40,000 to $80,000.
Although larger college payments are not appealing to children and families regardless of income, students from lower-income families face the greatest hardship associated with rising college net prices. They may not be able to attend an institution that best fits their capabilities or they may not attend college at all. Such an outcome would undermine the goal of economic opportunity for all.
Middle- and higher-income parents may face less severe, but still meaningful, consequences. If they deplete their assets or save less, they may not be able to retire until they are older and/or face diminished retirement incomes. The potential impact on their retirement security may generate other social consequences.
Overall, increases in college net prices are painful for students and families across much of the income distribution, albeit in different ways. COVID-19 and the resulting bout of inflation had the effect of lowering college net prices (after correcting for inflation), but the upward march is likely to resume. Finding ways to limit the damage, particularly for students from lower-income families, is essential if we are to maximize the value of our higher education system.
-
Acknowledgements and disclosures
The Brookings Institution is financed through the support of a diverse array of foundations, corporations, governments, individuals, as well as an endowment. A list of donors can be found in our annual reports published online here. The findings, interpretations, and conclusions in this report are solely those of its author(s) and are not influenced by any donation.
-
Footnotes
- A different recent report provides an analysis indicating that the average net tuition price across post-secondary education has not changed very much since 1993. There are important differences between that analysis and the net price data I examine in this study. First, net prices include the total cost of attending college, including living expenses, not just tuition and fees. Financial aid is awarded based on the difference between those total costs and some measure of ability to pay. For dependent students living away from their parents at four-year institutions (the focus of this analysis), that is the appropriate measure of college costs. Aside from the different measure of net price, that study considers a much broader range of students (independent as well as dependent) and degree programs (including associate’s and graduate degrees). The estimates there also suggest that the average net price of college for students seeking a bachelor’s degree has increased, but not as much as the sticker price.
- Data are reported by family income level, but those levels are in categories, which are not adjusted for inflation over time.
- The revisions focus on collecting more comprehensive data (i.e. earnings in job 1, job 2, …, rather than a single question inquiring about total earnings during the past year). As a result, more recent earnings data are somewhat higher than they would have been using the earlier, less comprehensive approach.
- Note that in my earlier report, the results indicated that lower-income families at private institutions did not face much of a change in net price in the years following 2007-2008. The difference between these analyses is that this one is based on average net prices whereas the earlier one relied on median net prices. Tracking median net prices is likely a better approach, but medians have the disadvantage that they cannot be added. In this analysis, the sum of the average payment methods have to total the overall increase in the net price, preventing the use of medians.
- This analysis devotes little attention to families at “high” income levels because there are relatively few of them in the data. I use the term “higher-income” families to acknowledge that those with incomes in, say, the $150,000 to $200,000 range are considerably higher than the median, but they still face meaningful constraints in paying for college.
- These results on borrowing are roughly consistent with those reported in a recent Brookings report. That study uses different income categories and focuses on the entire period between 1993 and 2020, combining student and parent loans. The author describes dramatic increases in borrowing over the full time period at all income levels. If student and parent borrowing are combined in this study and compared to changes in borrowing over the two separate time periods reported in the previous study, the patterns are broadly similar (taking into account differences in distinguishing income levels).
The Brookings Institution is committed to quality, independence, and impact.
We are supported by a diverse array of funders. In line with our values and policies, each Brookings publication represents the sole views of its author(s).


