Figure 13 was updated to remove 1450 Washington Blvd. and 1351 Washington Blvd. Neither building is an office-to-residential conversion.
This publication is part of a broader series examining the potential of office-to-residential conversions across six U.S. case studies. The project is part of a cooperative agreement with the US Department of Housing and Urban Development, and the research team is composed of contributors from Gensler, HR&A Advisors, Brookings, and Eckholm Studios.
In the 1960s, Stamford, Conn. demolished and rebuilt its old downtown, the remnants of its manufacturing base giving way to white-collar corporate headquarters fleeing Manhattan. Over the last several decades, its small population has grown significantly, with the city making up 40% of Connecticut’s population growth between 2000 and 2020. Unlike similar cities in the region, Stamford has allowed for significant development of multifamily housing. Today, its commercial core is roughly evenly split between housing and offices, and the city has recently become majority-renter, with most of its housing units in multifamily buildings.
Demand for office space has declined, especially since the COVID-19 pandemic. The city’s combination of large, older office parks with high vacancy, demand outstripping residential supply, and the broader regional context of a housing crisis makes office-to-residential conversions extremely attractive. Indeed, despite no significant government incentives, seven such projects have gone ahead since 2020. Yet opposition from suburban homeowners to multifamily housing—and a bevy of legal, political, and administrative tools to fight conversion projects—continue to hold back the city’s residential potential. Affordable housing is a particularly vital need considering the high share of housing-cost-burdened households in the area.
Stamford history and context
The city of Stamford’s modern roots date to a 1640 deed signed by the thumbprints of members of the Siwanoy tribe and Captain Nathaniel Turner, then the head of the New Haven English Colony. Occupying a strategic waterfront position proximate to New York City and on the route to Boston, Stamford was first connected to New York City by commuter rail in 1848. Stamford’s downtown evolved into a manufacturing hub, and throughout the late 19th and early 20th centuries, Stamford was known as “Lock City,” as a fourth of its residents were employed by the Yale and Towne Lock Company.
Today, Stamford is home to a cluster of white-collar corporate headquarters, many of which moved to Stamford from Manhattan, located only one Metro-North express stop away. Stamford began to attract corporate headquarters in the 1960s, when it undertook a major urban renewal development effort, demolishing its old downtown and replacing it with a mall and office buildings. Stamford bet that it could lure companies from New York City with the promise of cheaper and more flexible office space, and a ready supply of executives residing in wealthy, neighboring residential communities such as Darien and Greenwich.
Stamford is now home to companies ranging from World Wrestling Entertainment to seven Fortune 1000 members, including Charter Communications, Pitney Bowes, and United Rentals. Its core industries are white-collar services such as education, health care, and professional, scientific, management, and administrative services. There are 380 office buildings in the city, containing 19.9 million square feet of space, which is enough space for every man, woman, and child who lives in Stamford to have a ~200 square foot office.1 This is a remarkable amount of inventory considering that Stamford is in the same metropolitan area as the largest city in Connecticut, Bridgeport—a city that is 9% bigger than Stamford by residential population but contains 75% less office space.2
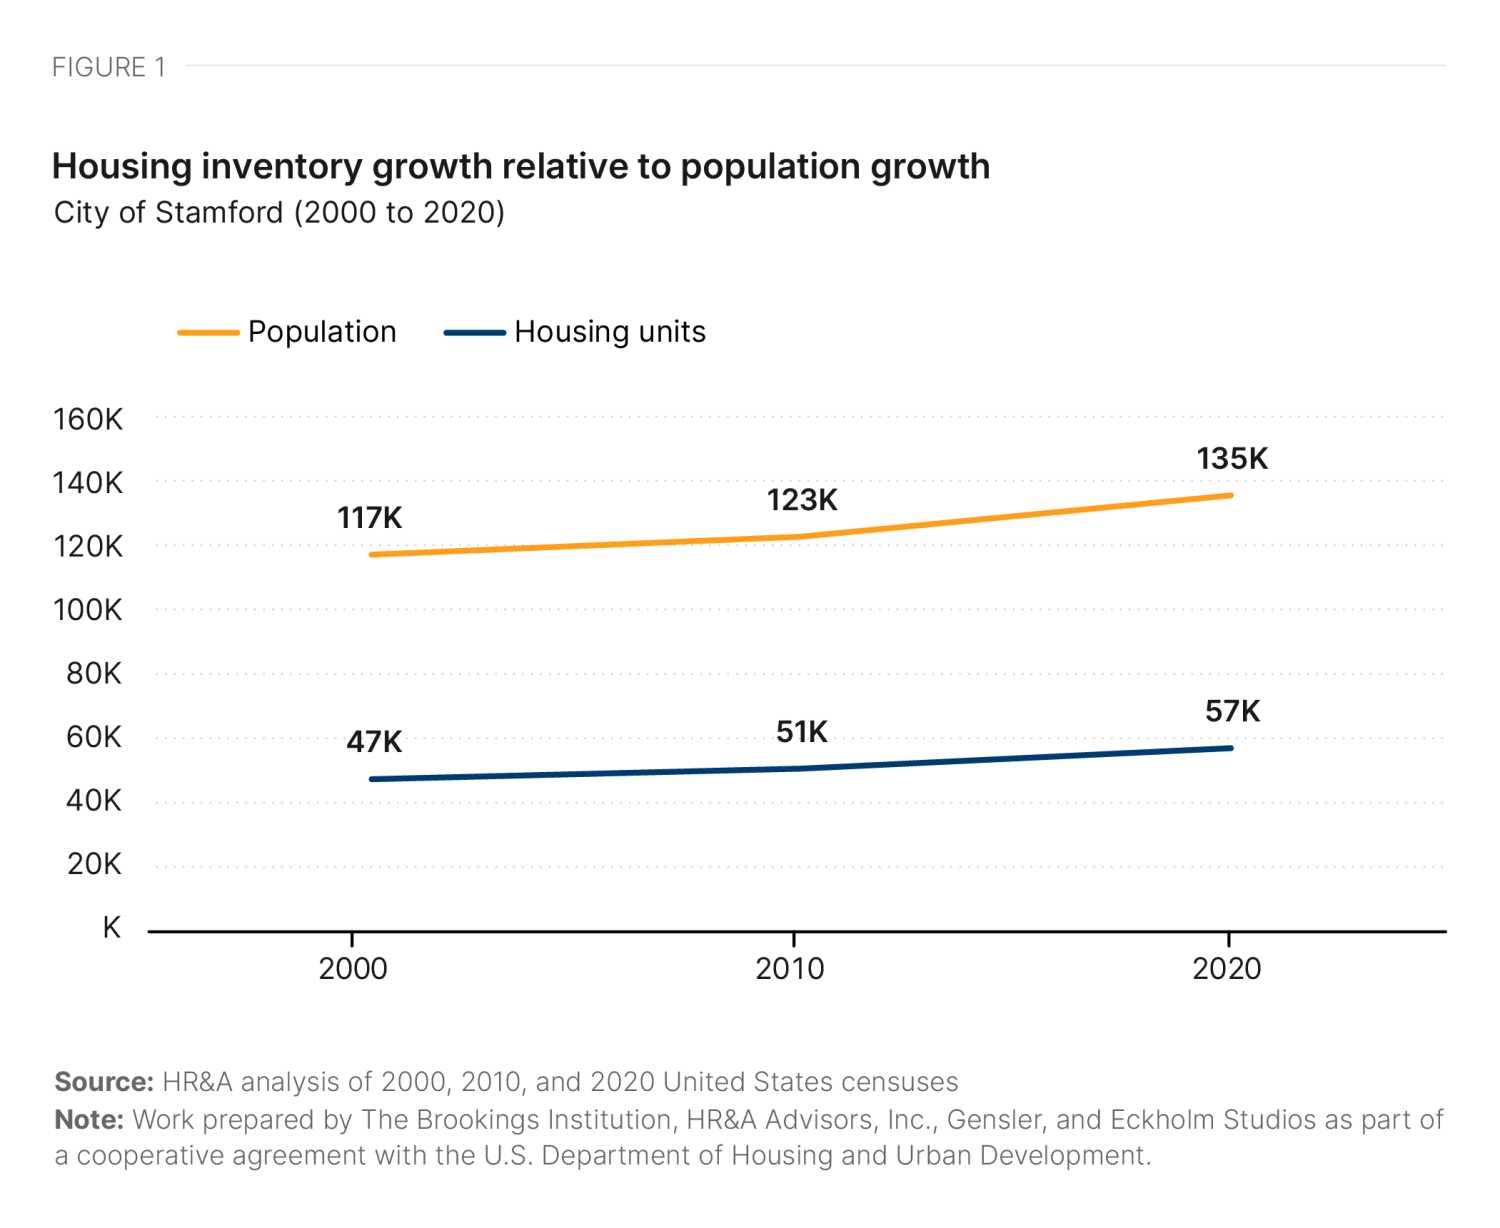
The residential population of Stamford remains relatively small, at approximately 136,000 people. However, residential demand has boomed in the last 20 years. Stamford grew by 18,000 residents between 2000 and 2020, with the majority of that growth occurring between 2010 and 2020 (Figure 1). This growth corresponds to 40% of the entire state’s population growth between 2010 and 2020. As the tri-state area regional housing shortage has grown more acute, Stamford is one of the only coastal Connecticut cities that has allowed for some new multifamily housing development, with the addition of 9,600 housing units since 2000.3
Today, Stamford incorporates characteristic features of a city such as highly accessible industrial facilities, high-rise offices, and multifamily properties, alongside typical suburban single-family zoning (which still covers 82.4% of the city’s land). The city is activated with 14 public and private marinas, a boardwalk, and multiple parks, including sandy beaches at Cove Island Park.
Stamford has the second-largest grand list (property tax base) by assessed value in the state of Connecticut, after Greenwich. The aggregate Stamford property tax base is stronger than ever, having grown 14.9% in real terms between 2012 and 2022. While commercial real estate (office and retail) value on the grand list has declined 10.3% over that period, residential growth (both existing value and new product) has more than made up for these losses. In particular, multifamily housing has become a critical component of Stamford’s tax base, growing from 6.5% of the taxable grand list in 2012 to 14.1% in 2022.
Downtown footprint and demand
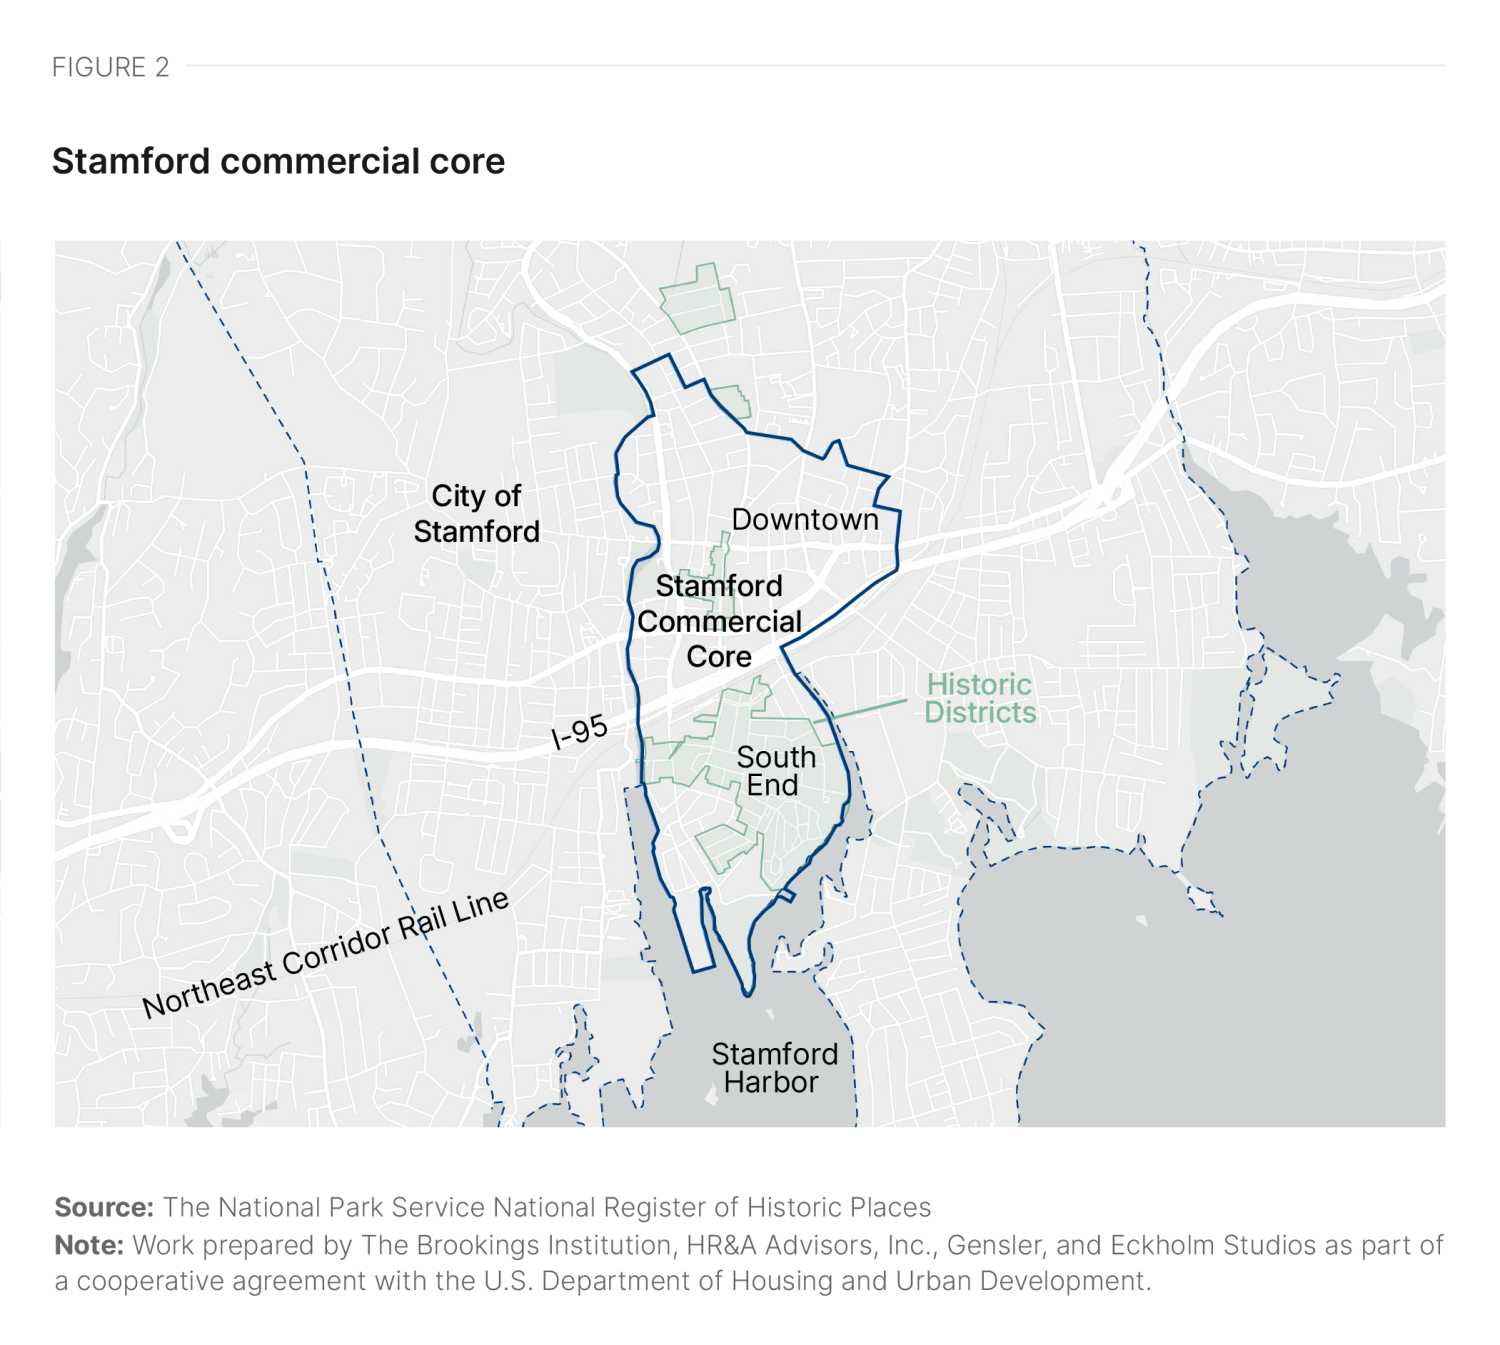
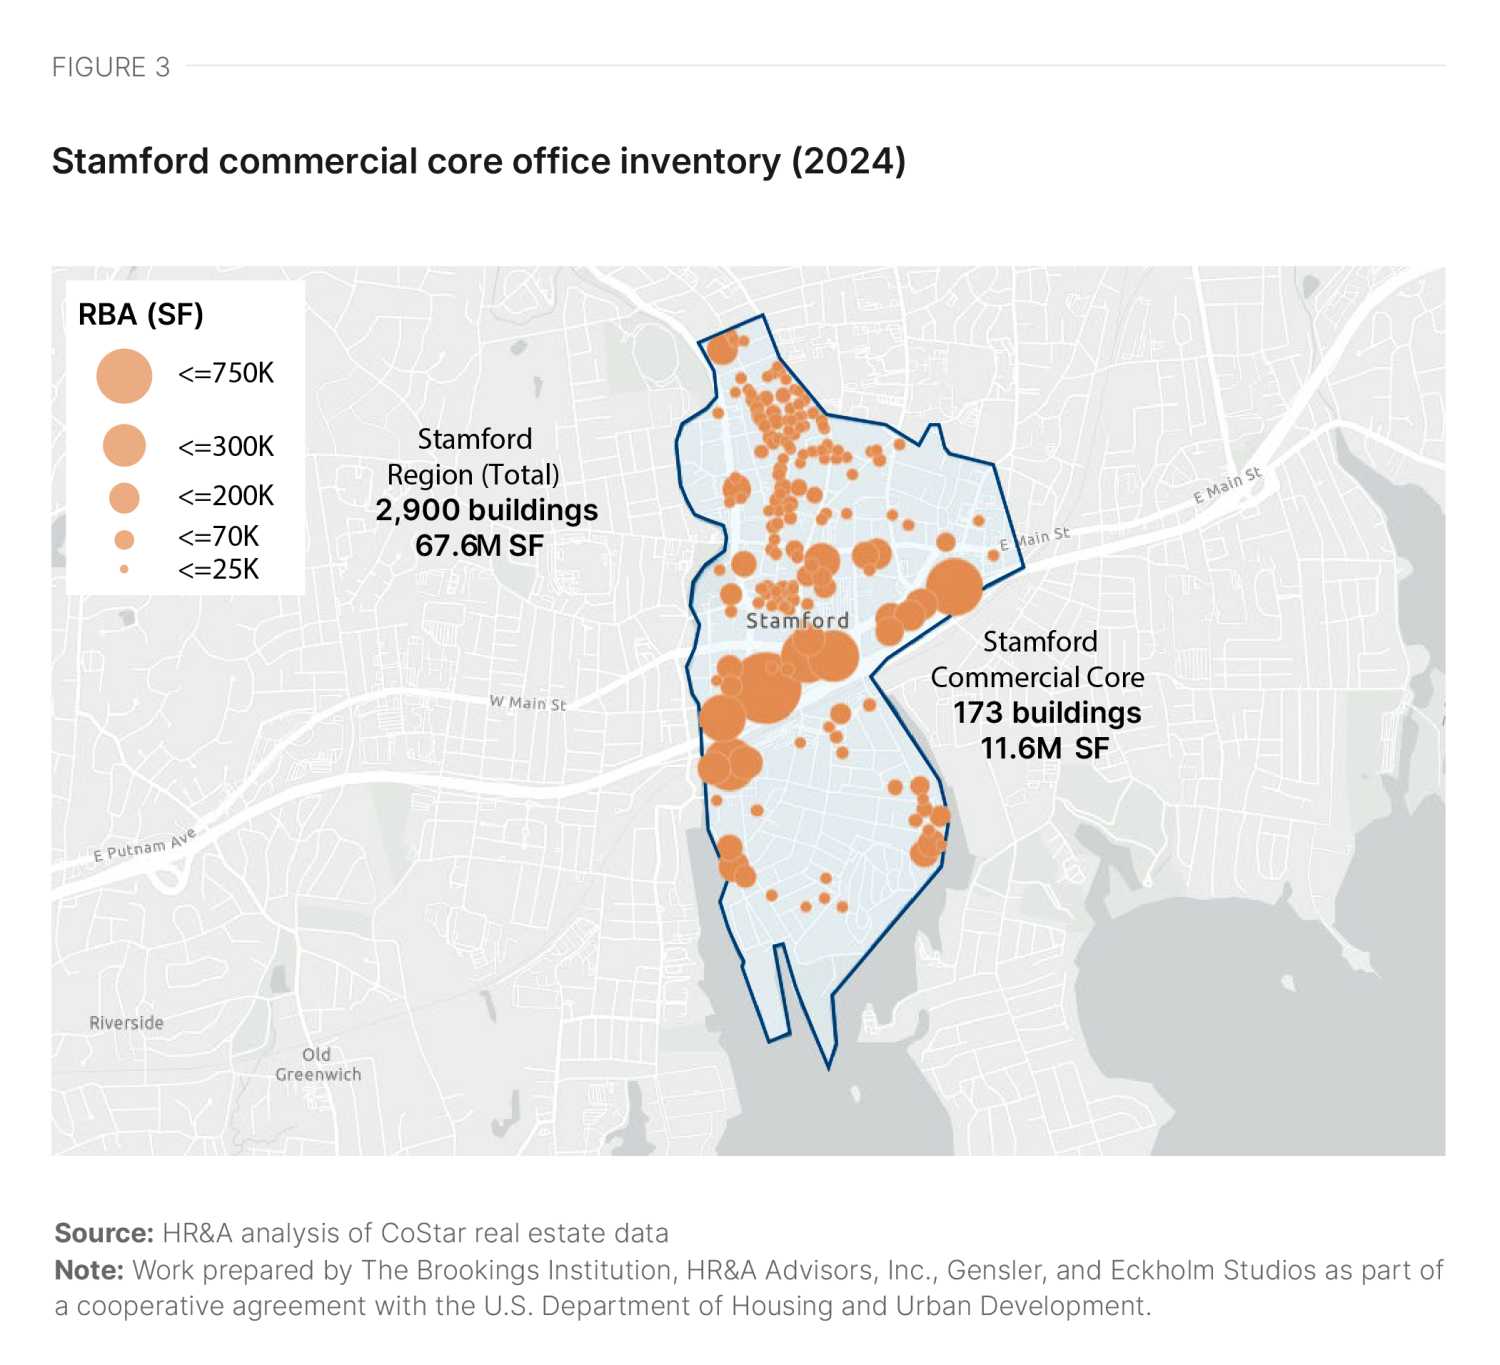
Where the full city boundary covers 37.6 square miles between the Long Island Sound and the Connecticut-New York border, the commercial core—the unit of analysis for our study—is a mixed-use, 1.3-square-mile region including the city’s downtown and burgeoning South End district (Figure 2). The commercial core is bisected by Interstate 95 and the Northeast Rail Corridor, which serves the central Stamford Transportation Center, a train station with Amtrak, Metro-North, and CTtransit service. Large and newer office buildings tend to have large floor plates and form a corridor along I-95, and smaller and older buildings are largely clustered in the northern section of the commercial core. Multifamily units are scattered throughout the commercial core, though there is a notable cluster in the South End near the waterfront, which has grown rapidly over the past two decades through major development projects such as Harbor Point.
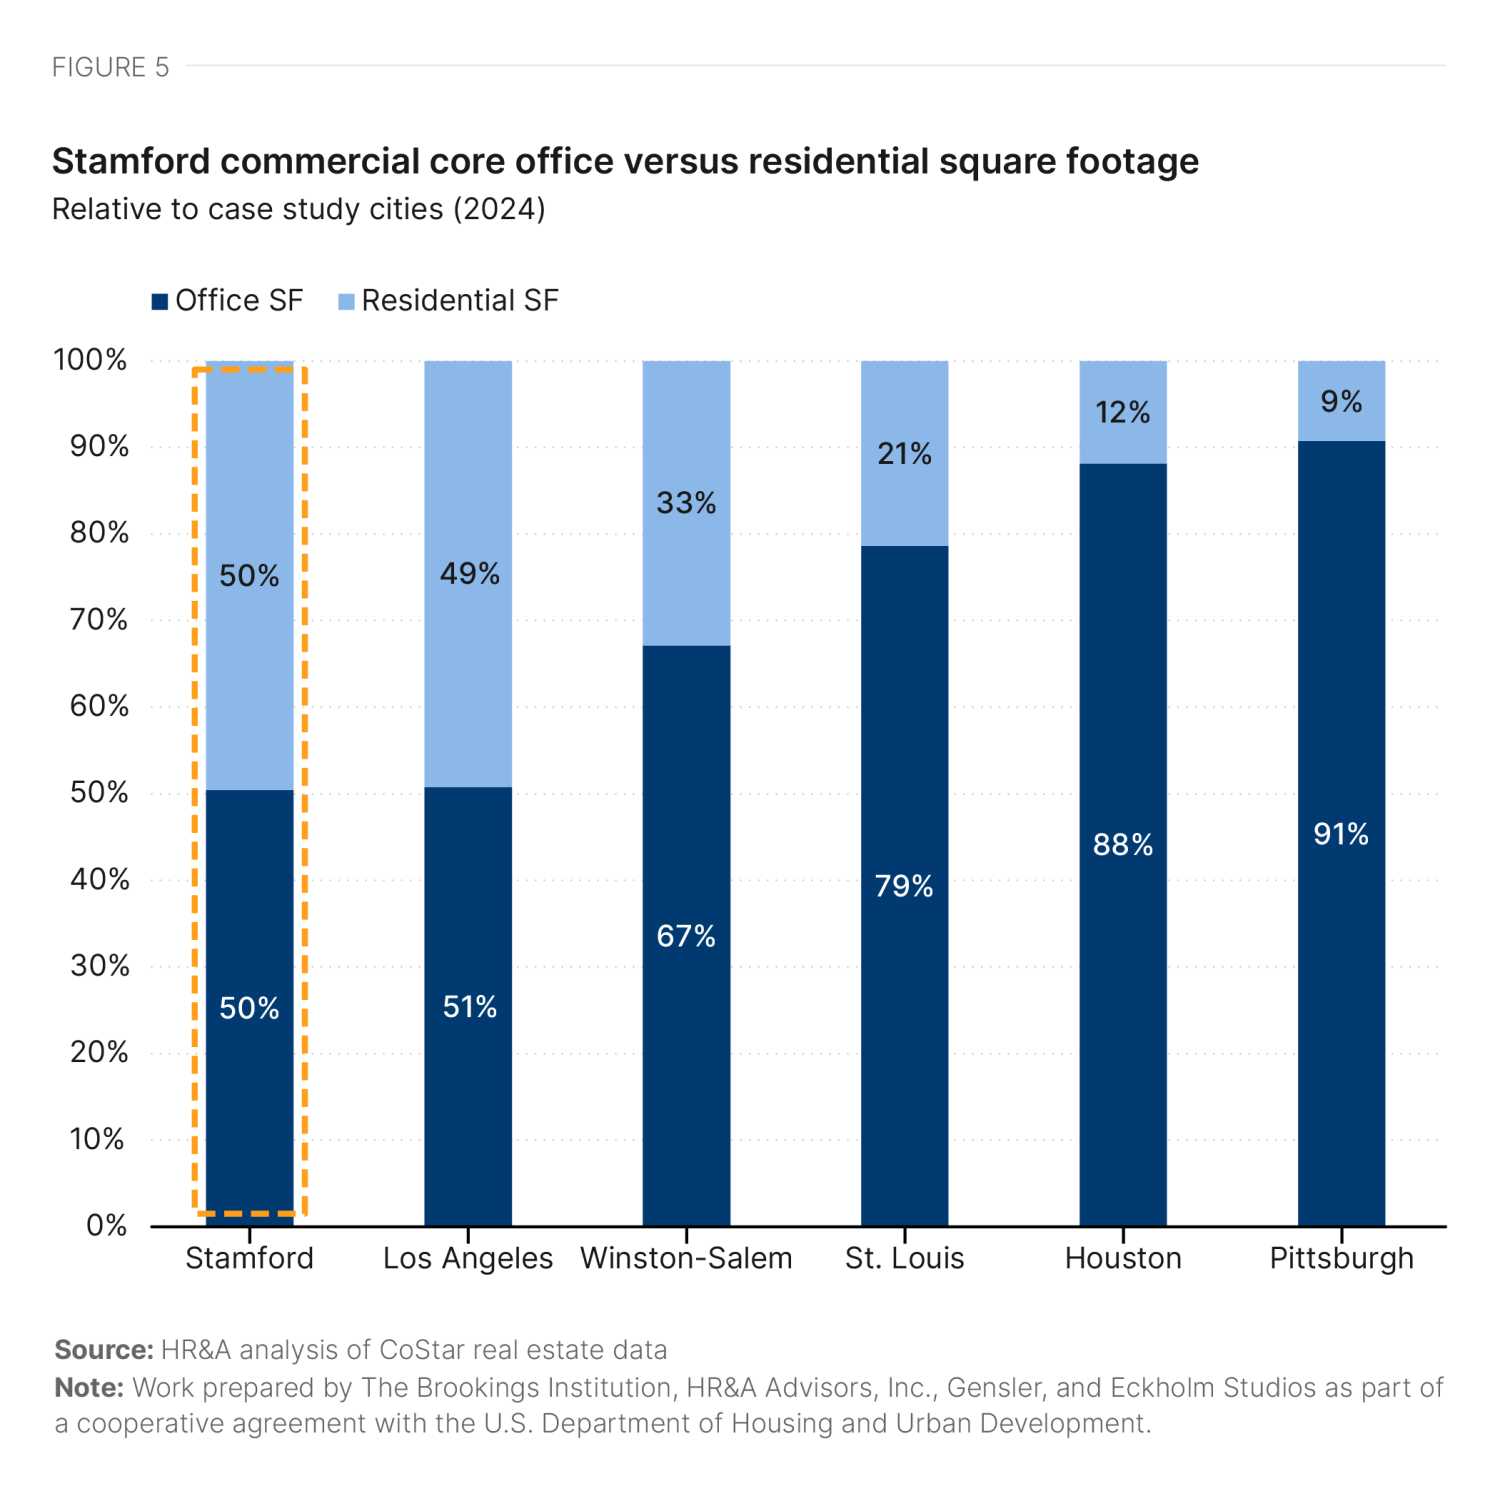
With 173 office buildings totaling 11.6 million square feet (Figure 3), and 116 multifamily buildings with 12,300 units (Figure 4), the Stamford commercial core has an equal share of office and multifamily rental square footage (Figure 5). The commercial core has the highest share of multifamily space relative to office out of any of our six case study cities.
The average age of an office building in Stamford is 59 years. While Stamford has several historic districts, stakeholder interviews identified the period of significance for designation of historic buildings in these areas as the late 1800s through the 1930s, meaning most of Stamford’s office buildings are not currently eligible for historic tax credits. Only 4% of the office buildings in the commercial core were built within the last 15 years, making up 16% of the total office square footage.4

Office market conditions
The office market in the Stamford commercial core has struggled for over a decade, while residential demand has boomed given chronic regional housing shortages. The pandemic exacerbated both trends, with offices experiencing additional vacancy (particularly in Class B and C buildings), while residential rent more than tripled.
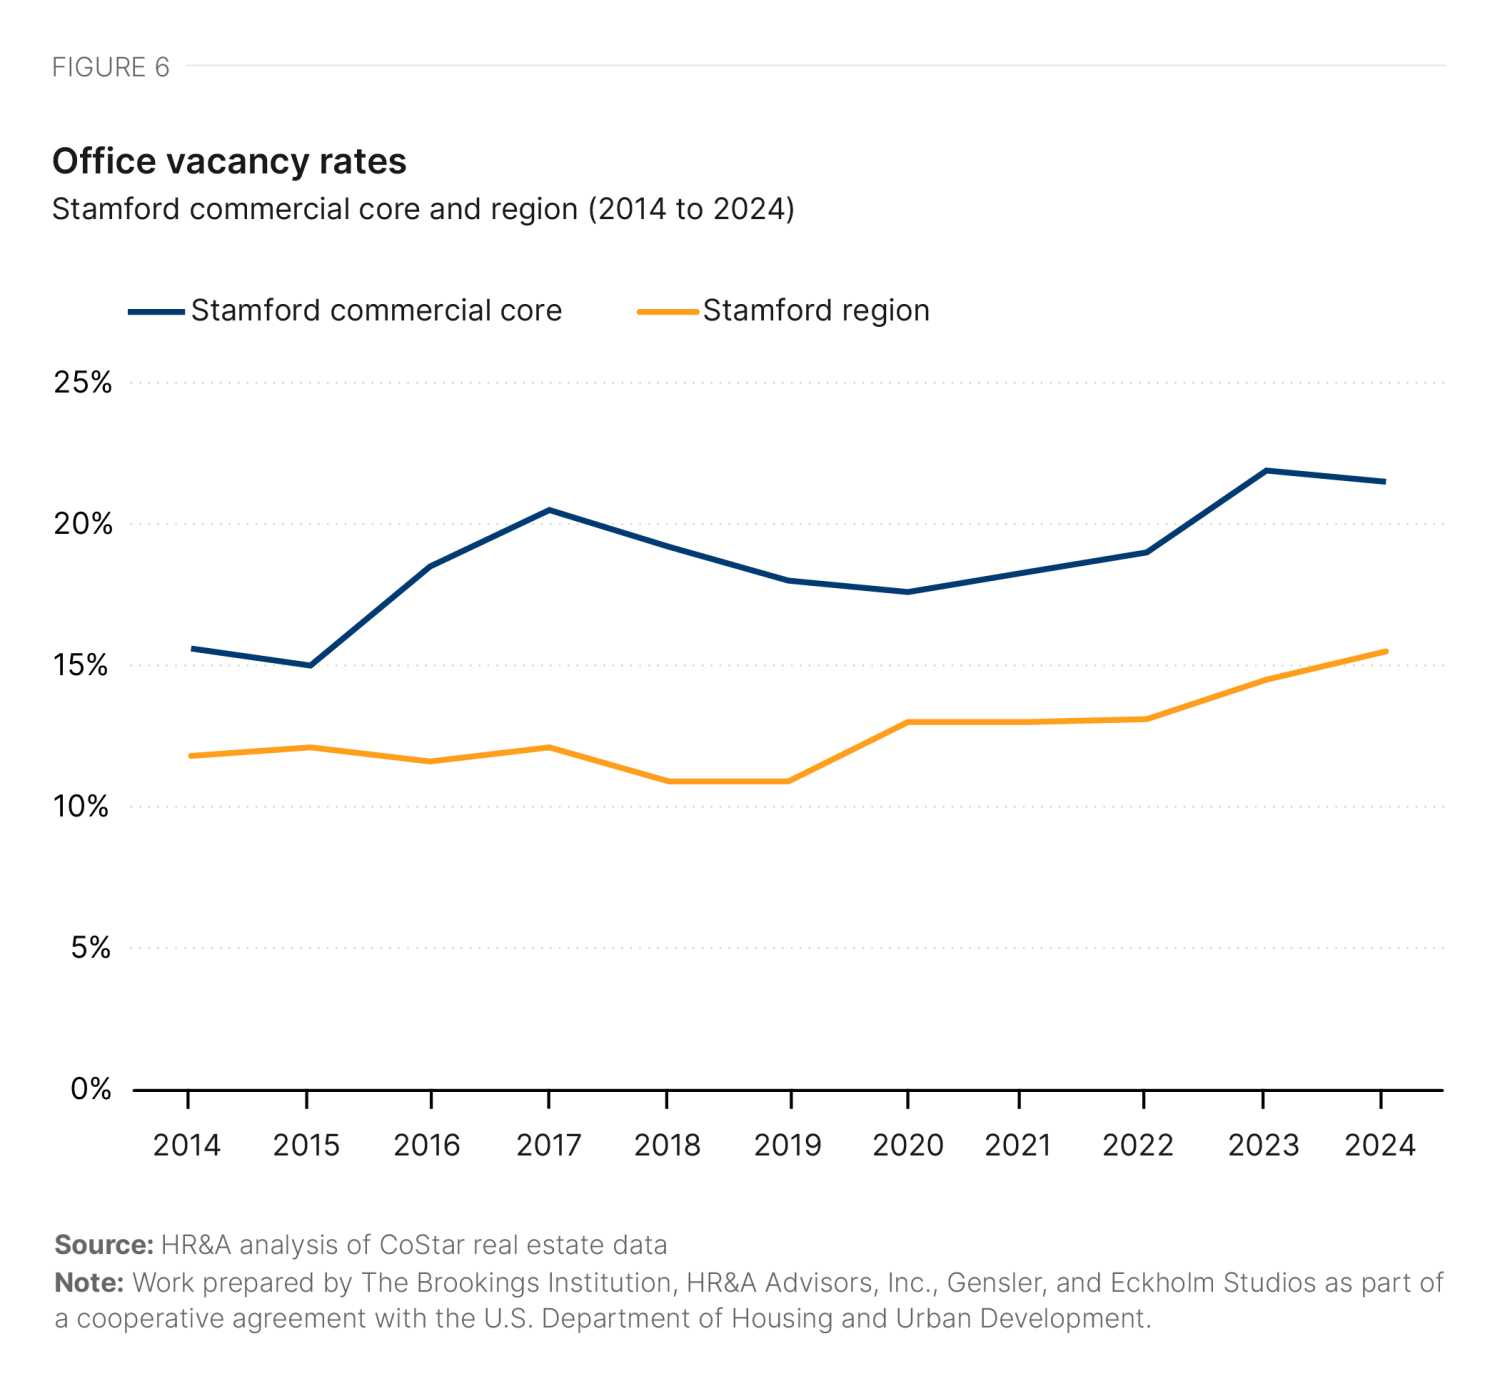
Office vacancy rates in the Stamford commercial core have consistently exceeded regional vacancy over the past decade, with an increase from 15% to 21% in the commercial core between 2015 and 2017 and another spike to 22% in 2023 (Figure 6). These vacancy increases have primarily been driven by tenants leaving Class B and C buildings, while Class A buildings (which make up a small portion of the office stock) have had lower vacancy rates. While citywide vacancy rates appear to be continuing to climb, vacancy rates in the commercial core have mostly stabilized around 22% for the past two years—higher than the 19% national average office vacancy rate in Q3 2024.
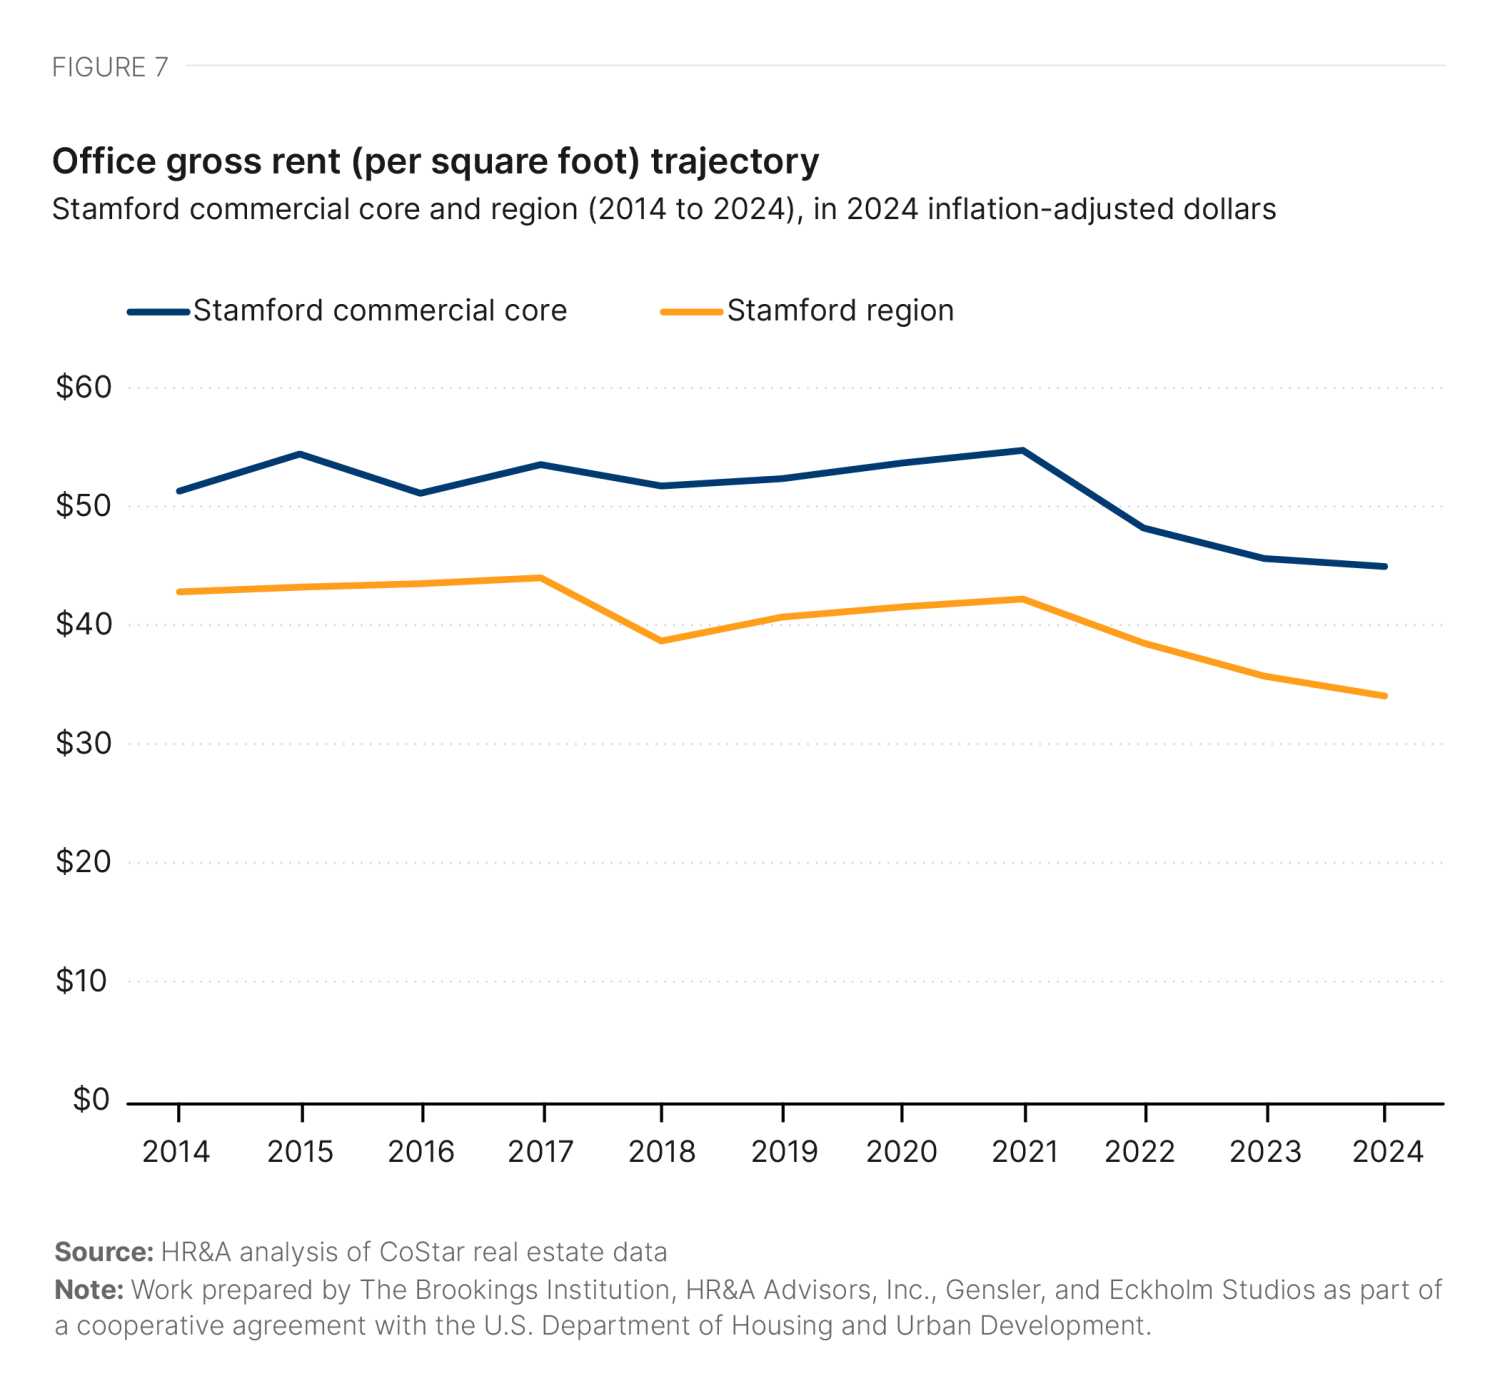
Inflation-adjusted gross rents for offices in the commercial core grew at a slow rate in the years leading up to the pandemic, while declining in the regional office market. Since 2019, inflation-adjusted rents have declined at a rate of 3% per year in the commercial core and 3.5% per year throughout the region (Figure 7).
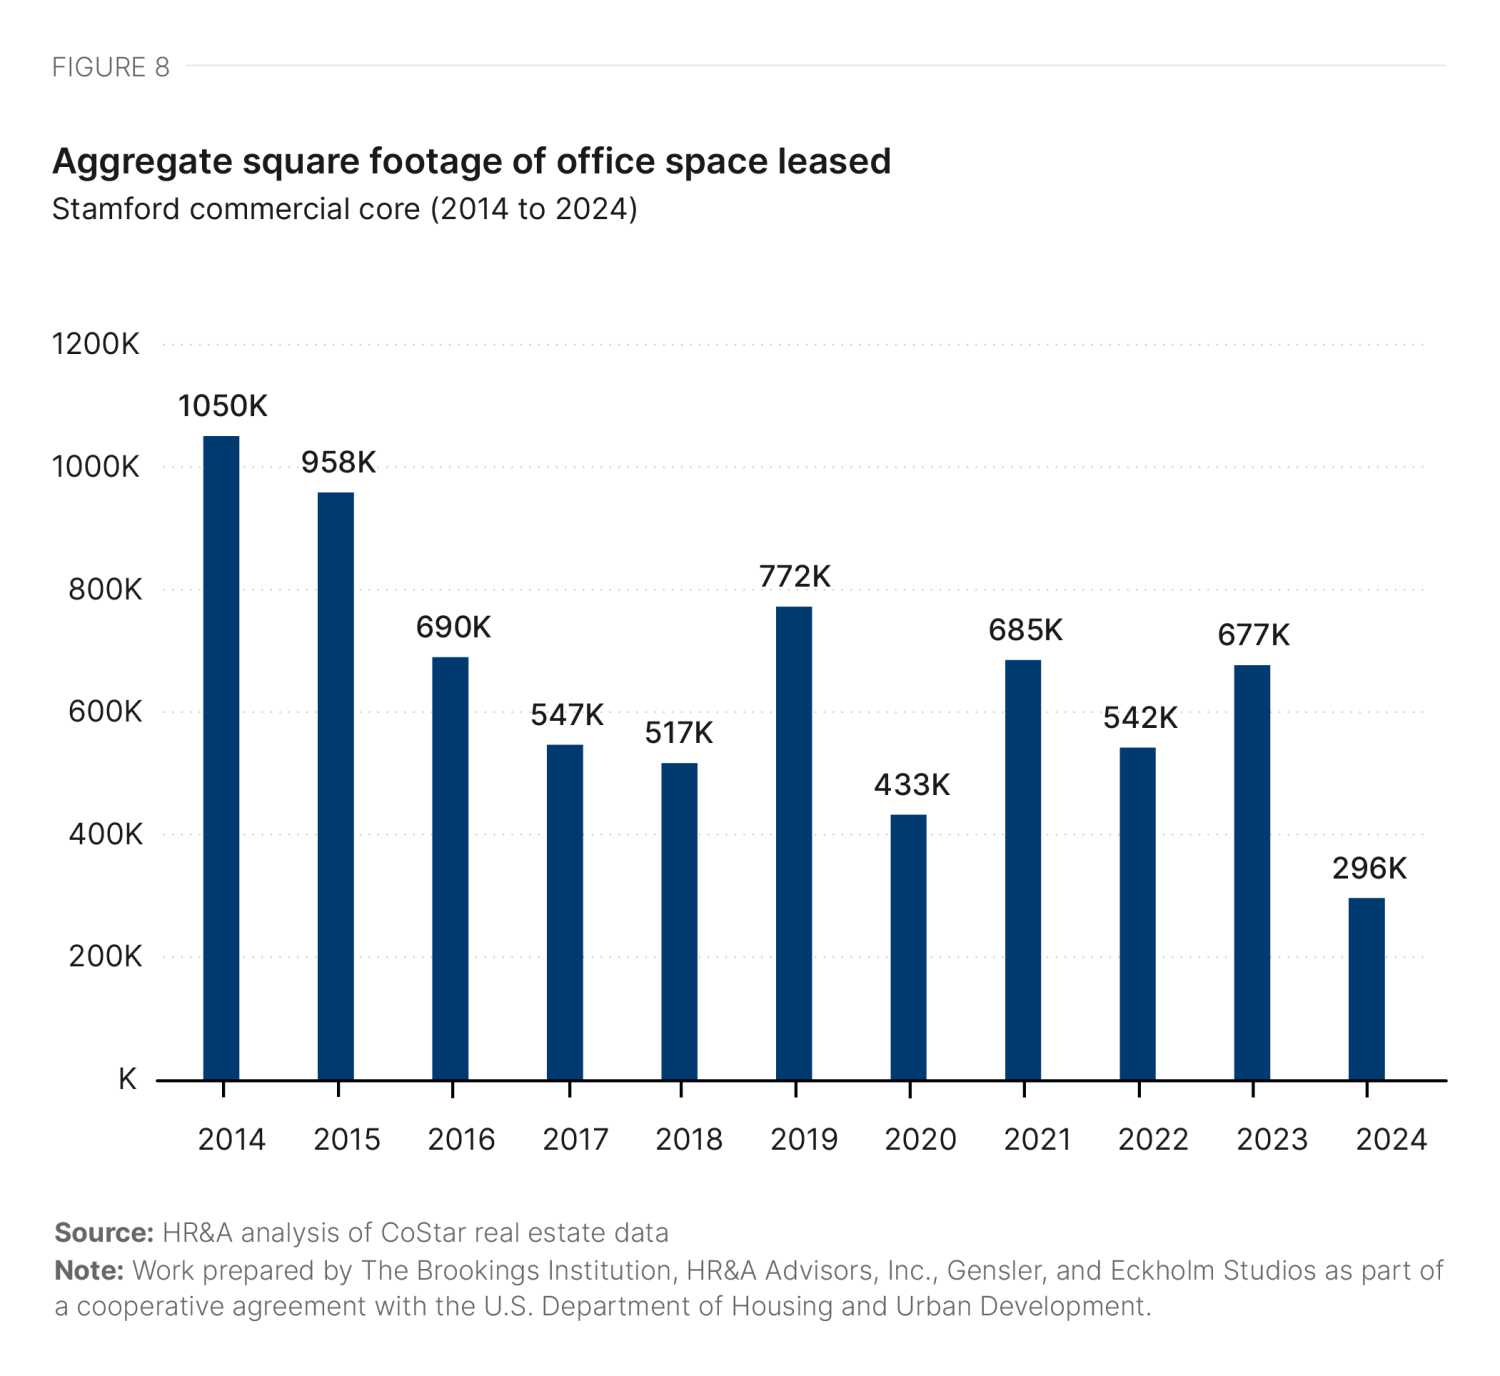
Leasing activity in the commercial core was already declining as early as 2016, and has continued to decrease since the pandemic, especially in older Class B and C buildings (Figure 8). Average leasing activity dropped 22% in 2023, compared to a 26% decrease in Class B and C buildings and a 20% decrease in Class A buildings from 2014 to 2019. However, there have been increases since 2020. Lease expirations in 2016 and 2017 initially drove vacancy rates in the commercial core to over 20%. While absorption kept up with demand in 2019 and 2020, lease expirations after the pandemic pushed vacancy rates over 20% again. However, positive absorption so far in 2024 has stabilized vacancy rates around 22%.5
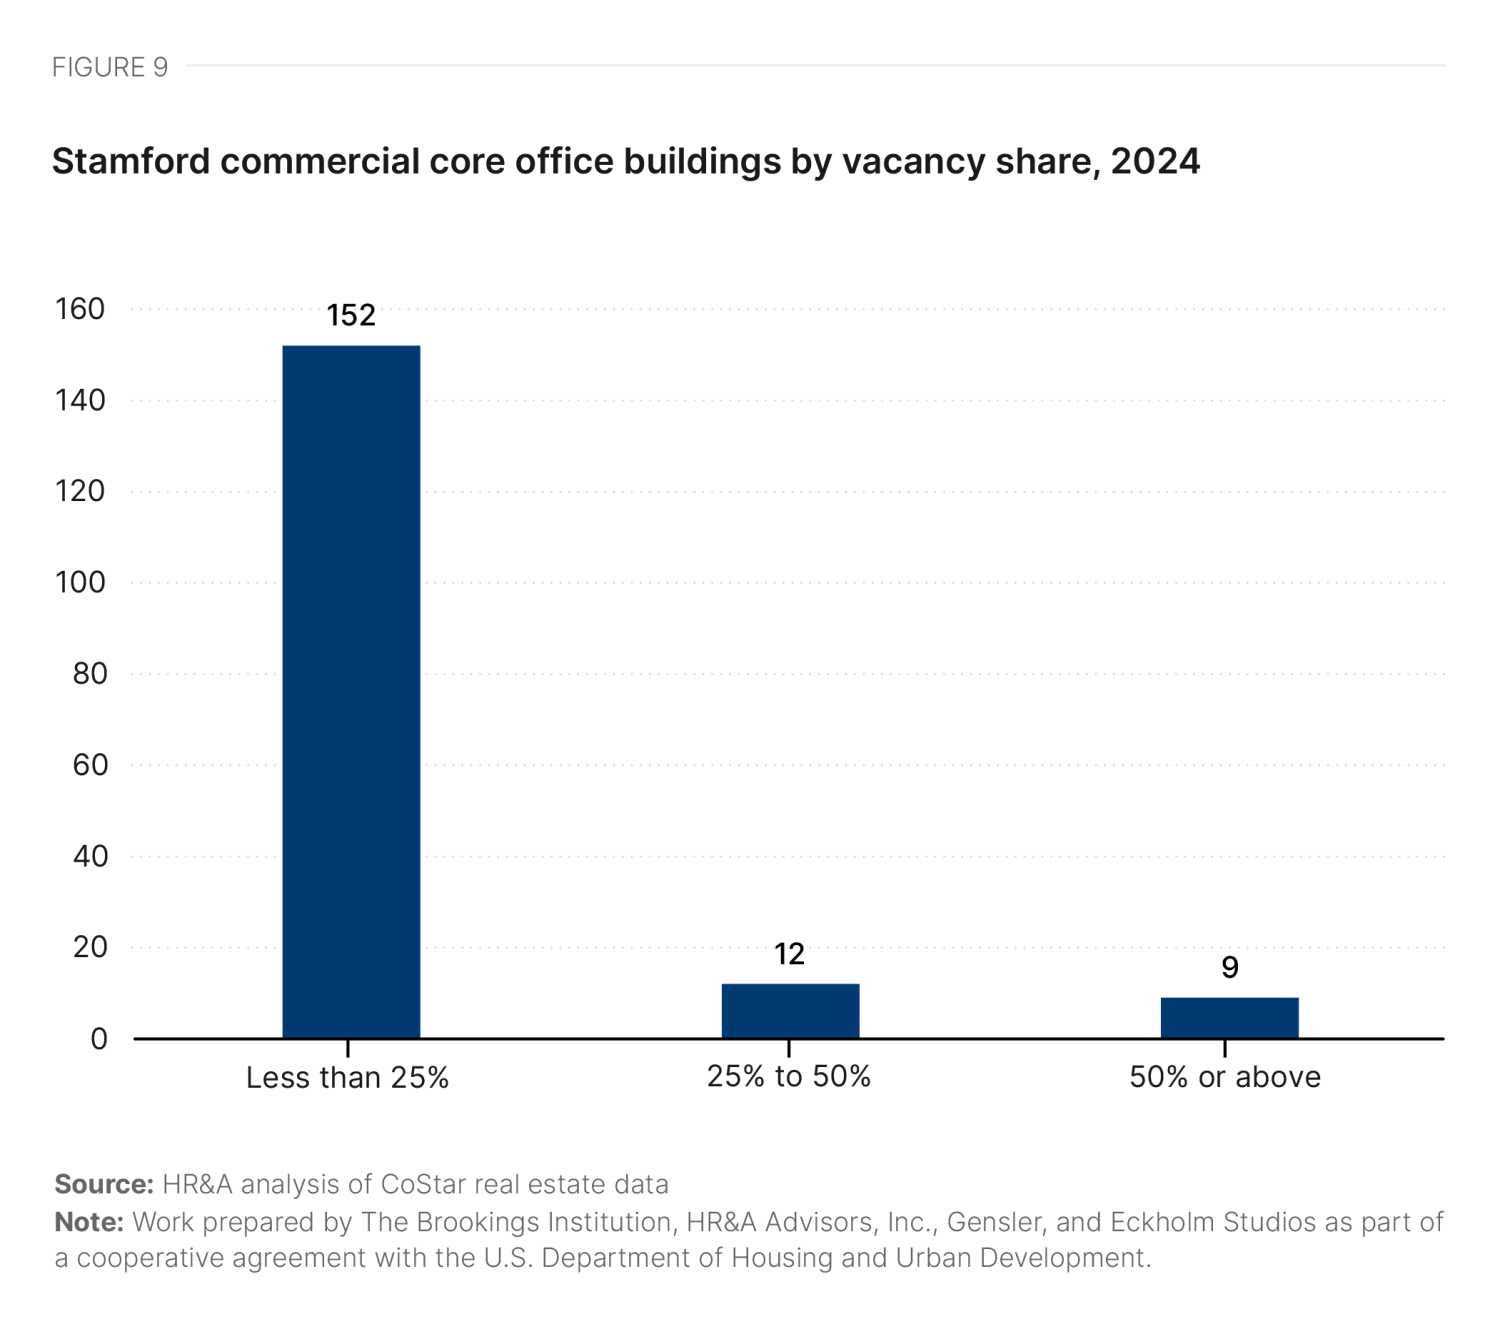
Sixty percent of office vacancy in the commercial core is concentrated in just 10 buildings (Figure 9), which are all over 200,000 square feet. These buildings are Class B and C, and have an average age of 42 years. Many of the most vacant buildings are clustered along I-95, although there are a few in the northern section of the city’s downtown district and portions of the South End around the Harbor Point development. Four out of the five buildings with highest vacant square footage have vacancies over than 50%.6
Residential market conditions
Despite the dominance of detached single-family homes across the city’s land footprint, 59% of Stamford’s housing units are now in multi-unit structures. This is a recent trend: 40% of the multifamily rental market has been built since 2010, and as of 2022, Stamford is, for the first time, a majority-renter city (51% of households).7 Much of the new development occurred in Harbor Point, which was previously less densely built than the center of downtown. A whopping 20% of Stamford’s population lives in the commercial core; in a typical U.S. city, this share is between 1% and 5%.8
The growth in the multifamily market has been caused, in part, by growing pressure within the tri-state region housing market. The housing gap, defined as the demand minus supply, in the region grew from 494,000 units to 541,000 units between 2012 and 2023. Stamford has captured some of the excess demand from the New York City market, offering a nearby alternative for urban living.
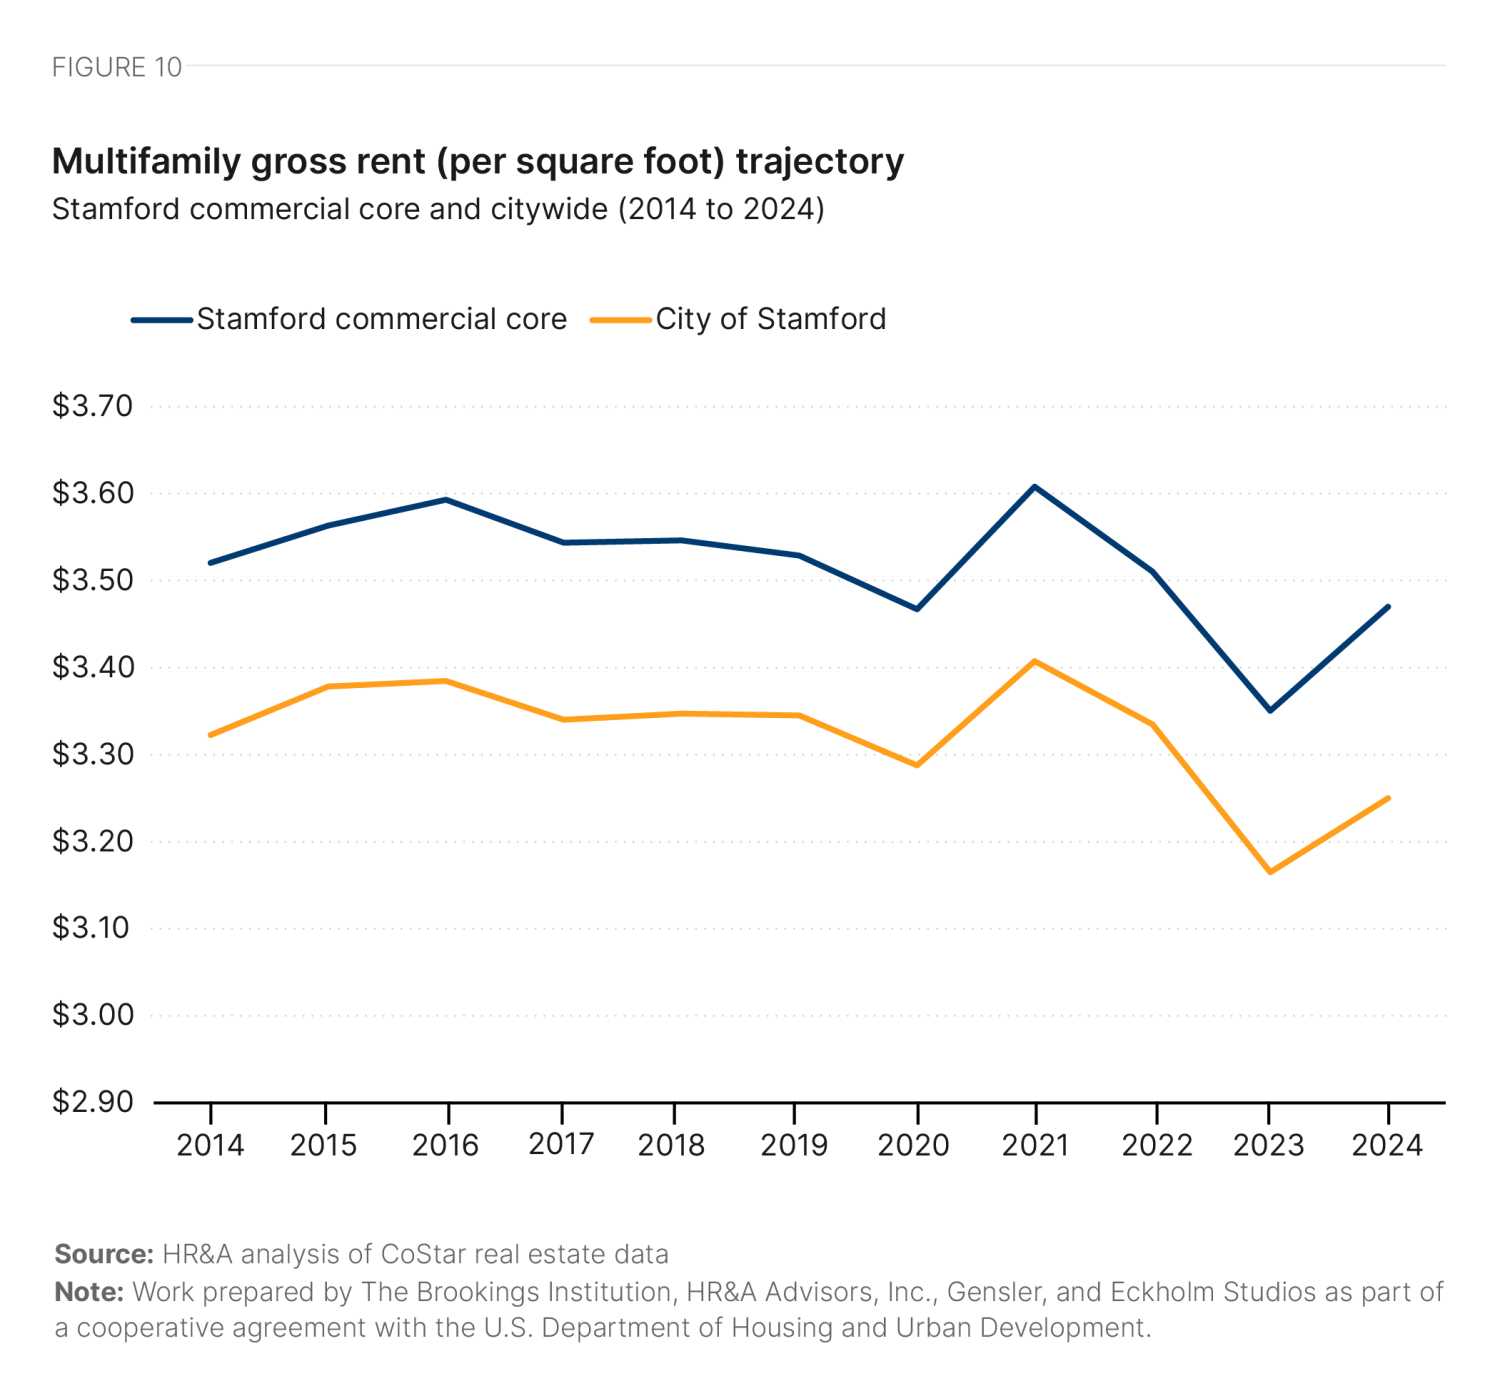
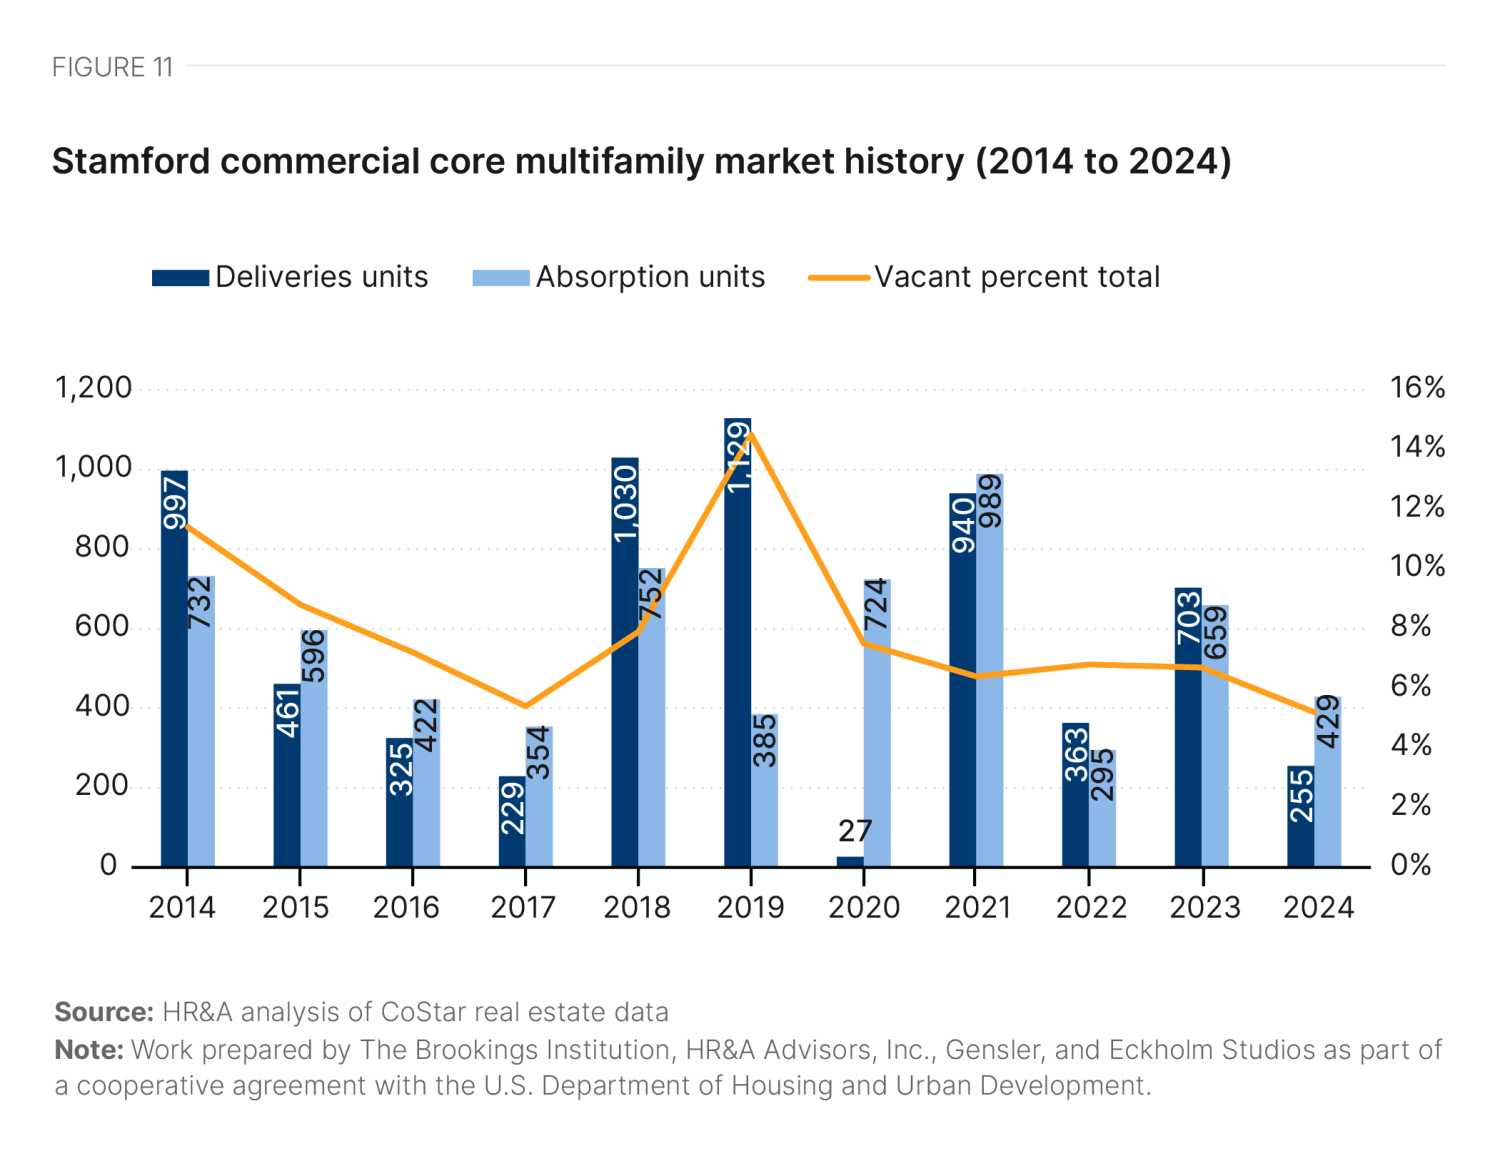
As a result of strong demand, even as supply in Stamford’s commercial core increased dramatically, multifamily rents have stayed stable over the past 10 years in inflation-adjusted terms (Figure 10). In nominal terms, rents have grown at an average of 4.6% per year since 2020, bringing the current average effective rent to $3.47 per square foot, compared to $2.88 per square foot before the pandemic.9 Even with this nominal growth in rents and the addition of over 4,400 new units since 2018, vacancy rates are at 5%—the lowest they have been in the past 10 years (Figure 11).
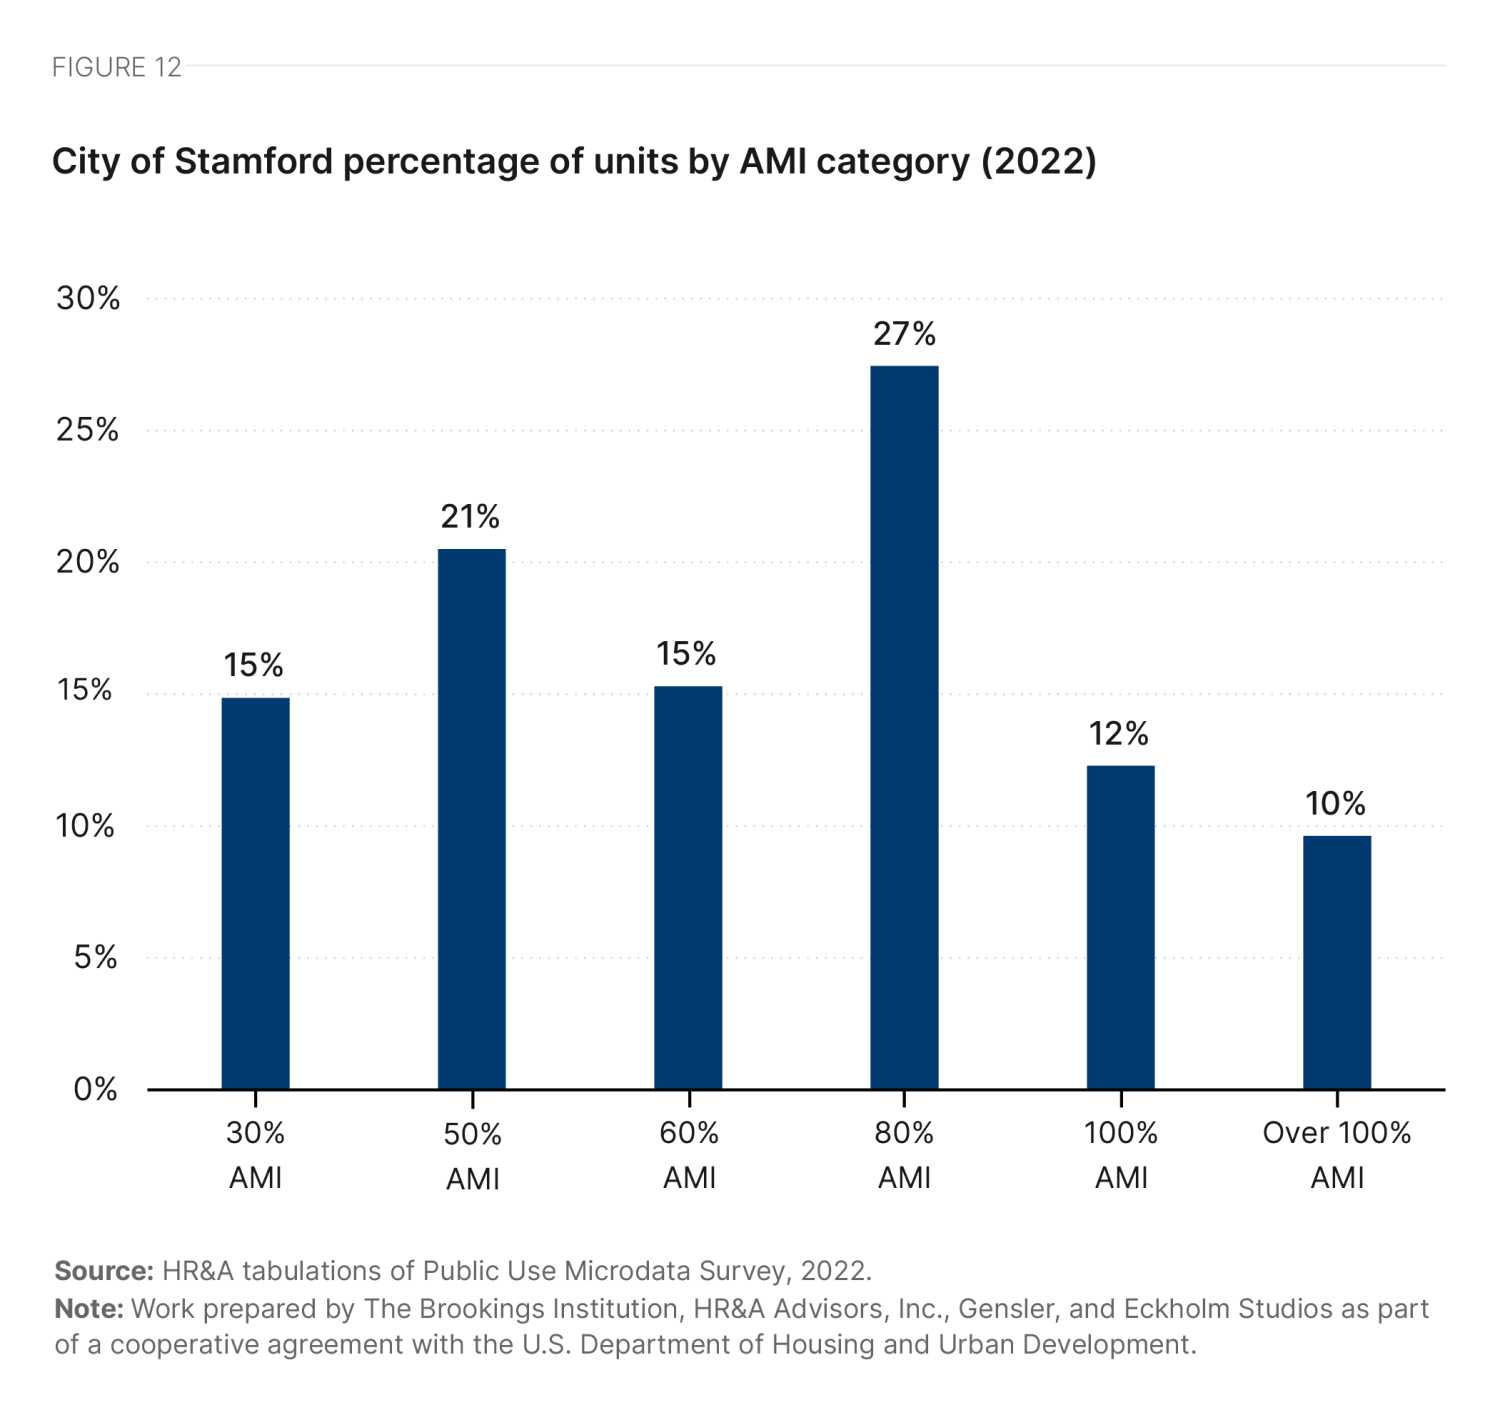
The appreciation of residential value is creating housing affordability challenges for a large share of the city’s residential population, as well as making it challenging for those who have grown up in Stamford to stay. Even though the city’s poverty rate is quite low (at just below 10%), almost 42% of all Stamford households spend more than 30% of their income on housing, meeting the Department of Housing and Urban Development (HUD) definition for being “housing cost burdened.”10 Statewide, this figure is 34%. Thirty-six percent of units are affordable to households earning 50% of the area median income (AMI) (Figure 12, Table 1).11

Stamford’s commercial core is much more diverse than the city as a whole and state of Connecticut. Fifty-four percent of the commercial core population is people of color, compared to 48% of the city population and 30% of the state population. The commercial core is 25% Latino or Hispanic—a slightly lower proportion than the city, but significantly higher than the state’s proportion of 17%. Stamford’s commercial core also has a higher poverty rate than the state: 13.5% of commercial core residents live below the poverty line, compared to just 9.9% across the city and state (Table 2).
|
Submarket |
Citywide |
Statewide |
|
|---|---|---|---|
|
Total Population |
|||
| White Alone Population Share | 45.7% | 52.0% | 69.9% |
| Black Alone Population Share | 26.6% | 18.6% | 10.7% |
| Other Share (anything other than White or Black alone) | 27.7% | 29.3% | 19.5% |
| Hispanic Population Share | 24.7% | 29.8% | 17.4% |
|
Population in Housing Units |
|||
| Poverty rate | 13.5% | 9.9% | 9.9% |
Source: Brookings analysis of ACS 2022 5-year estimates
Note: Poverty rate used here is defined as the share of people in housing units. Work prepared by The Brookings Institution, HR&A Advisors, Inc., Gensler, and Eckholm Studios as part of a cooperative agreement with the U.S. Department of Housing and Urban Development.
Political, policy, and financial conditions
Stamford has a strong mayor form of government with a 40-member board of representatives composed of two representatives from each of its 20 districts. In addition, the city has both a planning board and zoning board, each hypothetically composed of five members, all appointed by the mayor subject to the approval from the board of representatives. As of 2024, the state funded the operations of the recently created Municipal Redevelopment Authority (MRDA) to facilitate building housing near transit in Stamford and other Connecticut cities through technical assistance and bond financing.
Since the onset of the pandemic, the city of Stamford has initiated some modest text amendments to its zoning ordinance to further streamline the development review process for office-to-residential conversions. At the state level, a number of ambitious bills have been introduced to make policy and financial changes that would ease or promote office-to-residential conversions, but most have not passed the legislature due to resistance from residents concerned about the addition of multifamily units in low-density residential areas. However, the demand for housing in Stamford remains so immense that seven conversions over 50,000 square feet have moved ahead since 2020, despite Stamford’s many policy challenges.
Pragmatic observers of Stamford’s market fundamentals and fiscal picture are highly aware of the unique importance of office-to-residential development, providing an avenue to replace obsolete, low-density office parks with mid- to high-rise housing. The top motivations for conversion are:
- Responding to the regional housing need
- Strengthening the office market by removing obsolete product
However, across the city, office-to-residential conversion remains controversial in many of Stamford’s more suburban quarters. One recent proposal to replace a low-rise office park complex with apartments has become ensnared in litigation, while a neighboring proposal faces vocal resident opposition. Even office-to-residential proponents acknowledge that there are real negative traffic impacts related to growth outside the downtown. The fight is over whether these impacts can be avoided or not given population growth, and whether these impacts are truly worse than the alternative, which is endlessly bidding up the cost of housing in Stamford.
I think in a lot of places, we're still stuck in the mindset that commercial is a net positive, residential drains, and not understanding that actually, the right kind of residential can be a replacement for the commercial in a way that continues to deflect away from the single-family burden.
A Stamford stakeholder
The governance system for changing land use in Stamford has proved challenging for new multifamily development, hindering office-to-residential conversion activity. The zoning board has not had a full complement of members in several years; there is currently one vacant regular seat and one alternate seat, and three of the four current members are serving expired terms. In addition, zoning text and zoning map changes made by the zoning board can be appealed to the board of representatives by any Stamford property owner with a small number of signatures on a petition, but cannot be appealed by the applicants—at times resulting in subjective or heavily politicized land use decisions. Denied applicants have resorted to lawsuits, including recent litigation over replacing offices with apartments. One reason for the popularity of special permits to convert offices into housing compared to other pathways is that they cannot be appealed by petitioners.
The board of representatives is…anti-development, anti-rental housing. You can’t get good zoning board members appointed.
A Stamford stakeholder
Stamford has some zones that allow office-to-residential conversions by-right. Still, the permitted densities are relatively low, so the vast majority of office-to-residential conversions in Stamford occur through a special permit process outlined in Section 10.H and 10.I of the city’s zoning regulations. This process involves submitting an application to the planning department (Land Use Bureau), which is followed by a 35-day referral period in which the application is reviewed by that department as well as other agencies such as the traffic bureau and planning board. After 35 days, the application can be placed on a zoning board agenda for a public hearing. The total process, including the referral period and zoning board hearing, can take as little as three months. Currently, zoning text amendments to further streamline the special permit process and reduce affordability requirements for conversion projects are under consideration by the zoning board.
More broadly, Stamford has made a number of administrative attempts to address the housing crisis. Mayor Caroline Simmons issued an executive order in June 2023 directing staff to advance zoning reforms to increase housing production, among other action items. The city also has a Below Market Rate (BMR) Unit program that produces income-restricted affordable housing through either a 10% inclusionary zoning requirement on new developments of 10 units or more, or payments-in-lieu to the city’s Affordable Housing Trust Fund. It is unclear, however, how these approaches can scale to the magnitude of the housing crisis without significant cooperation from the board of representatives, which is largely resistant to new multifamily development activity.
Lastly, it is worth nothing that Stamford is a waterfront city, and many parcels are in more than one category of flood zone. Buildings that have very minimal footprints (for example, as little as five square feet) in a flood zone may be prohibited from converting to multifamily residential, and there is no standard federal-level administrative procedure to request exemptions.
Both in Stamford and in Connecticut, there are very few public tools available for developers to finance office-to-residential conversions (Table 3). While Connecticut has a historic preservation tax credit, it is limited in scope relative to the credits many peer states offer. However, financing is not a significant barrier to office-to-residential conversion in Stamford. Rent growth is sufficiently high to offset construction costs, and a number of experienced regional developers have made projects work without any form of public subsidy. The main obstacle to future office-to-residential conversion in Stamford is the political and policy climate described above—not underlying project economics.
|
Type |
Name |
Details |
|---|---|---|
|
Tax credit |
||
| State historic preservation tax credit | 25% of eligible rehabilitation expenses plus an additional 5% for projects that include affordable housing or are located in an Opportunity Zone, stackable on the 20% federal credit. The per-project limit is $4.5 million and the statewide total limit is $31.7 million per year. |
Note: Work prepared by The Brookings Institution, HR&A Advisors, Inc., Gensler, and Eckholm Studios as part of a cooperative agreement with the U.S. Department of Housing and Urban Development.
Past and future conversion activity
Despite political concerns about new multifamily housing, at least seven office-to-residential conversion projects have been completed since March 15, 2020, and at least two projects are in the planning process (Figure 13).

Seaview House Marina
Located in Stamford’s Cove neighborhood, this waterfront office is in the planning process for conversion into 52 residential units (Table 4). Despite a simple and straightforward textbook capital stack (Table 5), the project has been stalled for years as the developer navigated flood zone regulations that added millions in extra costs to address.
|
Name |
Seaview House Marina |
| Address | 68 Seaview Ave. |
| Owner | Eagle Ventures and Clearview |
| Gross square feet | 130,000 |
| Building history | Office, marina |
| Year built | 1986 |
| Year converted | Planned |
| Number of converted floors | 4 |
| Average floor plate size | 32,500 |
| Number of units | 52 |
| Unit mix by type | 13 x 1BR, 35 x 2BR, 4 x 3BR |
| Average rent | N/A |
| Average rent per square foot | N/A |
| Affordability | $2.3 million payment-in-lieu |
| Acquisition price | NA |
Source: Authors’ analysis of CoStar real estate market data and interviews with local stakeholders
Note: Work prepared by The Brookings Institution, HR&A Advisors, Inc., Gensler, and Eckholm Studios as part of a cooperative agreement with the U.S. Department of Housing and Urban Development.
|
Financing type |
|---|
|
Developer equity |
|
Senior construction loan |
Source: Authors’ interviews with local stakeholders
Note: Work prepared by The Brookings Institution, HR&A Advisors, Inc., Gensler, and Eckholm Studios as part of a cooperative agreement with the U.S. Department of Housing and Urban Development.
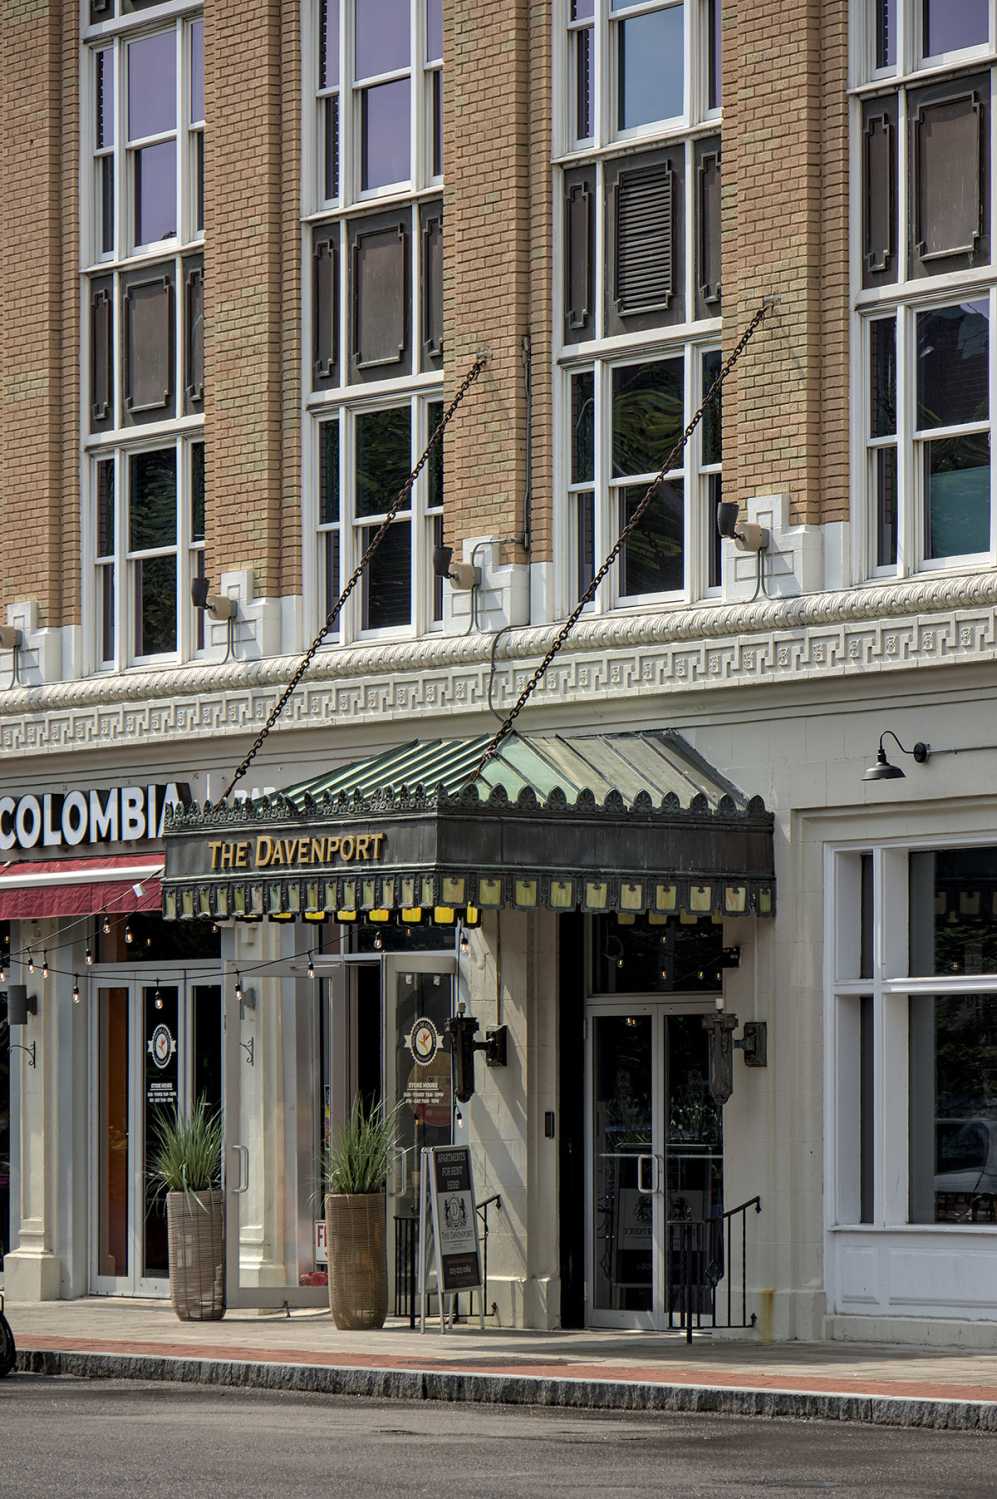
84 West Park Place: The Davenport
Empire Residential purchased and converted this downtown historic building into 27 apartment units. The building was originally built as a hotel in 1915 and later turned into 41,000 square feet of office space in the 1980s. Empire Residential converted the third, fourth, and fifth floors into apartments while keeping the ground floor as retail (Table 6). Empire Residential financed this conversion with a traditional mix of construction debt and developer equity (Table 7). No incentives were used.
|
Name |
The Davenport |
| Address | 84 West Park Place |
| Owner | Empire Residential |
| Gross square feet | 25,000 |
| Rentable square feet | N/A |
| Building history | Former hotel, office |
| Year built | 1915 |
| Year converted | 2024 |
| Number of converted floors | 3 |
| Average floor plate size | 8,300 |
| Number of units | 27 |
| Unit mix by type | 12 x Studio, 12 x 1BR, 3 x 2BR |
| Average rent | $2,156 |
| Average rent per square foot | $3.00 |
| Affordability | ~$820,000 payment-in-lieu |
| Acquisition price | N/A |
Source: Authors’ analysis of CoStar real estate market data and interviews with local stakeholders
Note: Work prepared by The Brookings Institution, HR&A Advisors, Inc., Gensler, and Eckholm Studios as part of a cooperative agreement with the U.S. Department of Housing and Urban Development.
|
Financing type |
|---|
|
Developer equity |
|
Senior construction loan |
Source: Authors’ interviews with local stakeholders
Note: Work prepared by The Brookings Institution, HR&A Advisors, Inc., Gensler, and Eckholm Studios as part of a cooperative agreement with the U.S. Department of Housing and Urban Development.
Future conversion potential
We assessed the architectural conversion viability of 25 high-vacancy buildings in Stamford. To select these buildings, we used CoStar data to identify buildings with vacancy rates in excess of 20%. The CoStar data were then triangulated with input from qualitative interviews about potential conversion candidates and additional factors such as year built, building area, number of stories, and office class in order to identify the buildings best suited to make up a representative set of properties for architectural conversion viability analysis. Finally, three buildings were selected for detailed architectural studies based on results from the initial analysis and input from interview participants.
Buildings were assigned a percentage score to denote their architectural compatibility for conversion, and grouped into the following categories:
- Properties that score above 80% can likely convert without design compromises.
- Properties that score between 70% and 80% can likely convert with some design compromises.
- Properties that score under 70% can likely convert only with major design compromises.
From the analysis, we then projected out the number of units that would be created by converting all the scored buildings. We also projected the greenhouse gas savings associated with unit creation via conversion rather than new build activity. A full explanation of our calculation methodology is included in Appendix A.
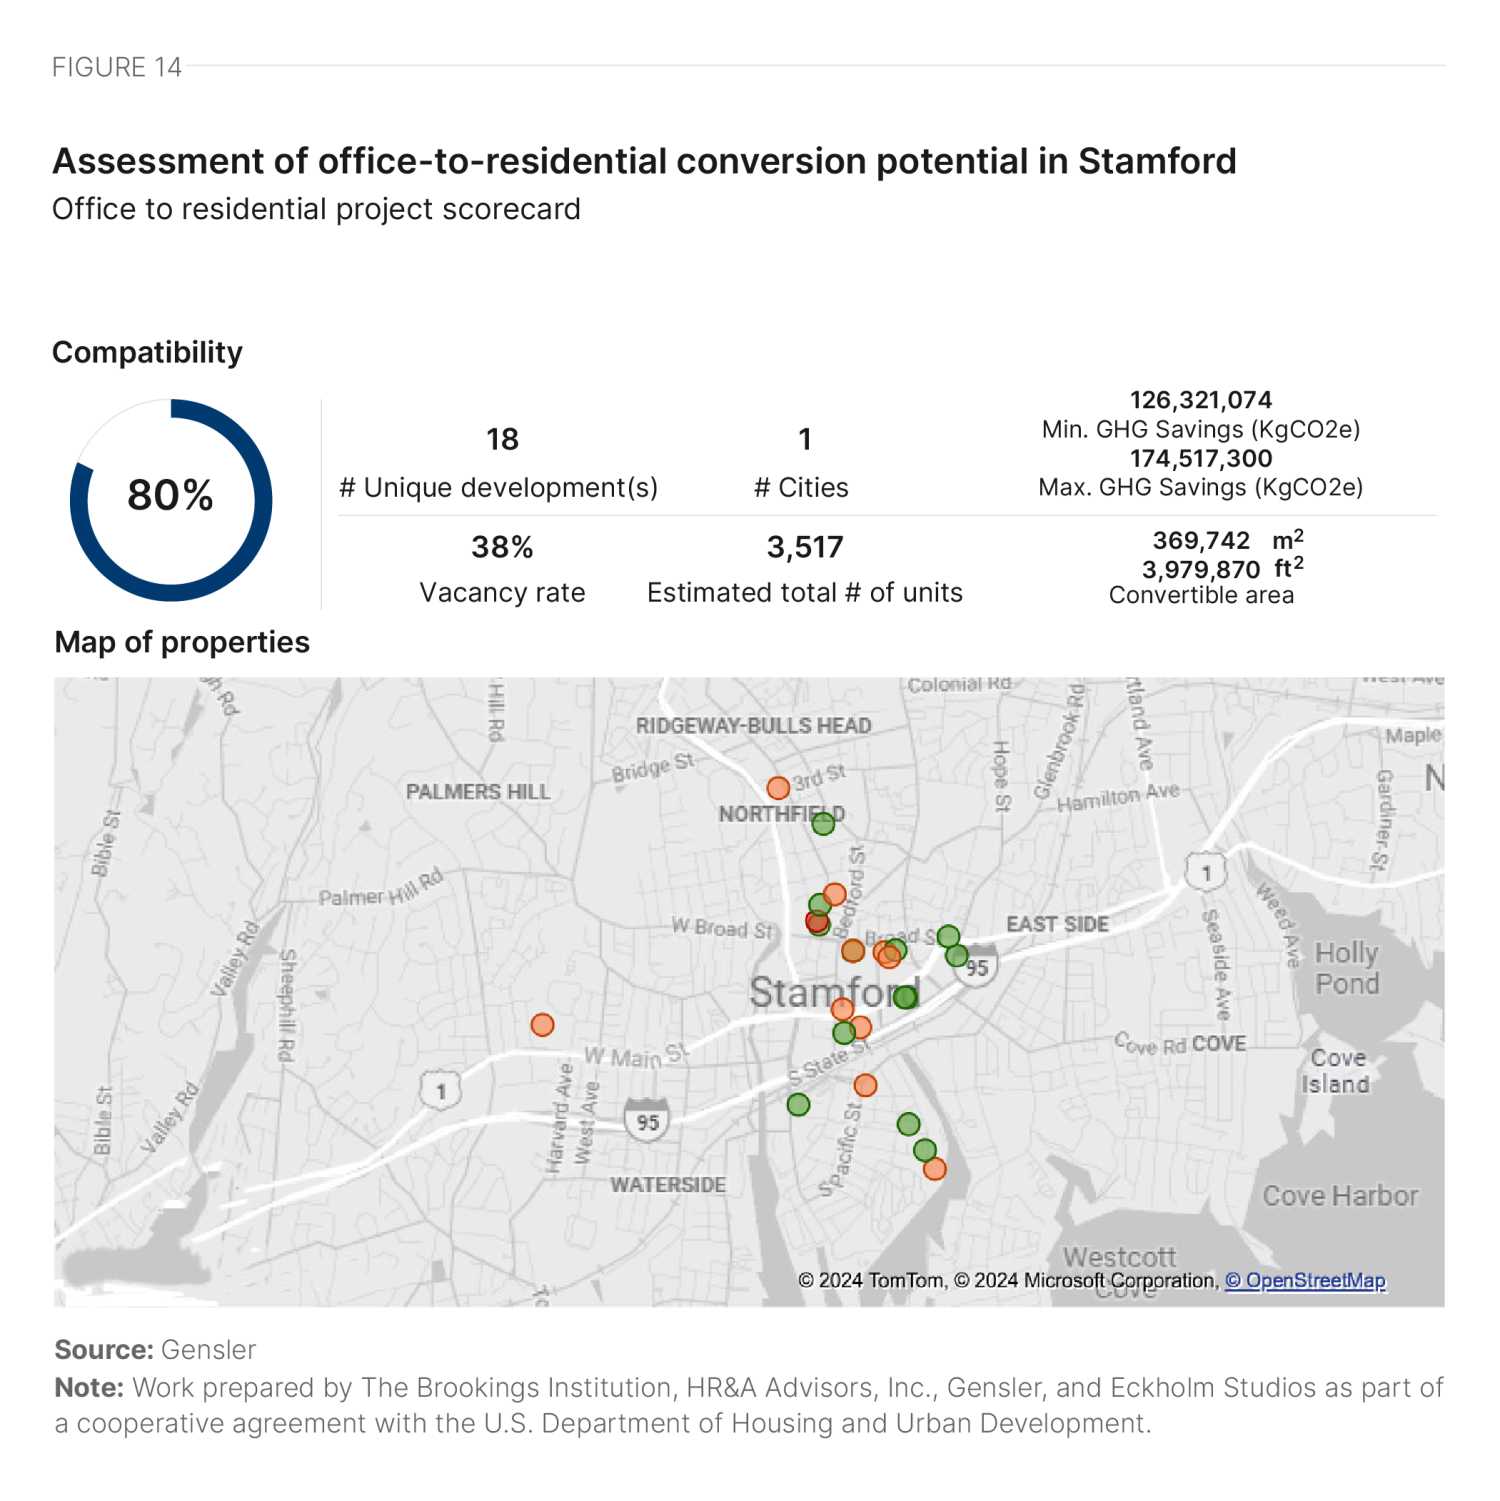
In Stamford, 13 buildings account for 51% of the total building area analyzed, each scoring over 80%. Another 11 buildings, making up 48% of the area, score over 70%. Overall, the average compatibility score of the buildings studied in Stamford is slightly higher than the average score of the 1,400-plus buildings Gensler has studied.
While most of the buildings have the desired rectangular form, some, such as 281 Tresser Blvd., have substantial steps in the facade, and others, such as 333 Ludlow St., have a wedge form. These non-rectangular forms, mostly built in the 1980s, negatively impact their score, as unit planning becomes more challenging and floor plate efficiency may be reduced.
Floor plate size and core-to-window depth varied across buildings, affecting conversion compatibility scores. Some buildings, such as 201 Tresser Blvd. had large floor plates and core-to-window depths, making it difficult to utilize the deep space for rentable area. In contrast, buildings such as 484 Pacific St. and 6 Suburban Ave. had smaller floor plates and shallow core-to-window depths, which could result in a constrained unit mix.
Good walkability and connectivity through public transport such as trains, buses, and ferries positively impacted the scores of all buildings analyzed. Similarly, access to food and beverage outlets, grocery stores, parks, and entertainment venues positively impacted scores, while the lack of schools downtown within walking distance was a negative factor.
Facade types also impacted the overall scores variably. Very few buildings had operable windows, which are desired for conversion. Instead, Stamford is dominated by buildings with ribbon windows and curtain facades, which generally score lower as they have an elevated chance of needing replacement. Most buildings with ribbon windows, such as 301 Tresser Blvd. and 333 Ludlow St., were built between 1950 and 1990. Curtain wall facades were observed in buildings constructed after the 1970s, such as 1 Landmark Square and 281 Tresser Blvd.
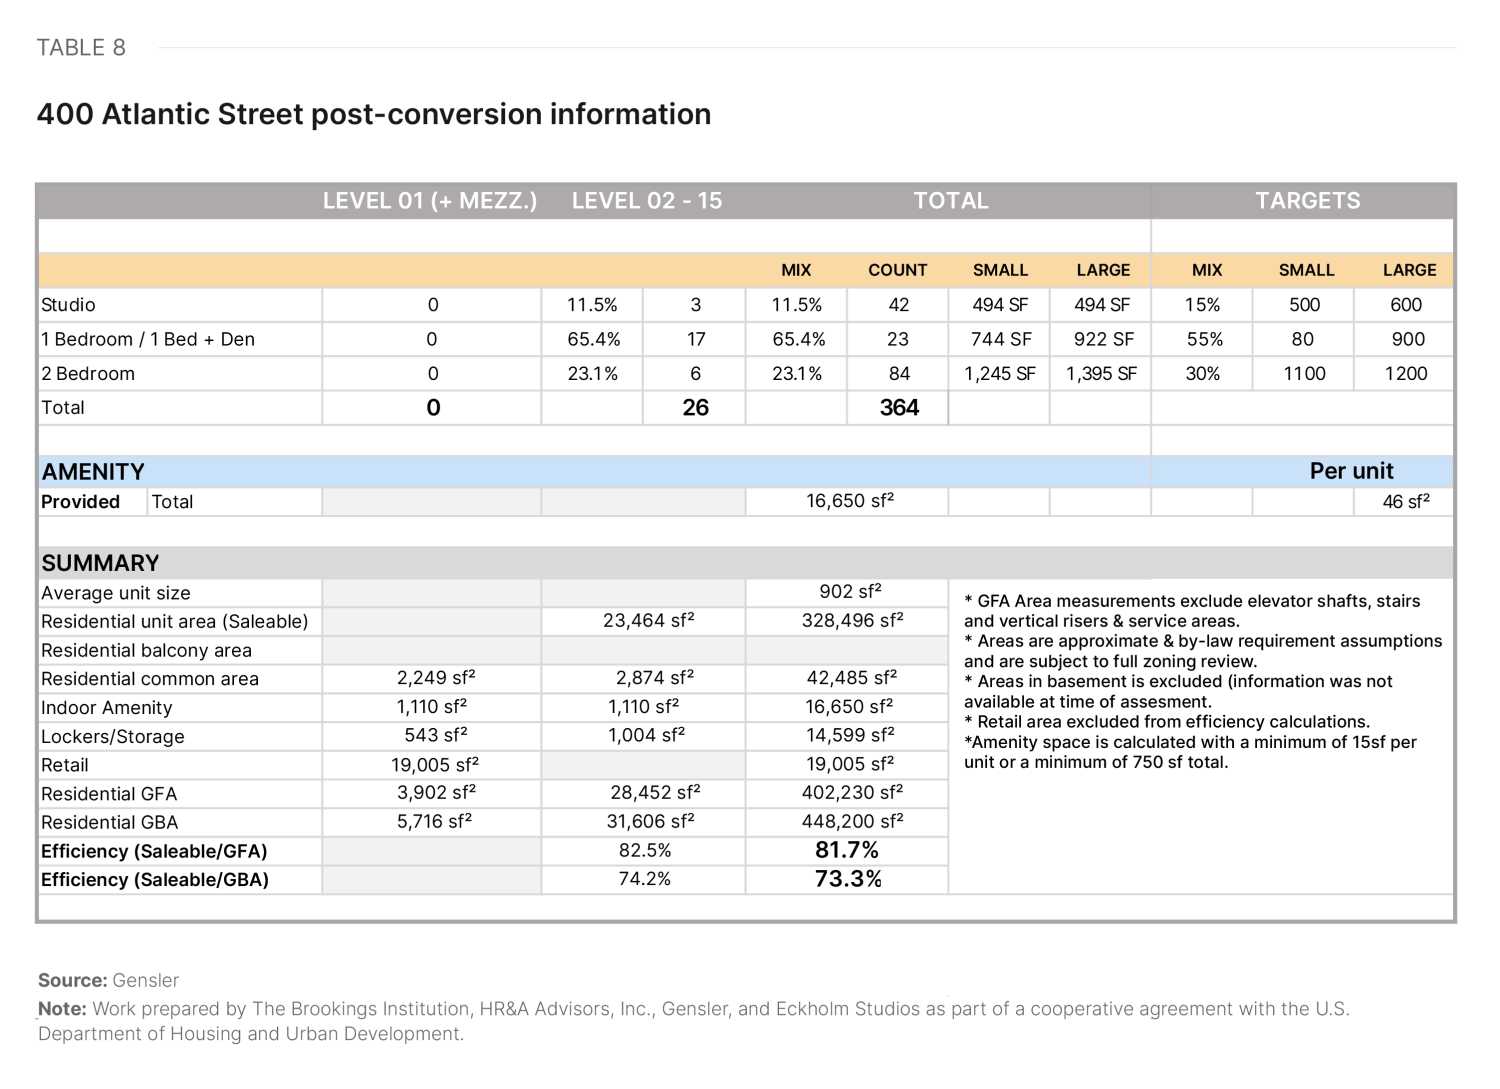
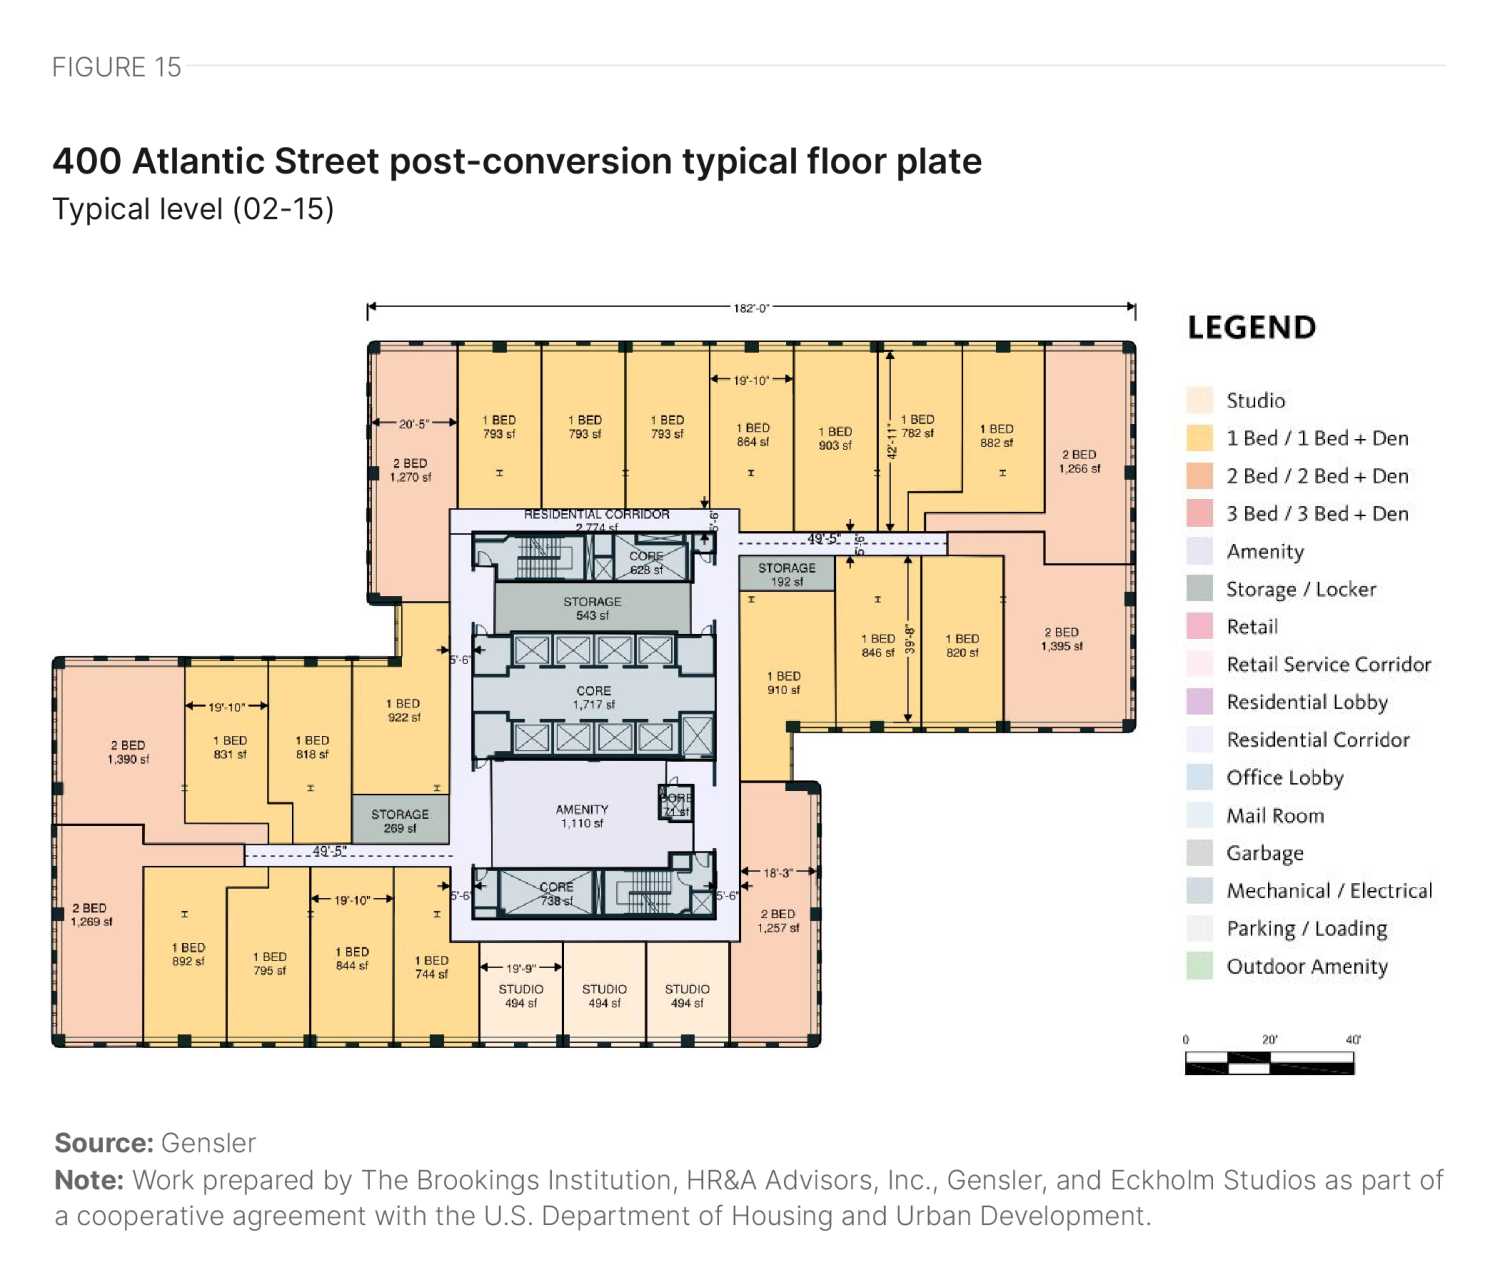
400 Atlantic Street

400 Atlantic St. is located centrally at the intersection of Atlantic Street and Tresser Boulevard. Built in 1980, it is a 16-story structure with a gross area of 502,886 square feet.
The building features a floor plate composed of two overlapping rectangular forms with a central core. Despite its relatively large size, the core-to-window depth, or lease depth, is nearly ideal. Although the centrally located deep spaces cannot be used for units, the floor plate achieves a reasonable level of efficiency and yields units close to market size (total yield in Table 8, diagrammed in Figure 15). A developer could utilize the deep spaces without direct access to natural light for amenities and/or storage. The façade, with punched windows on all sides, provides excellent access to views and daylight. The ground floor and mezzanine area are most likely suitable for retail, with part of the ground floor allocated to the residential lobby and service areas.
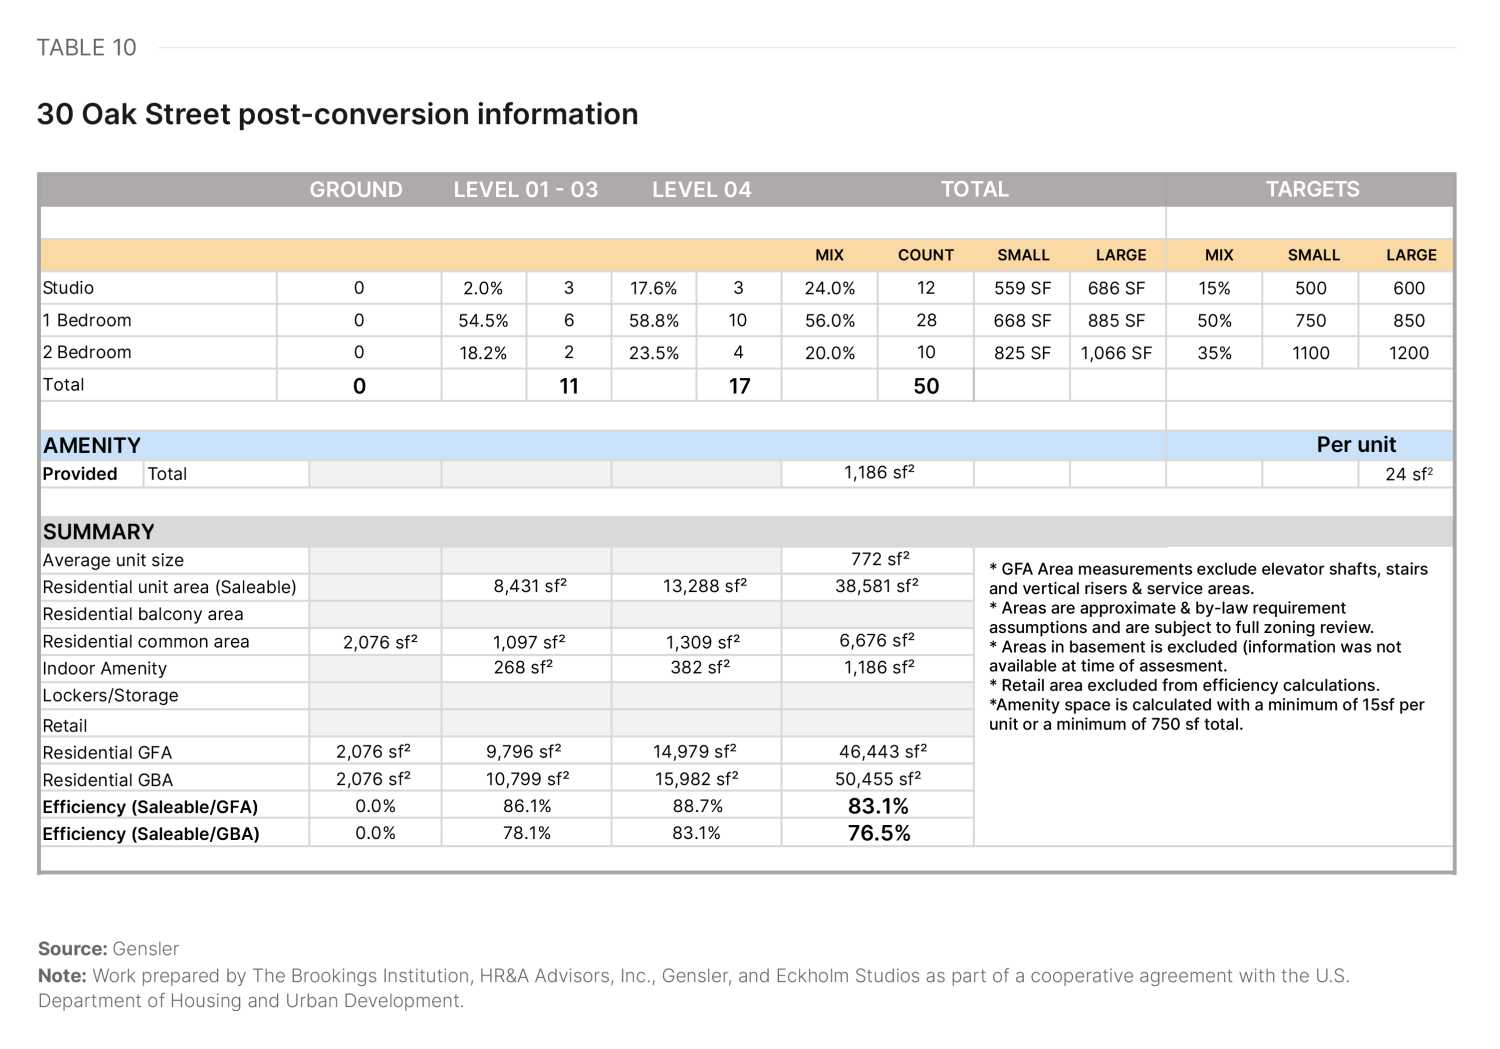
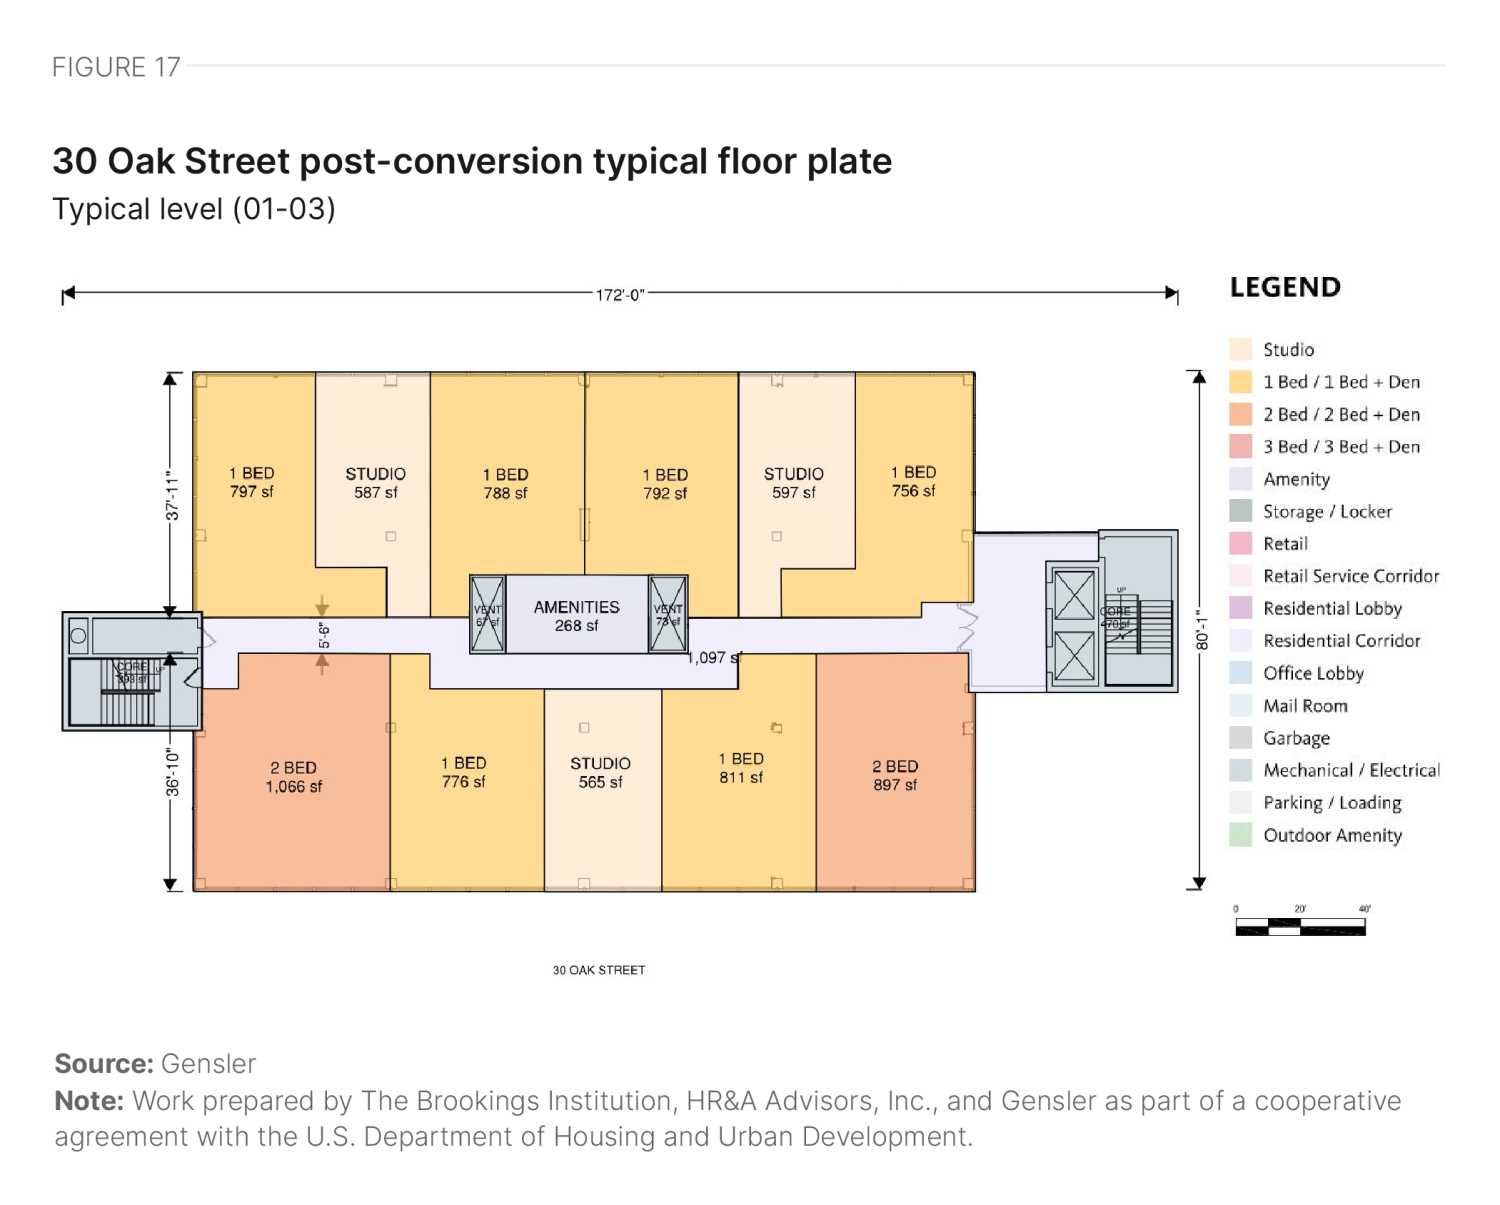
30 Oak Street
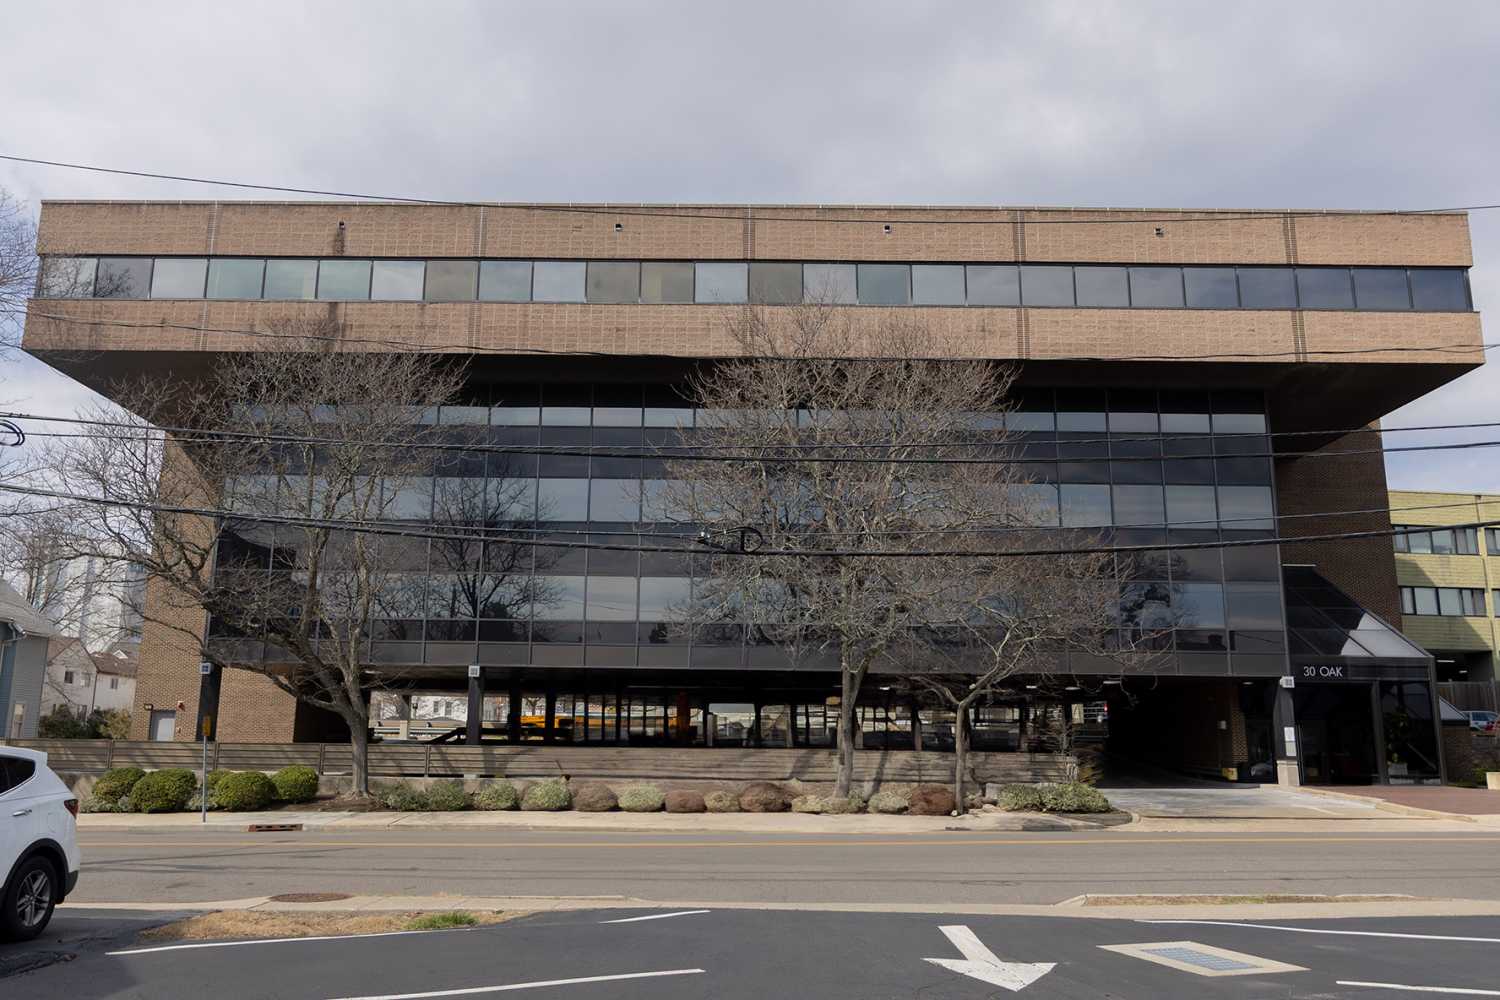
30 Oak St. sits on the northern edge of downtown Stamford, near the intersection of Summer Street and Oak Street. Built in 1980, it is a four-story structure with a gross area of 50,445 square feet.
The building features a rectangular floor plate with two circulation cores at either end and an almost ideal floor plate size. A developer could introduce a double-loaded corridor connecting the two cores, which allows for good floor plate efficiency (Figure 17). Two vertical shafts at the center of the floor plate can be retained for mechanical risers, and a developer could consider the interstitial space between them for amenity or storage use. The majority of the façade consists of a curtain wall, with the top floor featuring a band of ribbon windows, which increases the risk of a costly façade replacement. All sides provide good access to views and daylight, but if the façade is retained, operable sections may need to be added. The ground floor can remain as parking, with part of it allocated to the residential lobby and service areas. The total yield is shown in Table 10.
Future outlook
Stamford remains in very high demand as a place to live, with extremely strong fundamentals for quality of life. The disruption of the COVID-19 pandemic only strengthened this demand. Data from cell phone location-tracking technologies indicate that estimated unique visits to Stamford, and even visits within the downtown, on a typical Thursday in fall 2023 are up over 20% from the fall 2019 level (Table 11). However, this surge of demand means that housing affordability for both renters and owners in Stamford has become an existential crisis.
|
Winston-Salem |
St. Louis |
Pittsburgh |
Houston |
Los Angeles |
Stamford |
|
|---|---|---|---|---|---|---|
|
Citywide |
||||||
| Fall 2019 | 972,648 | 1,139,210 | 1,042,281 | 10,416,616 | 13,082,015 | 427,544 |
| Fall 2023 | 1,083,344 | 1,224,894 | 1,269,712 | 10,732,698 | 13,265,515 | 523,890 |
| Percent Change | 11% | 8% | 22% | 3% | 1% | 23% |
|
Downtown |
||||||
| Fall 2019 | 46,014 | 119,880 | 120,850 | 275,304 | 793,111 | 102,939 |
| Fall 2023 | 45,570 | 113,112 | 106,773 | 242,267 | 747,974 | 124,271 |
| Percent Change | -1% | -6% | -12% | -12% | -6% | 21% |
Source: Replica
Note: Work prepared by The Brookings Institution, HR&A Advisors, Inc., Gensler, and Eckholm Studios as part of a cooperative agreement with the U.S. Department of Housing and Urban Development.
Where do teachers live in Stamford? We don't have starter homes in Stamford anymore.
A Stamford stakeholder
Office-to-residential conversions represent a rare opportunity to introduce multifamily housing supply in a state known for its detached single-family housing stock. Such conversions neutralize one of the primary concerns about growth—parking—because residential conversion is typically a significant reduction in people per square foot within a building, and office buildings therefore have far more parking than they need to accommodate residential use. However, other concerns about growth remain, and even a place as overburdened with underperforming office product as Stamford does not have broad consensus that residential conversion is an attractive solution.
Office-to-residential conversion case studies


Authors
Authors listed in alphabetical order


-
Acknowledgements and disclosures
This research was supported by the U.S. Department of Housing and Urban Development under a cooperative agreement.
The authors thank Hanna Love for her review of this piece.
The authors also thank the following contributors for their invaluable assistance on this project:
Brookings:
- Mary Elizabeth Campbell – Research Assistant
HR&A:
- Stefan Korfmacher – Research Analyst
- Joe Speer – Analyst
Gensler:
- Diksha Jain – Architect
- Ingmar Buchner – Designer
- Lisa Matthews – Intern
- Nancy Yeh – Designer
- Jose Segura – Architect
Turner Construction:
- Reinaldo Rodriguez
All remaining errors and omissions are those of the authors.
The work that provided the basis for this publication was supported by funding under an award with the U.S. Department of Housing and Urban Development. The substance and findings of the work are dedicated to the public. The author and publisher are solely responsible for the accuracy of the statements and interpretations contained in this publication. Such interpretations do not necessarily reflect the views of the Government.
-
Footnotes
- Brookings analysis of American Community Survey 2022 5-Year Estimates and HR&A analysis of CoStar real estate market data as of Q3 2024.
- HR&A analysis of CoStar real estate market data for Q3 2024.
- HR&A analysis of CoStar real estate market data from 2000 to Q3 2024.
- HR&A analysis of CoStar real estate market data from 2010 to Q3 2024.
- HR&A analysis of CoStar real estate market data from 2014 to Q3 2024.
- HR&A analysis of CoStar real estate market data for Q3 2024.
- Brookings analysis of American Community Survey 2022 5-Year Estimates and HR&A analysis of CoStar real estate data from 2010 to Q3 2024.
- Brookings analysis of American Community Survey 2022 5-Year Estimates.
- HR&A analysis of CoStar real estate market data from 2020 to Q3 2024.
- Brookings analysis of American Community Survey 2022 5-Year Estimates.
- Area median income (AMI) is a key metric used in assessing housing affordability. It is defined as the median (midpoint) of a specific geography’s income distribution (such as a metropolitan area) for different household sizes. It is calculated each year by the U.S. Department of Housing and Urban Development (HUD). According to HUD, households should pay no more than 30% of their gross income on housing, and households that pay more than 30% are considered “housing cost burdened.” HR&A’s analysis of the percentage of units by AMI category in a market begins by establishing “affordable rent levels” that are equivalent to 30% of income at AMI for different household sizes; e.g., for a one-person household in an area with AMI of $X, the “affordable monthly rent level” would be ($X * 30%) / 12. With those rent levels established, the analysis compares unit rent levels to AMI levels at the household sizes that correspond to the number of bedrooms in a unit; e.g., a one-bedroom unit’s rent is compared against 30% of the AMI of a one-person household, and so on.
The Brookings Institution is committed to quality, independence, and impact.
We are supported by a diverse array of funders. In line with our values and policies, each Brookings publication represents the sole views of its author(s).