The nation’s largest cities have contended with a roller coaster of population shifts since the beginning of this decade. Many were severely impacted by the COVID-19 pandemic in the early part of the decade, with sharp declines or smaller gains in population growth, followed by a post-pandemic resurgence through 2023-24.
Now, recent Census Bureau estimates show a 2024-25 reversion to slowing growth in big cities. And rather than the pandemic-related causes of previous shifts, this big city growth slowdown can be attributed to the national decline in immigration and some shifts in domestic migration across the U.S. and its regions.
Practically all big cities saw recent population growth declines or outright losses
Census Bureau population estimates for 2024-25 show a sharp decline in U.S. population growth over the previous year. This was due in large part to a downturn in international migration, which led to pervasive growth declines in most states and metropolitan areas.
The most recent Census Bureau release focuses on population change in cities of different sizes1. These data show that as a group, the nation’s 92 largest cities (those with populations over 250,000) saw the biggest declines in population growth of cities across all size categories.

As Figure 1 shows, these 92 big cities saw their aggregate population growth decline from 1.13% in 2023-24 to just 0.31% in 2024-25. This was a bigger decline than that for the nation as a whole during this period (from 0.96% to 0.52%) or for any of the smaller-sized city categories.
The nation’s seven largest cities—each with populations over 1.5 million—saw especially sharp growth slowdowns. The two biggest cities (New York and Los Angeles) flipped from population growth in 2023-24 to decline in 2024-2025. Growth slowed (but still stayed positive) in Chicago and Philadelphia. And two rapidly growing Texas cities—Houston and San Antonio—experienced noticeably smaller population gains.

Similarly, 86 of the nation’s 92 largest cities did worse demographically in 2024-25 than in the previous year, with 56 showing slower growth, 24 flipping from zero or positive growth to decline, and six registering greater population declines. Map 1 displays these cities according to growth categories (see also downloadable Table A). Big cities that flipped from growth to decline are located across every U.S. region, including Dallas in the South; Denver in the Mountain West; Boston in the Northeast; and Cincinnati, St. Paul, Minn., and Milwaukee in the Midwest. This was also the case among the many cities that experienced slower 2024-25 growth, including Houston, Orlando, Fla., and Nashville, Tenn., in the South; San Jose, Calif., Las Vegas, and Phoenix in the West; Chicago, Indianapolis, and Minneapolis in the Midwest; and Philadelphia and Newark, N.J., in the Northeast.

Therefore, while the national growth slowdown in 2024-25 was fairly pervasive across the country, it hit nation’s biggest cities especially hard. Of course, there remained a sharp disparity in growth levels across these cities. Seven big cities registered 2024-25 growth rates exceeding 1.5%: Port St. Lucie, Fla.; Charlotte, N.C.; Fort Worth, Texas; Atlanta; Durham, N.C.; Henderson, Nev.; and Seattle. Meanwhile, St. Petersburg, Fla., Memphis, Tenn., and St. Louis registered declines exceeding 0.5% (see downloadable Table B). In terms of numeric gains, Charlotte and Fort Worth ranked first and second, respectively, on aggregate growth, both gaining about 20,000 people in 2024-25. New York lost the most residents: more than 12,000.
Recent growth shifts in the context of the pandemic and its aftermath
Last year’s decline in big city growth should be contextualized by the sharp population shifts—both down and up—that these cities experienced in recent years. Most noteworthy were the population declines many of these cities saw during the peak pandemic year of 2020-21—a consequence of employment, transportation, and other infrastructure shutdowns; the rise of hybrid work, which led to movement to the suburbs or other parts of the country; and a dip in natural increase due to higher numbers of deaths and lower numbers of births.
It was at this time that some feared an “urban doom loop” was in the making—a self-perpetuating cycle of population loss and urban disinvestment. Yet in the years that followed, many of the cities that suffered the biggest population declines during the pandemic began to attract more people, with gains rising through 2023-24 due to lower domestic out-migration and high levels of immigration. This was the backdrop for the growth slowdown in 2024-25.


Prior years’ population growth is evident from Figures 3 and 4. The former shows annual aggregate growth patterns for the nation’s 92 largest cities between 2010-11 and 2024-25. The latter displays how many of these cities lost population each year.
The data show that cities were doing fairly well in the early part of the 2010s decade, in part as a consequence of the Great Recession, which stranded many millennial young adults in cities due to stagnation in both the employment and housing markets. Over the first half of the 2010s, annual growth in these cities as a group was near to or greater than 1%, and relatively few individual cities registered population declines. Yet as the economy and suburban housing markets picked up, city growth levels declined and more cities began losing population.
Of course, the biggest downturn for cities over this period occurred during the peak pandemic year of 2020-21, when the aggregate population of these cities declined and 57 of 92 registered population losses. However, this decline gradually shifted to increasingly positive growth, such that in 2023-24, big cities grew by 1.13% as a group, with only eight individual cities registering negative growth.
This set the stage for the new growth downturn observed in 2024-25, as the aggregate big city growth level slumped to 0.31%—similar to that observed in 2021-22. At the same time, the number of big cities losing population rose to 32.



Some cities that experienced noticeable fluctuations over these periods were New York, Boston, Chicago, Minneapolis, Miami, Dallas, San Francisco, and Denver (displayed in Figure 5) (see downloadable Table A). Each of these cities showed a sharp growth downturn during the 2020-21 peak pandemic year, especially New York and San Francisco. But they differ somewhat in their growth rebounds, with some rebounding quickly (such as Dallas and Miami), and others taking longer (such as New York and Chicago). San Francisco has been widely noted for taking the sharpest demographic hit during the first year of the pandemic; it registered the largest percentage decline in its 2020-21 population (a loss of 6.76%). Yet San Francisco is also one of the few big cities that grew slightly faster in 2024-25 than during the previous year. This could be due in part to the migration dynamics associated with the unprecedented AI boom there.
Both domestic and international migration drove city population gains and losses
Clearly, migration dynamics have played a huge role in big cities’ roller coaster of population shifts over the past five years. Analyses of state and metropolitan area population changes over this period have highlighted the importance of domestic migration (movement within the U.S.) in shifting movement from coastal and Midwest states to the South and parts of the West during the peak pandemic years, only to have that movement pull back in the past few years. What’s more, it was international migration that led to both upward growth in many areas (as net immigration to the U.S. rose sharply through 2023-24) as well as later declines (as federal policies curtailed immigration in 2024-25).
It seems clear that these patterns should also impact cities, especially the nation’s largest ones, where: 1) movers responded to the pandemic by moving away and then returning somewhat as more normal business patterns re-emerged; and 2) immigration shifted from low in-movement during the pandemic to strong positive contributions through 2023-24, which were abated the following year.
The Census Bureau estimates for cities do not provide information for these migration components except in the few cases where city boundaries coincide with county boundaries. Figure 6 displays these components for three cities that are also counties or groups thereof: New York, San Francisco, and Denver.2 The demographic components include net domestic migration, net international migration, and natural increase (the excess of births over deaths).
In each of these cities, it is clear that the sharp 2020-21 rise in domestic out-migration was the primary contributor to the city’s population loss that year. Yet in the subsequent three years, reduced domestic out-migration and rising international migration improved those cities’ demographics, with the latter making the largest contribution in 2023-24.


In 2024-25, net immigration dropped in all three cities, contributing most to the population decline in that year for New York. Yet in Denver, domestic migration also became more negative, such that both kinds of migration contributed to its population loss. Unique among cities, San Francisco’s higher population gain in 2024-25 occurred despite the fact that immigration was noticeably reduced. Its gain instead came from a sharp reduction in domestic out-migration associated with its continued economic rebound, partly linked to the AI boom, which together with natural increase allowed the city to gain population.
The immigration and domestic migration patterns displayed for these cities are representative of urban core areas nationally. An analysis of 38 urban core counties within major metropolitan areas in all regions of the country found that 33 of them showed slower growth, greater decline, or flip from growth to decline between 2023-24 and 2024-25—and that the decline in international migration contributed most in these shifts (see downloadable Table C).
Big city growth patterns also influenced shifts in city-suburb growth dynamics
For quite a few decades, suburban growth exceeded city growth in major metropolitan areas, with a few exceptions such as immediately after the Great Recession, when city growth rose. This occurred again in 2023-24, when the aggregated “primary cities” of the nation’s 56 major metropolitan areas grew faster than their surrounding suburbs, as shown in Figure 7. (Note: Primary cities include up to three central cities in their metropolitan areas.)3
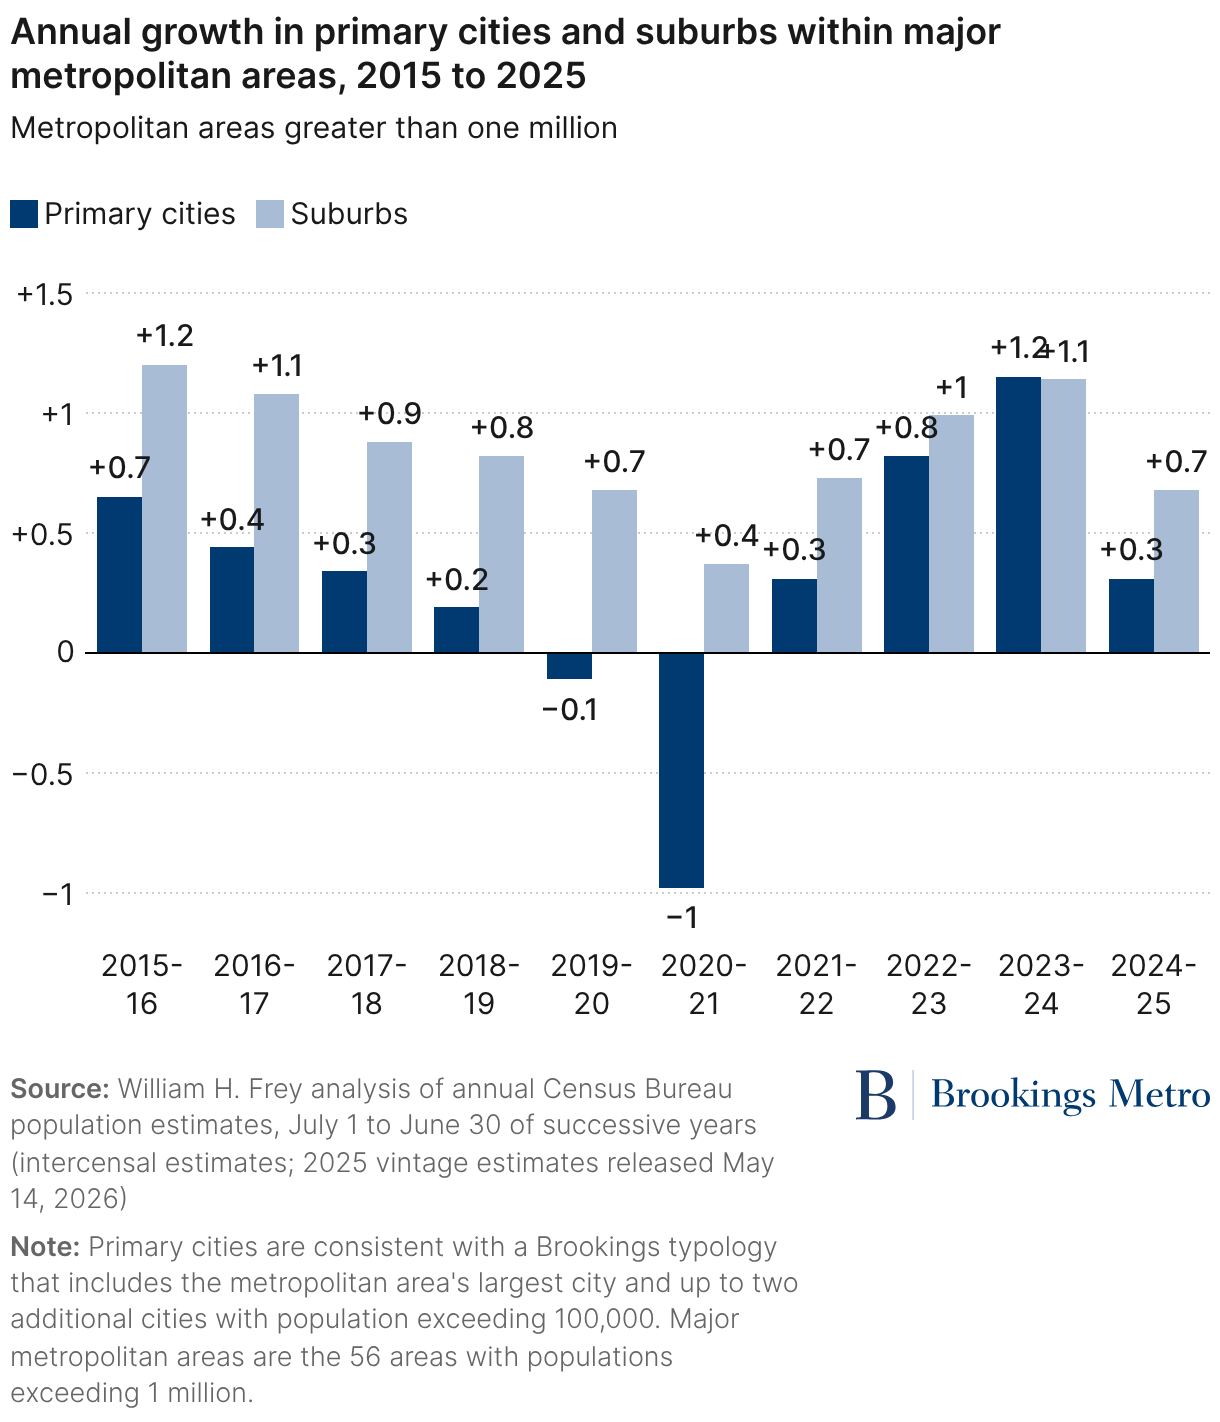
In the peak pandemic year of 2020-21, there was a sharp decline in the combined primary city populations of these metro areas, while the suburban portion of these areas exhibited positive growth, albeit smaller than in prior years. (In fact, these large metro areas, as a group, registered an absolute population decline during this year.)
Since then, both primary cities and their suburbs, in the aggregate, have registered population gains, with the former making greater strides so that their 2023-24 growth exceeded those of their suburbs. What’s more, 21 of the 56 metro areas exhibited primary city growth that was higher than suburb growth. This was true in metro areas such as New York, Los Angeles, Chicago, Washington, D.C., Miami, Detroit, Seattle, and Pittsburgh (see downloadable Table D).
Of course, in 2024-25, as big city and large metro area growth slowed, the primary cities of these major metro areas showed sharp population declines that were greater than that of their suburbs—though most individual primary cities as well as suburbs experienced growth slowdowns or shifts to losses. Still, primary cities took the greater hit and, among the 56 major metro areas, primary cities in 40 of them saw greater growth slowdowns than their suburbs, and primary cities in just 14 of them grew faster than their suburbs.


These city-suburb growth dynamics took somewhat different forms for individual metro areas. Metro area New York showed the classic shift from pre-pandemic suburban growth to a huge primary city loss in 2020-21, only see to city growth exceed suburban growth in 2023-24 before falling off in 2024-25 along with its suburbs. The Chicago metro area’s primary cities and suburbs registered similar growth patterns pre-pandemic; after that, its city population showed an accentuated decline in 2020-21 and 2021-22, followed by an accentuated gain in 2022-23 and 2023-24, before registering slower growth (similar to its suburbs) in 2024-25. In the Dallas metro area (where primary cities include Dallas, Fort Worth, and Arlington), as with some other big Sun Belt metro areas, suburban growth stayed well above primary city growth in all years, though both showed downward shifts during the pandemic, before rising and falling thereafter.
Finally, the San Francisco metro area—the prototypical pandemic-hit metro area—saw its primary city population (which includes San Francisco, Oakland, and Berkeley) register an exceptionally sharp decline in growth in 2020-21, at the same time its suburban ring also experienced a decline. Yet both parts of the metropolitan area rebounded in recent years, as domestic out-migration to other parts of the U.S. was noticeably cut.
Overall, big city growth shifts over the past five years also affected city-suburb dynamics in major metro areas, though both parts of these areas evidenced growth slowdowns in the past year.
What’s next for big cities?
The roller coaster of population declines, upticks, and growth slowdowns that most big cities experienced thus far this decade raises the question: What can we expect in coming years?
Hybrid work is slightly down from peak years, and pandemic-driven domestic migration shifts away from coastal and middle-of-the country metro areas have tapered off—creating some hope that big cities’ early-decade population losses or growth slowdowns would reverse. This clearly occurred up through 2023-24, as immigration in particular provided a huge boost to national population growth and especially to big metro areas and cities.
But the fact that 86 of the nation’s 92 biggest cities did worse demographically in 2024-25—the first year of the nation’s notable immigration downturn—suggests these cities are headed to even further population loss if, as many predict, immigration continues to decline. Of course, big cities vary in their economic and cultural attractions for potential local, national, and international movers. And the widespread growth resurgence in the three years after the pandemic suggests another bounce back is possible. This would especially be the case if immigration is revived to levels we saw in those years, if more cities evolve into advanced industrial and AI hubs, or if America’s youth—as they enter their highly mobile ages—follow earlier young adult generations and manifest a preference for city living.
Author

-
Footnotes
- The data analyzed here for cities are annual population estimates compiled by the Census Bureau’s population estimates program, including: intercensal estimates for single years between July 1, 2010, through June 30, 2020; and vintage 2025 estimates for single years between July 1, 2020, through June 30, 2025. The latter were released by the Census Bureau in May 2026. These estimates supersede previously released Census Bureau estimates for these years
- The city of San Francisco is coincident with San Francisco County, Calif.; the city of Denver is consistent with Denver County, Colo.; and the city of New York is consistent with the combined Bronx, Kings, New York, Queens, and Richmond counties, N.Y.
- Brookings Metro defines “primary cities” as one or more cities in the official metropolitan statistical area name with populations exceeding 100,000. (See downloadable Table D for the list of complete names of metropolitan statistical areas.) In the analyses shown here, the primary cities are New York and Newark, N.J., for the New York metropolitan area; Chicago, Naperville, and Elgin, Ill., for the Chicago metropolitan area; Dallas, Fort Worth, and Arlington, Texas for the Dallas metropolitan area; and San Francisco, Oakland, and Berkeley, Calif., for the San Francisco metropolitan area. The remaining portion of the metropolitan area population located outside of these primary cities is referred to as the suburbs.
The Brookings Institution is committed to quality, independence, and impact.
We are supported by a diverse array of funders. In line with our values and policies, each Brookings publication represents the sole views of its author(s).